
(Feature Image: Flash flood in Chenab valley on July 06, 2026 buried several vehicles at Kwar HEP site in Kishtwar. Source: NDTV)
Over the past one and a half months of the 2026 monsoon season (since June 24), at least eight (& counting) major accidents and disasters have affected hydropower and dam projects across the Himalayan region. In addition, two recurring landslide lakes have emerged as significant hazards that are either linked to HEP construction activities or have the potential to impact downstream hydropower infrastructure. Notably, these incidents span the Teesta, Brahmaputra, Chenab, Ravi, Beas, Sutlej and Yamuna basins underlining that almost no major Himalayan river basin remains untouched by recurring hydro-related disasters.
The deadliest incident occurred at NHPC’s Teesta Stage-VI HEP in Sikkim, where a methane explosion inside an under-construction tunnel killed 25 workers. Before this, a flash flood near NEEPCO’s Panyor Lower (Ranganadi) HEP colony in Arunachal Pradesh claimed at least five lives, injured several others and exposed serious shortcomings in rainfall monitoring, flood forecasting and emergency response.
While flash floods in the Chenab and Ravi basins disrupted construction at the Kwar, Ratle and damaged Chanju-III HEPs, the landslides at the Chamera-III HEP and the under-construction Lakhwar Dam in the Yamuna basin exposed the vulnerability of workers and project infrastructure. Meanwhile, the expanding landslide lake on Jiva nullah in the Beas basin and the recurring artificial lake at Lippa in the Sutlej basin have renewed fears of sudden downstream flooding.
The repeated occurrence of these incidents across different river basins points to systemic problems including gaps in project planning, geological, hydrological & environmental appraisal, monitoring, SOPs, management plans, independent assessments, accountability norms and regulation. Some common issues include inadequate geological investigations, poor cumulative impact assessment, unsafe muck disposal, weak hazard monitoring, limited disaster preparedness and poor public disclosure after accidents. Climate change is making matters worse by increasing the frequency of cloudbursts, extreme rainfall and flash floods. Worker safety is another major concern as most of the victims are migrant workers employed in hazardous conditions often with inadequate safety measures and emergency protection.
These disasters are becoming more frequent and severe and should serve as multiple wake-up calls for governments, developers, local communities, workers and regulators. Every major accident should be independently investigated, with the findings placed in the public domain and accountability fixed. Future projects need basin-wide cumulative impact assessments, stronger geological and climate-risk appraisal, continuous monitoring, clearly defined and legally mandatory SOPs and management plans, better worker safety, effective early warning systems and transparent disaster management. We are lacking in each of these aspects. Without these reforms, such disasters are likely to become more frequent, possibly more damaging, causing greater human, ecological and economic losses across the Himalaya.
Sikkim: 25 Workers Killed in NHPC Teesta-VI HEP Tunnel Disaster NHPC’s Teesta Stage-VI tunnel disaster has become one of the deadliest accidents in India’s hydropower construction sector and another stark reminder of the multiple hazards associated with large infrastructure development in the fragile Himalayan region.
Beyond the tragic loss of 25 lives, the latest disaster highlights the urgent need for stronger geological investigations, continuous hazard monitoring, real-time gas detection, robust ventilation systems, independent safety audits and specialised underground rescue preparedness at major tunnelling projects.
June 2026: Flash Flood Disaster at NEEPCO’s HEP Site A severe flash flood spell in the Poosa–Yazali area of Keyi Panyor district, Arunachal Pradesh on June 24, 2026, has significantly affected NEEPCO’s 43 colony located near the Panyor Lower Hydroelectric Project (PLHEP) site, close to the reservoir of the HEP. The disaster occurred around 6 in the morning, heavy spell creating a cloud burst like situation. The flood appears to have originated in a Pai (Possa) stream passing through Possa village and joining the Panyor river from the southern side, about 2 km upstream of the PLHEP dam.
The incident highlights the growing exposure of hydropower projects and associated infrastructure in Himalayan region to extreme rainfall, flash floods and debris flows and other disasters under a changing climate. It also shows that the safety of the dams cannot be assessed solely in terms of its structural strength and operations. The associated infrastructure such as colonies, roads, retaining walls, bridges and emergency access routes can also become critical points of failure making the dam and downstream areas vulnerable to additional disasters.
The disaster further underlines the urgent need for basin-level early warning, flood forecasting, increase in hydrometeorological monitoring networks, transparent reservoir operation protocols & information about reservoir operations, functioning of EWS and regular disaster preparedness audits for hydropower projects in the Himalayan region.
July 2026: Workers Injured by Rockfall near Chamera-III Dam Site A rockfall at the dam site of the 231 MW Chamera-III Hydro Project narrowly averted a major tragedy on July 24, 2026. The incident occurred close to the dam construction area around 6 PM near Kharamukh on the Pathankot–Bharmour NH in Chamba district, Himachal Pradesh. Around 25 workers were present at the site when a section of the hill slope suddenly collapsed, sending large boulders and debris crashing onto the project site amid a massive cloud of dust. Panic spread across the construction area as workers rushed to safer locations. While most escaped in time, three workers sustained minor injuries after being struck by falling stones.
July 2026: Flood Damages Chanju-III HEP Again in Ravi Basin The increasing incidents of disasters and violations have also raised serious questions about HPPCL’s project planning, construction practices, environmental compliance and disaster preparedness. Before proceeding with its construction, the project should undergo a comprehensive review covering geological stability, cumulative disaster risks, environmental compliance and worker safety through an independent expert assessment.
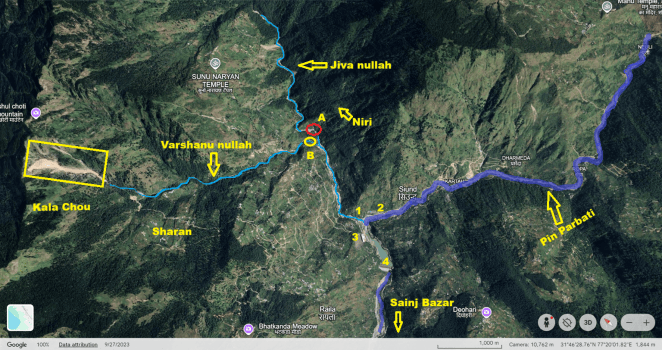
July 2026: Flood Threat from Landslide Lake in Sainj Valley The repeated landslides in July 2026 around the artificial lake formed on Jiva nullah near Niri village in Sainj Vally in 2023, have enlarged the impounded water body and renewed fears of downstream flooding. While the administration has intensified monitoring through SDRF inspections, local communities continue to seek proactive interventions before another episode of heavy rainfall triggers a major disaster.
July 2026: Recurring Artificial Lake Floods Lippa in Sutlej Basin The recurring formation of an artificial lake at Lippa in Sutlej basin highlights the increasingly dangerous interaction between extreme rainfall, the fragile Himalayan landscape and hydropower project. While the immediate trigger has been intense monsoon-induced flash floods, the repeated impoundment of water points to deeper issues of inadequate drainage, poor muck disposal and the cumulative impacts of hydropower development in the basin.
Unless these underlying causes are addressed through comprehensive management, scientific muck disposal, restoration of natural drainage channels and continuous monitoring of vulnerable mountain streams, Lippa is likely to remain exposed to recurring artificial lakes, placing homes, public infrastructure and local livelihoods at risk every monsoon.
July 2026: Chenab Flood Damages Ratle HEP Coffer Dam in J&K The reoccurring disasters have once again highlighted the growing vulnerability of HEP construction sites across the Chenab basin. They also underscore the need for a cumulative risk assessment and an independent review of disaster preparedness at HEP sites in Himalayan region. This particular disaster needs an independent assessment to understand the role of upstream Kwar Project water releases, SOPs and preparedness of the Ratle project to possible high inflows and how the floods were tackled.
July 2026: Flash Flood Disaster at Kwar HEP Site in Chenab Valley Though, the Kishtwar District Disaster Management Plan (DDMP) 2024-25 acknowledges the potential flood and landslide risks of hydro projects, however it appears to rely primarily on CVPPL’s Disaster Management Plan (DMP). According to the DDMP the CVPPL has its DMP ready to tackle with any disaster like situation. However, the CVPPL has yet to issue an official press release detailing the overall impact of the disaster on the project and its infrastructure.
Fragile Chenab Basin Under Pressure Irshada Mir highlights the growing ecological threats facing the Chenab Basin due to expanding riverbed mining, quarrying, stone crushing, hydropower projects and road construction in one of the Himalayas’ most fragile landscapes. He argues for basin-wide cumulative impact assessments instead of project-wise clearances, warning that fragile geology, landslides, seismic activity and climate change have made the basin increasingly vulnerable. The article concludes that stronger enforcement, scientific monitoring and ecosystem-based river management are essential for the Chenab Basin’s long-term ecological security.
July 2026: Two Landslide Incidents at Lakhwar Dam in Three Days The under-construction Lakhwar dam site on the Yamuna river in Dehradun district of Uttarakhand witnessed two landslide incidents within three days in July 2026. Although there was no loss of life, both incidents damaged construction machinery, exposed the risks faced by workers, and revived concerns about slope stability, construction practices and the suitability of building such a large dam in the fragile Himalayan region.
Flash flood at Song dam site A flash flood incident have reportedly affected the construction work of Song dam in Dehradun. Though there is not much information available about the overall incident, viral videos on social media show project machinery and vehicles trapped in the deluge on July 28.
HYDRO POWER PROJECTS
India’s rarest heron faces a silent end as new dam ignores its home Once a dam in the Lohit river basin is built, it could alter the water’s turbidity and flow, and lead to the local extinction of white-bellied herons. The bird was first scientifically described in 1878, based on specimens from the Teesta region. The species does not occur there today. In fact, it has been ‘critically endangered’ since 2007. The white-bellied heron (Ardea insignis)is among the world’s most elusive birds, nesting along fast-flowing rivers lined with old growth forests. “India has a population of six to nine individuals distributed in three rivers: Noa-Dehing River, Lohit River and its tributary Lahm River”, says Yumlam Benjamin Bida of ATREE (Bangalore).
DAMS
Two die, two missing at Polavaram Dam site Two persons died at the Polavaram Project on July 27. Four workers entered the seepage area (where canal was being dug for dewatering) in Gap 2 area to secure crane hooks to an excavator when operator Takasi Nageswara Rao (50) slipped into deep water. Mechanical engineer Koduri Ravikanth (30), a native of Vizag district, tried to rescue him but was swept away, Polavaram SI P Appa Rao said. Search operations on for others.
Four days back, when the canal was being dug, the Poclain machine sank in it. On July 27, the Poclain driver tried to find the machine, and it began to sink. Ravikanth tried to hold him and drag him out and save him from the canal, but both went under the water and lost their lives.
Pilot desilting project at Bhakra Dam The Bhakra Beas Management Board (BBMB) has launched pilot desiltation projects in the Gobind Sagar reservoir of the Bhakra Dam, aiming to excavate nearly 100 million cubic metres (MCM) of sediment over the next 10 years.
In a written response to a query by Hamirpur MP Anurag Singh Thakur, Union minister of state for power Shripad Naik informed the Lok Sabha on July30 2026 that the pilot works are being undertaken at Luhnoo Ground in Bilaspur and Seer Khad. The projects will operate under a competitive bidding, revenue-generation model. Winning contractors will be allowed to commercially sell the excavated silt after paying applicable royalties, taxes, duties, and statutory levies to the Himachal Pradesh govt.
The minister clarified that while the Himachal Pradesh govt issued a show-cause notice to BBMB on June 3 regarding the tenders—to which BBMB replied on June 9—the project was not delayed due to state objections. Initial tenders invited in March and April 2026 were cancelled after bidders failed eligibility checks. The revised tender for Seer Khad opened on July 23 with three participating bidders, and work will start after contract award and statutory state clearances.
Naik added that BBMB is executing the work per the Union ministry of jal shakti’s national framework rather than a standalone policy. BBMB is also participating in the World Bank-supported dam rehabilitation and improvement project (DRIP) phase 2 and 3, tasking the Geological Survey of India with mapping sediment-generation hotspots and landslide susceptibility from Kol Dam down to the Bhakra catchment area.
IIT Ropar study claims Bhakra siltation 38% and not 47% as per BBMB study According to the IIT Ropar study, the team has estimated the overall capacity loss of the reservoir at 38 per cent, compared to the 47 per cent estimated by the BBMB. The study has also reported that the loss of live storage stands at 13 per cent, considerably lower than the 19 per cent assessed by the BBMB. Similarly, the IIT study has pegged the loss of gross storage at 19 per cent, against the 26 per cent estimated by the BBMB. (It is confusing how is the capacity loss figure different than gross storage loss.)
The IIT Ropar research has also contradicted the BBMB’s assessment of annual silt inflows into the reservoir. While the Board has estimated that the Bhakra reservoir receives around 39 million cubic metres (MCM) of silt annually, the IIT Ropar scientists have assessed the inflow at 31 MCM, which is even lower than the reservoirs original design estimate of 33.61 MCM per year. (This makes IIT Ropar conclusions even less likely to be realistic.)
Senior BBMB officials attributed the variation in findings to the survey techniques adopted by the IIT team. They said the institute had used modern bathymetric surveys, drone-based mapping and much denser cross sectional measurements to assess the sediment deposits. The IIT scientists conducted surveys at intervals of about 30 metres, enabling them to capture finer variations in the reservoir bed, whereas the BBMB’s conventional surveys relied on cross sections spaced approximately 610 metres apart.
NDSA clears Keleshwaram repairs, final design by Aug end The technical oversight committee (TOC) constituted by the Union ministry of jal shakti has expressed satisfaction with the extensive studies and tests being carried out for the repair and rehabilitation of the Medigadda, Annaram and Sundilla barrages under the Kaleshwaram lift irrigation project.
The committee has asked Telangana officials to proceed with preparing detailed repair designs, which are expected to be finalised by the end of Aug. At its first meeting on July 31 2026, the TOC reviewed the progress made so far and was briefed by Telangana irrigation officials. Officials made detailed presentations on the geo-technical investigations, safety assessments and other studies.
A major part of the discussions focused on the restoration of Medigadda barrage’s block 7 section, where structural damage had triggered concerns over the project’s safety. While the NDSA had earlier recommended removal of the entire block 7, the TOC discussed multiple rehabilitation options with state officials. “One option is completely removing the block 7 of Medigadda and construct new in the same place. The other option is construction of another block ahead of the present block 7 and another is converting the block into a spillway. The committee has discussed pros and cons of the three options,” a senior irrigation department official said.
The committee, however, did not deliberate on issues relating to water impounding or pumping operations at the barrages, as these matters do not fall within its terms of reference, officials added.
Mekedatu: TN CM writes to PM seeking intervention Tamil Nadu Chief Minister C. Joseph Vijay, on July 28, 2026, wrote to Prime Minister Narendra Modi seeking his intervention to ensure no statutory or administrative approval is granted to the Mekedatu project unless it is demonstrably consistent with the Cauvery Water Disputes Tribunal (CWDT) Award and the judgment of the Supreme Court.
Mr. Vijay also called for withdrawal of the reply given by the Union Minister of State for Jal Shakti Raj Bhushan Choudhary in Rajya Sabha on July 27 with regard to the Mekedatu project. The Minister had said the judgment of the Supreme Court on Feb 16, 2018, does not expressly stipulate that Karnataka should obtain the consent of the lower riparian States before constructing a structure across the Cauvery. Mr Vijay said the Minister’s reply was made without referring to the settled law and legal principles in inter-State water issues.
In his letter, the Chief Minister said, “This disappointing reply from the Union Minister of State for Jal Shakti seems to have been made without taking into consideration the prevailing legal position and settled law with regard to the consent of the lower riparian States.”
He said the Constitution Bench of the Supreme Court, in the Alamatti case between the States of Karnataka and Andhra Pradesh, ruled that the consent of the lower riparian State is absolutely necessary. Mr. Vijay also quoted the relevant paragraph from the judgment, which said: “Nor can Karnataka State be permitted to construct up to that height without the consent of all other riparian States as well as without the approval of the Central Government…”
As far as the Cauvery Tribunal Award is concerned, the Supreme Court expressly affirmed Clause XVIII of the Tribunal Award, which preserves the power of each State to regulate waters within its territory only “in a manner not inconsistent with the order of the Tribunal.” Thus, any project that has the potential to affect the regulated flow regime established under the Award necessarily requires scrutiny for consistency with the Award, Mr. Vijay said.
The Tribunal itself has laid down important guiding principles. In the case of Kerala’s Pambar Hydro-electric Project, involving only 0.1 TMC of consumptive use, it directed that Kerala and Tamil Nadu should jointly agree upon the schedule of releases so that downstream irrigation is not adversely affected. This demonstrates the Tribunal attached paramount importance not merely to annual quantities but also to the coordinated regulation of releases affecting lower riparian interests, the Chief Minister said.
Further, Clause XI of the Award specifically prohibits any upper riparian State from taking action affecting scheduled deliveries to downstream States except through mutual agreement and consultation with the regulatory authority. Clause XX similarly recognises that modifications to the Award can only be achieved through agreement among the party States, Mr. Vijay pointed out.
“Tamil Nadu is therefore of the considered opinion that the proposed Mekedatu Project cannot be evaluated merely as an engineering proposal. Its legal permissibility must first be examined in the context of the Final Award of the Cauvery Water Disputes Tribunal, the judgment of the Supreme Court on February 16, 2018, and the rights of the lower riparian States,” he said.
It is pertinent that the Detailed Project Report submitted by Karnataka in 2019 was returned by the Central Water Commission for revision to ensure compliance with the Tribunal Award and applicable guidelines. This itself demonstrates that compliance with the Award remains an indispensable precondition, Mr. Vijay pointed out.
He urged the Union government to ensure the rights of the lower riparian States in relation to both the quantum and the regulated pattern of releases are fully protected. Any future consideration of the project shall be undertaken only after a comprehensive technical and legal examination, taking into account the concerns of all lower riparian States, he said.
The Cauvery is not merely a source of water but the lifeline of millions of farmers and citizens across south India. Protecting the integrity of the Tribunal Award and the judgment of the Supreme Court is essential for maintaining confidence in the constitutional mechanism governing inter-State rivers, Mr. Vijay added.
Centre sticks to its stand on the Mekedatu dam project The Union government, on July 30 in the Lok Sabha, reiterated the reply on the issue of Mekedatu dam it gave early this week in the Rajya Sabha. Replying to the question posed by the DMK’s MP Dayanidhi Maran on the impact of the dam project in Tamil Nadu, the Union Minister of State for Jal Shakti Raj Bhushan Choudhary informed the Lower House that in the Supreme Court judgment of February 2018 on the Cauvery dispute, “there is no mention that State of Karnataka has to obtain the consent of the other riparian States namely Tamil Nadu, Kerala and UT [Union Territory] of Puducherry to construct any kind of structure across the river Cauvery.” To this effect, the Court had cited the relevant clause in the final award of the Cauvery Water Disputes Tribunal.
Karnataka needs no consent from riparian states: Centre In a written reply to a question in the Lok Sabha, Minister of State for Jal Shakti Raj Bhushan Choudhary stated that the Supreme Court’s judgement dated February 16, 2018, in the Cauvery water dispute case makes no mention of Karnataka needing approval from Tamil Nadu, Kerala, or the Union Territory of Puducherry for building any structure across the river.
Youth oppose Mamallan reservoir in Chennai Nearly 30 youth organisations from across Chennai organised a ‘March for the Marshlands’ on Saturday morning, calling for the protection of the city’s wetlands and urging the state government to reconsider the proposed Mamallan Reservoir project. The protesters alleged that the land identified for the reservoir is part of a wetland ecosystem and said the project would severely affect the livelihoods of fishing communities dependent on it. They demanded that the government halt the project and commission an independent scientific assessment before taking any further steps.
Greens urge govt to halt to Mamallan reservoir work More than 25 environmental and community organisations under the banner of the Save Nemmeli Marshlands Collective have urged the Tamil Nadu government to reconstitute the High-Level Technical Committee examining the proposed Mamallan Reservoir Project and suspend all construction activities until an independent review is completed.
In a letter addressed to the Minister for Rural Development and Water Resources N. Anand, Chief Secretary M. Sai Kumar, and other officials, the collective said the committee, headed by the Chief Engineer (Chennai Region) of the Water Resources Department (WRD), presented an inherent conflict of interest as the WRD itself was the project proponent.
Traditional fisherfolk from villages between Kanathur Reddikuppam and Kokkilimedu have urged the fisheries department not to issue a No Objection Certificate (NOC) for the proposed Mamallan reservoir, warning that it would seriously affect their livelihoods.
In a representation to the state on Thursday, they said the reservoir project had already received Coastal Regulation Zone (CRZ) clearance from the State Coastal Zone Management Authority in December 2025. As per the petition, the proposed project site is a vital fish breeding habitat and has been used for fishing by fisherfolk and the Irula community for generations. The communities said the stretch from Kanathur Reddikuppam to Kokkilimedu Kuppam constitutes their primary fishing ground.
Naturalists and conservationists say the project’s environmental assessment raises questions about its claims on flood mitigation, groundwater recharge and ecological impacts. The site is a critical habitat for migratory birds, which will be impacted if the landscape changes. Fishing communities who depend on the wetland also worry about the project’s impact on their livelihoods.
DAM SAFETY
Odisha completed Dam Safety Reports of 56 dams, 162 dam reports still pending The Odisha Water Resources department manages 218 dams out of which CDSE (Comprehensive Dam Safety Evaluation) has been completed for 56. The CDSE for 162 dams are yet to be completed. Besides, CDSE milestones for major dams like Hirakud and Rengali have also not been carried out. Expert panel inspections and special committee meetings for Hirakud are actively underway for completion of final report.
The issue was raised by Water Resources department in a letter to the chief engineer, dam safety on July 27. The chief engineer has been asked to institute a monthly monitoring mechanism to review the progress of CDSE and submit a report to the department. He has also been advised to designate one responsible officer for each dam to coordinate with the department in this regard. The chief engineer has also been advised to immediately organise a capacity-building workshop for all dam safety officers managing the 56 dams where the CDSE has been completed. 20 independent panels of experts have been constituted by the department to study the evaluation reports.
INTERLINKING OF RIVERS
Ken–Betwa Project: Forced Displacement, Incomplete Rehabilitation and Broken Homes of Adivasis and Farmers The Ken–Betwa Link Project, India’s first river-linking project, has become synonymous with forced displacement of Adivasis and farmers, inadequate rehabilitation, and environmental destruction, despite being promoted as a development initiative. According to Himanshu Thakkar, Coordinator of the South Asia Network on Dams, Rivers and People (SANDRP) and an environmentalist, neither the Environmental Impact Assessment (EIA) nor other available studies provide a clear analysis of how the project will affect downstream villages, water availability, agriculture, and river ecology.
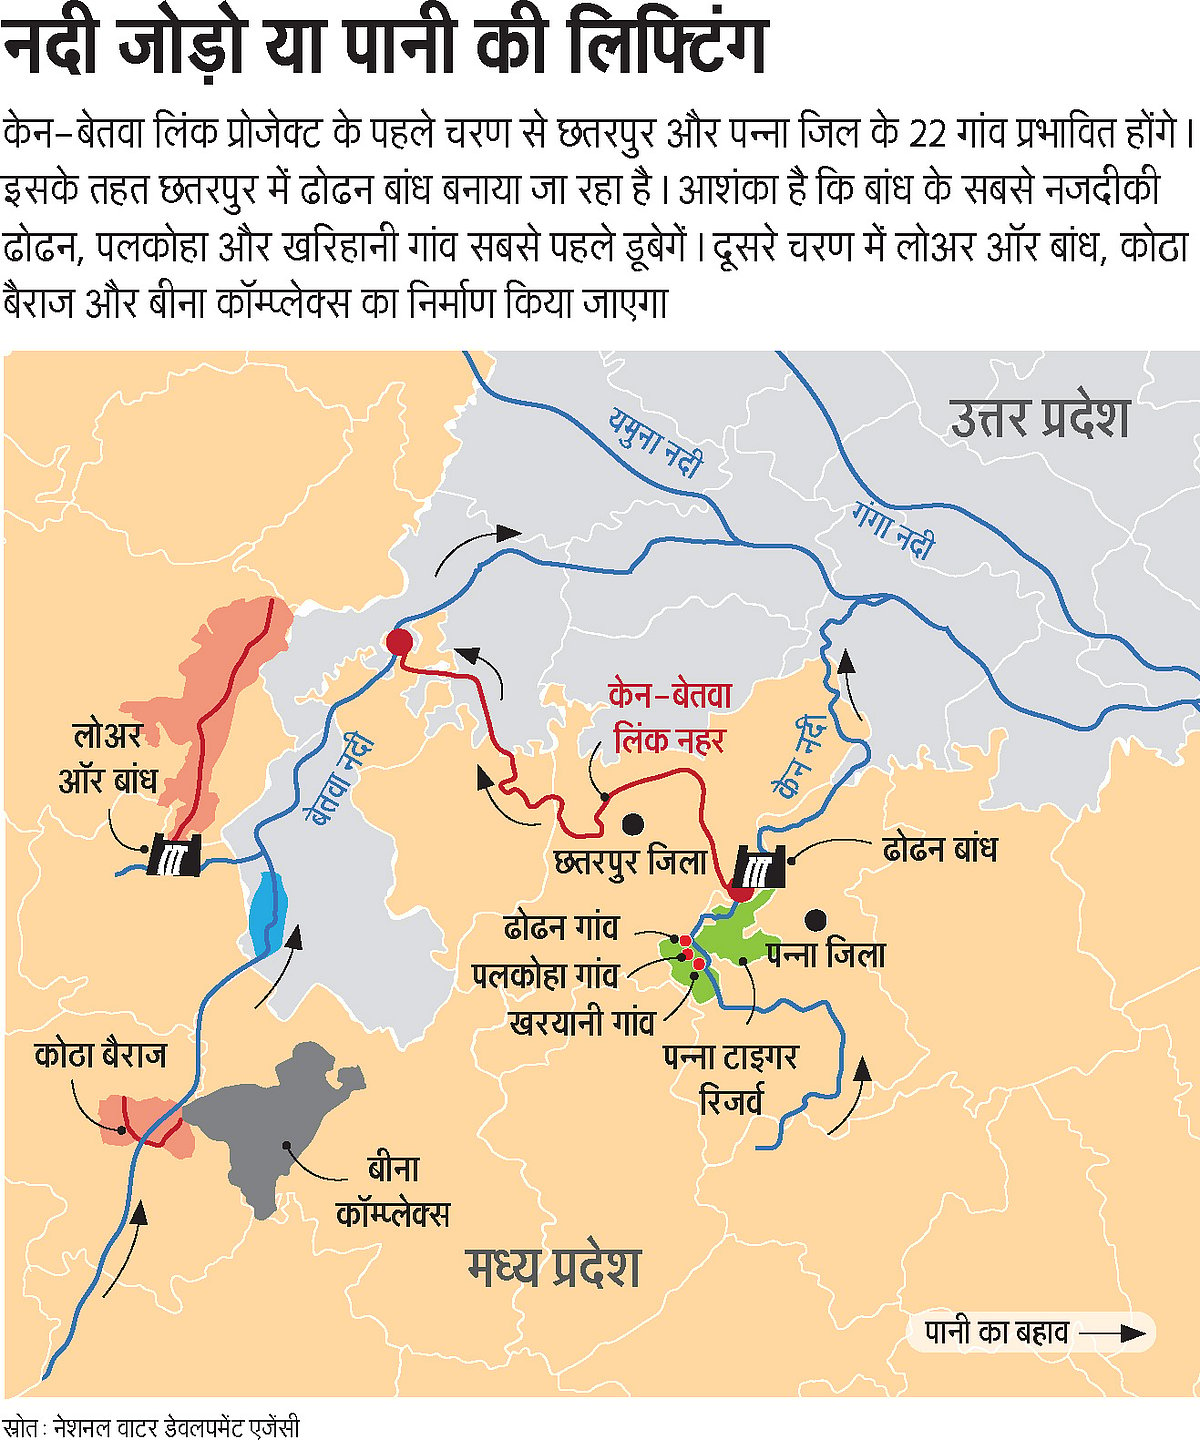
He argues that the project has also been accused of violating several important environmental and forest clearance conditions. Thakkar advocates alternative approaches instead of the project. He believes that reviving Bundelkhand’s traditional water harvesting structures, promoting rainwater harvesting, groundwater recharge, and watershed development could provide a far more sustainable and cost-effective solution to the region’s water scarcity.
INTERSTATE WATER DISPUTES
Tamil Nadu Seeks SC Direction for Immediate Cauvery Water Release The Dravida Munnetra Kazhagam (DMK) has moved the Supreme Court seeking urgent directions to Karnataka to release Cauvery River water to Tamil Nadu in accordance with the Cauvery Water Management Authority (CWMA) order. The CWMA had upheld the Cauvery Water Regulation Committee’s direction requiring Karnataka to release 3,500 cusecs of water per day for 15 days at the interstate border at Biligundlu to support irrigation, particularly the Kuruvai crop season.
The petition has been filed by A.K.S. Vijayan, a DMK leader and farmer owning agricultural land in the Cauvery Delta, who argued that Karnataka’s failure to comply is affecting farmers’ livelihoods. The application also recalls the long-standing Cauvery water dispute, the 2007 Cauvery Water Disputes Tribunal award, and the subsequent establishment of the CWMA and Cauvery Water Regulation Committee to regulate water sharing.
Karnataka CM invites CM Vijay to inspect Cauvery dams by helicopter CM DK Shivakumar on July 29, invited his Tamil Nadu counterpart C Joseph Vijay to undertake an aerial survey of the Cauvery basin in Karnataka, offering to arrange a helicopter so that he could personally assess the state’s water situation amid a rainfall deficit before taking a call on the ongoing water-sharing dispute. The offer came a day after the Cauvery Water Regulation Committee (CWRC) directed Karnataka to release 3,500 cusecs of water daily to Tamil Nadu for 15 days, despite the state claiming severe water scarcity. Karnataka has decided to challenge the order before the Cauvery Water Management Authority (CWMA).
The CWRC’s directive has triggered protests in Mandya, Mysuru and other Cauvery basin districts, where farmers and political leaders have opposed releasing water to Tamil Nadu. Karnataka has argued that cumulative inflows into the four reservoirs in the Cauvery basin are nearly 66% below the 30-year average, leaving the state struggling to meet drinking water requirements and irrigation needs.
Cauvery Water Regulation Committee (CWRC) on July 28 directed Karnataka to release 3,500 cusecs of water everyday Tamil Nadu from July 29 onwards for 15 days. The committee heard submissions from both riparian states and asked Karnataka to ensure 3,500 cusecs/day at Biligundlu for 15 days starting July 29, 8 am. Karnataka officials argued that the state was not in a position to release water to Tamil Nadu as the Cauvery basin is facing severe water shortage. They pointed out that there was virtually no inflow into reservoirs in June, and only a small quantity has been stored following minor rains in July.
Expressing concern over forecasts indicating no immediate revival of the Southwest Monsoon, Karnataka stressed that the existing storage should be reserved primarily for drinking water needs. Karnataka highlighted that the state itself is grappling with one of its worst water crises and it can’t release water to a lower riparian state when its reservoirs are yet to receive healthy inflows. Tamil Nadu, on the other hand, urged the CWRC to direct Karnataka to immediately release water as mandated by the Supreme Court and the Cauvery Water Disputes Tribunal to support its farmers.
EDIT: Evolve a distress-sharing formula This episode should not deter the two States from making a renewed bid to work out a distress-sharing formula, the last of which was attempted nearly 25 years ago. Mr. Vijay should also take a cue from his counterpart in handling the Cauvery issue, by bringing together other political players in the State.
URBAN RIVERS
Arabian Sea spit post heavy Mumbai rains More than 2,500 metric tonnes (MT) of garbage, that included thermocol, clothes and plastic waste, washed up on Mumbai’s beaches after a week of heavy monsoon rain and high tides, exposing the staggering volume of waste flowing through the city’s drains into the Arabian Sea. The clean up, undertaken by the Brihanmumbai Municipal Corporation (BMC), has once again highlighted how indiscriminate dumping and inadequate waste management continue to pollute Mumbai’s coastline.
The scale of marine pollution has also been documented by The Ocean Cleanup, a Netherlands based non profit organisation, which estimates that nearly 5,000 MT of plastic waste enters the Arabian Sea every year through around 50 drains across Mumbai, affecting 220 km of coastline, 152 sq km of mangroves and 107 protected species.
To reduce the flow of floating waste into rivers and the sea, the BMC has installed trash booms, floating barriers fitted with submerged nets, at 21 stormwater drain outfalls, including along the Dahisar, Poisar and Mithi rivers. Officials said the civic body plans to expand the network to all 82 stormwater drain outfalls over the next five years.
Environmental experts, however, cautioned that intercepting waste downstream cannot substitute for fixing the source of the problem. “Most floating waste entering water bodies originates in areas where solid waste management remains inadequate. Unless waste collection improves and dumping into drains is prevented, marine litter will continue to accumulate despite these interventions,” said Rahul Ahir, professor of wastewater engineering and former adviser to the Maharashtra government.
RIVERS
Adaptation as Water Security in the Kosi Floodplains in Bihar In this Guest Article, Rahul Yaduka, Post Doctoral Researcher at SOAS, London University, writes about the river bed and floodplain cultivation in Bihar’s Kosi River Basin, by migrant farmers coming from far away Baghpat in Western UP, mainly doing Rabi Crop (Dec-April) of Water Melon, Cucumber, Muskmelon, Bottle guard, etc. This is based on his ethnographic research and he sees this from the angle of water security, livelihood security and related aspects.
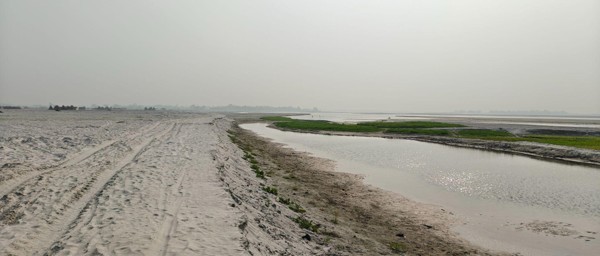
Yamuna’s shrinking in the national capital A study by researchers from the University of Delhi and IISER Bhopal has found that the Yamuna’s stretch through Delhi has shrunk by 68% over the past two centuries, while nearly one-third of its floodplains have disappeared due to urban expansion and encroachment. Experts (including Bhim Singh Rawat SANDRP) warn that the loss of floodplains threatens groundwater recharge, biodiversity and the river’s ecological health, while calling for stronger legal protection.
Yamuna floodplains act as Delhi’s natural filter for drinking water, finds study The study explains that Delhi’s alluvial floodplains, formed over thousands of years by the shifting Yamuna, create a freshwater aquifer that naturally filters and improves river water before it enters the city’s water supply. Researchers emphasised that while this riverbank filtration is an inexpensive and sustainable natural pre-treatment system, it cannot substitute for proper sewage treatment. They warned that encroachment and degradation of the Yamuna floodplains could damage this vital ecosystem service, stressing that protecting the floodplains and improving wastewater treatment are both essential for Delhi’s long-term water security.
Only 3 of 132 illegal bleach units paid pollution penalty in Panipat since 2016 A list of bleach houses and bleaching units in Panipat — against which the state pollution board took closure action between 2016 and 2025 — has highlighted the gap between enforcement and recovery of damages. During these nine years, Haryana State Pollution Control Board (HSPCB) ordered the closure of 132 bleach houses and bleaching units, but environmental compensation (EC) has been recovered in only three cases so far, according to an RTI reply.
In its reply, HSPCB said EC has been recommended in all these 32 cases but has not been finalised due to observations received from the higher authority. The board also said that prosecution against these units is under process. While HSPCB’s records indicate continued enforcement against bleaching units, the RTIs show that the process of finalising and recovering compensation remains incomplete in a large number of cases, with the board attributing the delay in the 32 NGT-linked cases to pending observations from the higher authority.
Haryana unveils ambitious Yamuna revival plan with 18 new STPs Reviewing the Yamuna Action Plan roadmap on July 30, Chief Secretary Anurag Rastogi directed all departments to expedite projects for sewage treatment, industrial pollution control, solid waste management and restoration of water bodies in the Yamuna basin. The state is upgrading six existing STPs (284 MLD) and developing 18 new STPs with a combined capacity of 621 MLD at an estimated cost of ₹932.18 crore across Gurugram, Faridabad, Sonipat, Panipat and Bahadurgarh.
To improve industrial effluent management, 12 new CETPs with a total capacity of 187.25 MLD have been proposed to serve 6,417 industries in the Yamuna catchment. The plan also includes Integrated Solid Waste Management clusters across all 33 urban local bodies, establishment of six biogas plants for dairy waste processing, and rejuvenation of 61 ponds and water bodies, of which 11 have already been restored. Officials also noted that Haryana currently operates 86 STPs, 17 CETPs, along with biomedical, hazardous and e-waste treatment facilities.
SAND MINING
Kanyakumari villagers oppose beach sand mining expansion Residents of Kanyakumari’s coastal villages are opposing the proposed expansion of beach sand mining by Indian Rare Earths Ltd. (IREL), fearing it will accelerate coastal erosion, seawater intrusion, groundwater contamination and loss of livelihoods. They say decades of mining at nearby Manavalakurichi have already resulted in severe shoreline retreat, destruction of sand dunes, damage to the AVM Canal, displacement of families and loss of agricultural land.
The Tamil Nadu government has extended land reservation for the ₹31.25-crore mining project until June 2027, though it still requires environmental and CRZ clearances. While IREL and the Expert Appraisal Committee maintain that the project will not cause permanent environmental damage and includes site restoration measures, local communities, scientists and environmental groups argue that mining has worsened erosion and ecological degradation. Drawing lessons from Kerala’s Alappad and Thottappally, where decades of mineral sand mining have been linked to extensive coastal loss and displacement, residents are preparing fresh protests against the project.
WETLANDS, LAKES, WATER BODIES
Don’t touch water bodies under garb of beautification: SC Taking a stern view of allegations that the Bihar govt is filling parts of three historic ponds in Darbhanga to create public amenities such as recreation spaces and stalls, Supreme Court on July 28 warned the state govt “not to touch the water bodies under the garb of beautification” without its approval.
A bench of Justices Vikram Nath and Sandeep Mehta directed the state to immediately stall ongoing work related to ‘Beautification and Rejuvenation of Gangasagar, Digghi and Harahi Lake’ project. Although the state refuted allegations of encroachment and urged Supreme Court to allow the work to continue, describing it as an ambitious project worth more than Rs 100 crore, the bench refused to budge and ordered that no further work be carried out.
“You can’t fill up water bodies under the garb of beautification. Do not touch the water ponds, keep your hands off and tell your officers not to touch the ponds,” it told advocate Manish Kumar, who was appearing for the state.
Supreme Court was hearing a plea filed by retired academicians, environmentalists and concerned citizens, seeking urgent intervention to halt filling of three historic ponds in Darbhanga – all 800-900 years old and integral to the city’s identity.
Since the state is acting in contravention of these orders and no remedy remains, petitioner is constrained to approach the court seeking urgent direction to stop further filling of ponds, remove encroachments in and around the three Darbhanga ponds, and restore them to their original position as depicted in maps of 1868 & 1960,” the petition stated.
After a brief hearing, Supreme Court directed the govt to stop the work and ensure that the area of the ponds remain intact and is not reduced by filling.
Centre revises J&K wetland inventory to 1793 The clarification came in a written reply to a question in the Lok Sabha by Union Minister for Jal Shakti C R Patil, amid concerns over shrinking and vanishing lakes across the country and references to an earlier Comptroller and Auditor General (CAG) report which had stated that 518 out of 697 lakes in J&K had either disappeared or reduced in size.
Responding to the concerns, the Ministry said the CAG observations were derived from an inventory prepared by the Department of Environment and Remote Sensing, Jammu and Kashmir, using LISS-III satellite imagery with an approximate spatial resolution of 23 metres. Such datasets, it said, provide only preliminary technical information for researchers and administrators and cannot, by themselves, establish permanent disappearance, shrinkage, encroachment or unlawful conversion of wetlands.
SHRC orders strict enforcement of rules for protection of mangroves, wetlands in Kannur The State Human Rights Commission (SHRC) has ordered the strict enforcement of existing rules and government guidelines for the protection and restoration of mangrove forests and wetlands in Kannur. The Commission also instructed officials to ensure effective monitoring and periodic review of conservation measures. In its directive to the District Collector, the Commission said the district administration has a constitutional obligation to safeguard citizens’ right to live in a healthy and clean environment.
Wetland plots allotted to Vallarpadam project evictees to be made habitable After a long wait, those displaced by the Vallarpadam International Container Transshipment Terminal (ICTT) project experienced some respite when, on July 31, a meeting chaired by the district collector decided to make the marshy plots of land allocated to them habitable by depositing soil. It had been a longstanding demand of the dislodged families, who had been raising their voices against the injustice of being allotted marshy land as compensation. A committee headed by executive engineer of the Public Works Department (PWD) will be responsible for implementing the action plan. Members of the committee will include executive engineer of Cochin Port Trust (CPT), chief engineer of Kochi Metro Rail Ltd (KMRL), tehsildar, police, and representatives of protesters.
Monsoon-driven waves induce a prevailing recession in mangrove forests across the Ganges-Brahmaputra-Meghna Delta A new study has found that monsoon-driven waves are the main cause of mangrove erosion in the Ganges-Brahmaputra-Meghna Delta (GBMD), the world’s largest mangrove ecosystem. Between 1988 and 2022, the delta recorded a small overall increase in mangrove area, but its shoreline continued to retreat as waves eroded the coastal edge. The researchers found that sea-level rise and tropical cyclones further intensified this wave-driven erosion.
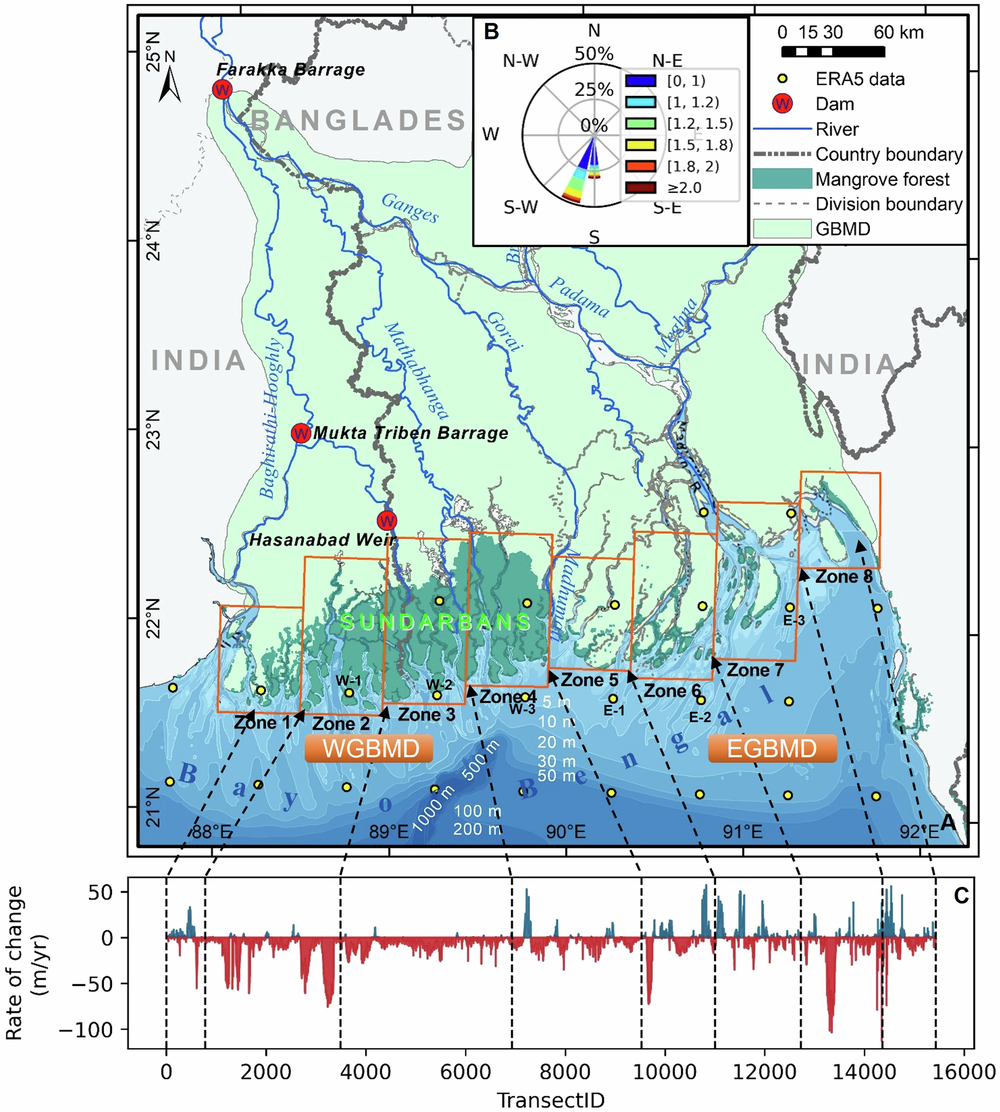
At the same time, tidal currents helped offset some of these losses by transporting and depositing sediments in channels, backshore areas and around sandbanks, creating new sites for mangrove growth. The study highlights that while mangroves are naturally regenerating in some areas, monsoon wave action remains the dominant force driving mangrove loss in the delta, with climate change further increasing the risk.
RAMSAR WETLANDS
NGT orders Bhoj Wetland encroachments removed by August 31 The NGT on July 29 has issued stringent directions to protect the ecologically sensitive Bhoj Wetland and remove encroachments within the 50-metre Full Tank Level (FTL) zone, reaffirming that environmental conservation must take precedence over unauthorised development.
Hearing four connected petitions related to Bhoj Wetland, Kaliyasot Dam, Kerwa Dam and the Bhopal Lake system, the Tribunal directed the district administration to intensify action against illegal constructions and ensure strict compliance with wetland conservation norms.
The Tribunal was also urged to ensure scientific demarcation of the boundaries of Bhoj Lake, Kaliyasot Dam and Kerwa Dam, regulate the use of chemical fertilisers and pesticides in surrounding agricultural areas to prevent water pollution, and protect the proposed 150-hectare botanical garden.
Taking a stern view, the NGT fixed personal accountability on the concerned SDMs, tehsildars and district administration, directing them to prepare a comprehensive inventory of all illegal constructions and encroachments violating the FTL zone, Wetland Rules, Bhoj Wetland regulations and the city’s Master Plan. The authorities have been asked to initiate action against every identified violation and submit a detailed compliance report supported by affidavits.
The Tribunal also directed Bhopal Collector Priyank Mishra to include a police officer nominated by the Police Commissioner in the enforcement committee to ensure adequate police support during demolition drives and prevent obstruction to official action. All concerned departments have been directed to submit a detailed compliance report within three weeks. The matter has been listed for further hearing on August 31.
According to the administration’s survey, a total of 117 encroachments were identified within the 50- metre FTL zone, comprising 68 encroachments on govt land and 49 encroachments on private land. It was further submitted that 45 encroachments have already been removed, consisting of 23 encroachments on govt land and 22 on private land and 72 encroachments are yet to be removed, comprising 45 encroachments on govt land and 27 on private land.
Environmental activist Subhash C Pandey, appearing in person in one of the two petitions before NGT, said that the previous order has not been strictly complied with. He raised the issue of identification and demarcation of Kaliasot dam and Kerwa dam and the Upper lake. He also raised the issue of prevention of use of chemicals in farming surrounding the wetland area causing chemical contamination into the water adversely affecting the aquatic life and further causing an adverse effect on the human as the water is being supplied to the citizens of Bhopal. Hartshwardhan Tiwari, counsel for another petitioner Rashid Noor Khan submitted that encroachments around the Upper Lake have only increased in spite of the actions taken by the district administration and BMC.
WATER OPTIONS
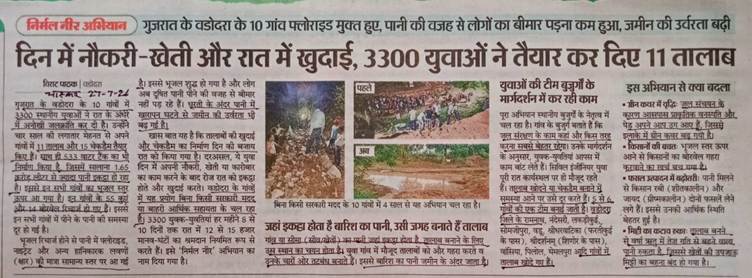
Tanks deepening in 11 Vadodara villages through voluntary effort brings GW up Daily night time work by some 3300 volunteers over the last 4 years have led to deepening of tanks in 11 villages in Vadodara district in Gujarat, bringing groundwater up, resolving excess fluoride issue in groundwater, improved crop yields and greenery, according to this Bhaskar News dated July 27 2026.
GROUNDWATER
GW extraction rises 3.4 pc in Gujarat as 25 talukas become overexploited Gujarat’s groundwater is coming under increasing stress, with extraction rising 3.4% in a year while natural recharge has remained almost unchanged, according to the latest “Dynamic Ground Water Resources of India, 2025” report by the Ministry of Jal Shakti. The state’s groundwater extraction stage increased from 54.21% in 2024 to 55.95% in 2025, while 25 assessment units have been classified as Over Exploited and 14 deteriorated into worse categories within a year.
The report shows that Gujarat extracted 14.33 billion cubic metres (bcm) of groundwater in 2025 against an annual extractable resource of 25.61 bcm. In comparison, extraction stood at 13.86 bcm in 2024, marking a year on year increase of 3.4%. However, annual recharge remained almost unchanged at 27.58 bcm, highlighting a widening gap between demand and replenishment.
Agriculture continues to dominate groundwater use in Gujarat. Of the state’s 14.33 bcm of groundwater extracted in 2025, 13.25 bcm was used for irrigation, accounting for 92.5% of the total. Domestic use stood at 0.88 bcm, while industrial extraction was only 0.20 bcm, according to the Central Ground Water Board’s (CGWB) 2025 assessment. The figures underline the state’s heavy dependence on groundwater for farming, leaving extraction patterns closely tied to rainfall conditions and irrigation demand.
While the state-level figures suggest moderate stress, the situation at the local level is far more severe. Of the 252 assessment units, only 181 are classified as Safe. The remaining units show varying levels of stress, with 31 classified as Semi Critical, three as Critical and 25 as Over Exploited. An additional 12 units are saline, leaving nearly one fourth of Gujarat’s groundwater systems under stress or degradation.
North Gujarat remains the worst affected region. Banaskantha has crossed the sustainability threshold with an extraction stage of 121.47%, meaning groundwater use exceeds natural recharge. Eight of its 14 assessment units are Over Exploited, including Dantiwada, Deesa, Palanpur and Tharad. Patan and Mahesana also continue to face severe stress, with extraction stages of 118.57% and 108.74%, respectively, and multiple Over Exploited and Critical units.
Urban groundwater stress is also evident in Gujarat’s major urban centres, with Gandhinagar emerging as a particularly severe hotspot. The CGWB’s 2025 assessment places Gandhinagar’s stage of groundwater extraction at 111.28%, meaning annual extraction exceeded its annual extractable groundwater resource by 11.28%. Ahmedabad recorded a district wide extraction stage of 72.74% in 2025, while the Ahmedabad Urban assessment unit was classified as Critical at 93.76% in the latest assessment unit data available from CGWB 2023.
URBAN WATER
Residents allege GW contamination near Vendipalayam dump yard in Erode Residents of Vendipalayam and nearby localities in Ward 60 have alleged that groundwater has turned yellow due to leachate from the Erode Corporation’s municipal solid waste dump yard and urged the civic body to take necessary action. Residents said the dump yard has been functioning for more than six decades amid residential neighbourhoods despite repeated demands for its relocation. They alleged that despite waste segregation being carried out at the site, large quantities of unsegregated waste continued to accumulate, resulting in foul odour and environmental pollution.
MONSOON 2026
Climate change rewrites the monsoon script Even as India grapples with an unpredictable monsoon, Bengal has emerged as an anomaly, recording near-normal rainfall despite a 30% deficit across eastern and northeastern India, a Climate Trends briefing has found. Between July 1 and 26, India received 238.2 mm against the normal 233.9 mm, while repeated heavy rain reduced the nationwide deficit from 40% at June-end to 16% by July 29. According to IMD data till July 30, Bengal received 703.5 mm against the normal 691.5 mm, a 2% surplus.
Regional contrasts, however, remain stark. Alipurduar, Cooch Behar, Darjeeling, Jalpaiguri, Kalimpong and Malda recorded normal rainfall, while North Dinajpur had a 27% deficit. In Gangetic Bengal, East Midnapore recorded 42% excess rainfall, West Midnapore 45% and North 24 Parganas 28%. Kolkata received 695.8 mm against the normal 658.3 mm, a 6% surplus. Birbhum (-33%), Murshidabad (-32%), Purulia (-33%) and Nadia (-22%) remained deficient.
Scientists said repeated low-pressure systems travelling through Myanmar into the North Bay of Bengal helped Bengal escape the wider regional deficit. Experts, however, warn that near-normal totals mask increasingly uneven rainfall—short, intense bursts separated by dry spells—raising risks of urban and river flooding, Himalayan landslides and crop stress. The Climate Trends briefing said rainfall totals alone can no longer define monsoon health as climate change reshapes when, where and how intensely rain falls.
FLOOD 2026
Assam’s Flood Crisis Rooted in Policy Failures, Not Just Nature Manoranjan Pegu argues that the growing severity of Assam’s annual floods is driven not only by natural factors but also by decades of flawed flood management and political-economic choices. He notes that the 2026 floods have claimed at least 75 lives, displaced around 7 lakh people and submerged over 900 villages. The article criticises the state’s continued dependence on embankments despite repeated breaches, mounting evidence of their limitations and the government’s own admission that no long-term flood mitigation strategy has been implemented.
It highlights how embankment construction has created a contractor-driven economy, with thousands of crores spent on repairs while flood losses continue to rise. The author also argues that relief measures address only the immediate impacts without tackling underlying structural issues such as erosion, wetland encroachment, unsustainable infrastructure development and poor rehabilitation. He calls for a shift towards community-centred, science-based flood governance focused on prevention, preparedness and adaptation rather than recurring embankment construction and relief distribution.
Great Flood of 1903 changed Kashmir’s river management History suggests those fears are deeply rooted. According to historians and scientific records, Kashmir has witnessed dozens of major floods over the last millennium. The earliest documented flood dates back to 879 AD, when a massive landslide near Baramulla blocked the Jhelum, inundating vast parts of the Valley. Since the beginning of the twentieth century alone, Kashmir has experienced at least 25 to 30 significant floods, including those in 1903, 1905, 1909, 1928, 1948, 1950, 1957, 1959, 1992, 1996, 2006 and 2014.
Among them, the Great Flood of 1903 stands as a defining moment in Kashmir’s modern history. Triggered by nearly three days of relentless rain, the Jhelum burst its banks and transformed Srinagar into what British travellers described as “a vast lake”. The disaster prompted Maharaja Pratap Singh’s administration to construct the Flood Spill Channel, a visionary engineering project designed to divert excess flood water away from the city. For more than a century, the Flood Spill Channel stood as a reminder that every flood had to be answered with preparedness rather than complacency.
DAM FLOOD 2026
Not opening Vasna barrage on Sabarmati worsened Ahmedabad flooding Heavy rain on July 22-23 once again left key thoroughfares in Ahmedabad’s west severely waterlogged. As people living, having businesses in or commuting through spots like Anandnagar Road, Manekbaug Road, the 132-Feet Ring Road and Judge‘s Bungalow Road were majorly inconvenienced, the fault, sources said, lies with AMC and the state irrigation department.
Authorities failed to open the Vasna Barrage gates in time to lower the water level in the Sabarmati River, which worsened the flooding in these areas. Water entered homes and shops, commuters faced vehicle breakdowns, and many were left stranded.
Rain intensified on July 23 morning, battering the city and throwing life out of gear. Several waterlogged spots remained submerged until 5 pm.
By 10 am, the water level at Vasna Barrage was 134 feet with only three gates open. By 11am level rose to 135.7 feet. It was not until 12.20pm that 15 gates were opened, which brought the level down to 129.5 feet, and eventually to 124.5 feet by 3pm, allowing flooded roads to clear. If the water level at Vasna Barrage exceeds 128 feet, rainwater from adjoining western areas cannot discharge into the river, causing storm drains to back up. Heavy rainfall demands an immediate reduction of the barrage level. The main stormwater trunk and drainage lines run parallel to major thoroughfares like Ashram Road, 132-Feet Ring Road and SG Highway. When the barrage level remains above 134 feet, outlets near the river become submerged, preventing Ashram Road’s drainage lines from emptying into the Sabarmati. This cascade effect causes water to back up all the way to the 132-Feet Ring Road.
Lowering the level at the barrage to 127 feet allows storm drains to discharge smoothly, they added. A similar crisis occurred during the July 2023 monsoon season. Following severe flooding in western areas that month, Ellisbridge MLA Amit Shah wrote to the then municipal commissioner, emphasising that keeping the water level at the barrage at 128 feet prevents waterlogging in key areas like Ellisbridge and Paldi.
Until 2011, the riverbed was emptied and cleaned annually. No desilting or deepening were executed over the past five years. This has reduced the river’s channel water storage capacity. When upstream rain brings water into the Sabarmati during monsoons, the water carries sand and debris, further shallowing the riverbed.
Did Sabarmati River Front make Ahmedabad more vulnerable to floods? In this excellent article, Rajiv Shah raises a number of pertinent questions about the damaging, persistent floods that parts of Ahmedabad faced on July 23-26, 2026.
10 districts on alert as Hirakud Dam keeps 22 gates open Ten Odisha districts in the downstream of the Mahanadi have been put on high alert as the Hirakud Dam kept discharging water into the river through 22 gates on Aug. 01, inundating low-lying areas.
The water level in the Hirakud Dam was 625.47 feet against its full capacity of 630 feet. “Since the inflow to the dam is about 4.15 lakh cusec, the reservoir level will certainly rise in a few hours. The average outflow was 3,89,603 cusecs,” the official said.
Revenue and Disaster Management Minister Pujari hoped for an improvement in the flood situation, noting that there has been no rain for the past two days and water discharge from the dam appears to have stabilised. Officials said the water level at the Mundali barrage near Cuttack has also come down to about 7 lakh cusec from 8.88 lakh cusec on July 30 night.
The deluge has hit more than 8.34 lakh people in 20 districts of the coastal state, damaging civic infrastructure and hectares of cropped land. This apart, floods caused by overflowing Salangi, Brahmani, Baitarani, Jalaka and Budhabalang rivers damaged over 1,300 houses in north Odisha, officials said. Bhadrak was the worst-affected district, followed by Jajpur, Balasore and Mayurbhanj.
The excess water discharged from Hirakud Dam has reached Mundali near Cuttack on Aug. 02, further swelling the Mahanadi river, but there was no major flood threat in the delta regions even though 10 coastal districts are on high alert, officials said. The water level at Mundali has increased to 5.73 lakh cusec at 9 am on Aug. 02 against 4.74 lakh cusec on Aug. 01.
Mahanadi floodwaters reach Maa Bhattarika temple for second time this year As per July 27 report, the swelling waters of the Mahanadi River have reached the boundary of the revered Maa Bhattarika Temple at Baramba in Cuttack district for the second time this year, raising concerns among devotees and temple authorities. The flood situation has intensified following the release of water from the Hirakud Dam, coupled with continuous rainfall over the past two days. As the river level rose, floodwaters touched the temple premises, although they have not yet entered the sanctum or disrupted daily worship.
No dam or reservoir exists in Mon dist: Konyak Union The Konyak Union (KU) has rejected claims that recent floods in parts of Assam were caused by the release of water from a dam in Nagaland’s Mon district or by illegal coal mining in the Naginimora area. The Union clarified that no hydroelectric dam exists in Mon district, and that the proposed Dikhu Hydroelectric Project has never been constructed or commissioned. It also stated that there is no evidence linking the floods to coal mining activities in Naginimora.
According to the KU, the floods were triggered by exceptionally heavy rainfall and cloudburst-like events on July 19–20, 2026, which caused landslides, flash floods and overflowing rivers across Mon district before floodwaters reached Naginimora and adjoining areas of Assam. The disaster claimed 11 lives, displaced more than 650 families, and caused extensive damage to homes, schools, shops, agricultural fields, tea gardens, businesses, livestock, roads, electricity and communication networks, making it one of the worst natural disasters in the district’s recent history.
HFL BREACH
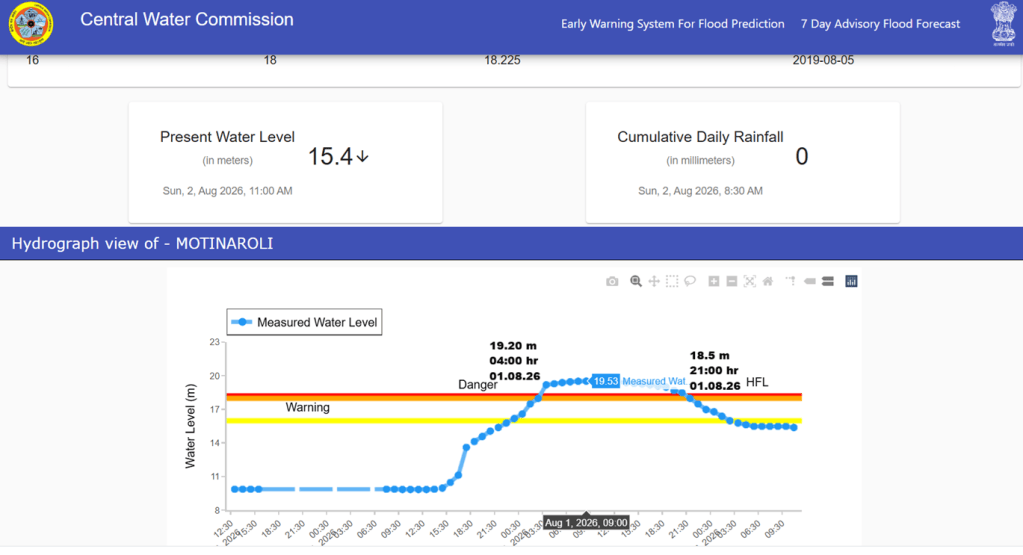
River Kim in Narmada basin at Motinaroli site in Surat district has crossed its HFL 18.225 meter dated 05.08.2019 at 04:00 hour on 01.08.2026. Present flood level 19.5 meter at 11:00 hour with falling trend.
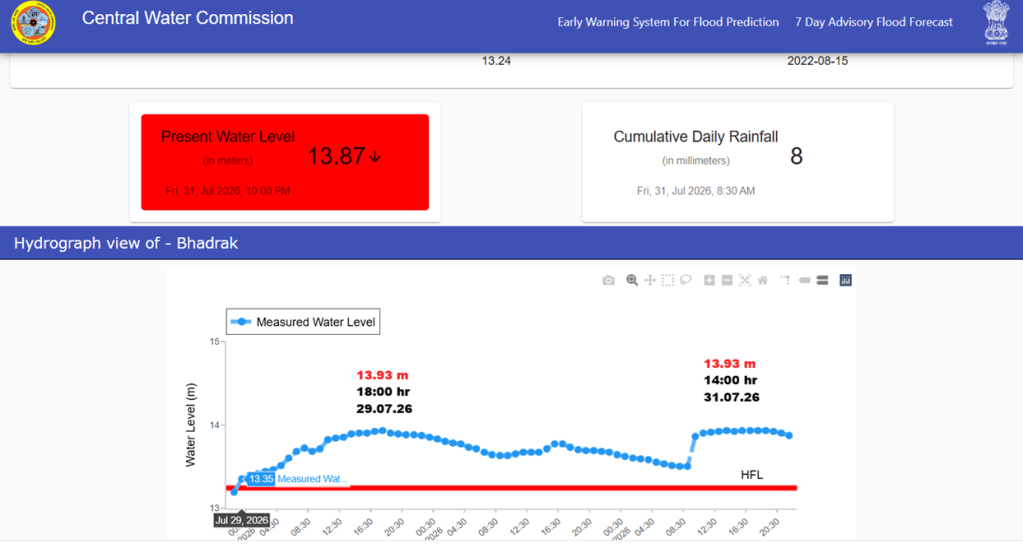
River Baitarani at Bhadrak site in Odisha has crossed it HFL 13.24 meter dated 15.08.2022 at 24:00 hour on 28.07.2026. Present flood level is 13.68 meter at 07:00 hour on 29.07.2026 with rising trend. River Baitarani remained above its previous Highest Flood Level (HFL) of 13.24 metre dated 15.08.2022, for nearly 58 hours. This is possibly the longest duration that any river has remained in the extreme flood situation during the current monsoon season.
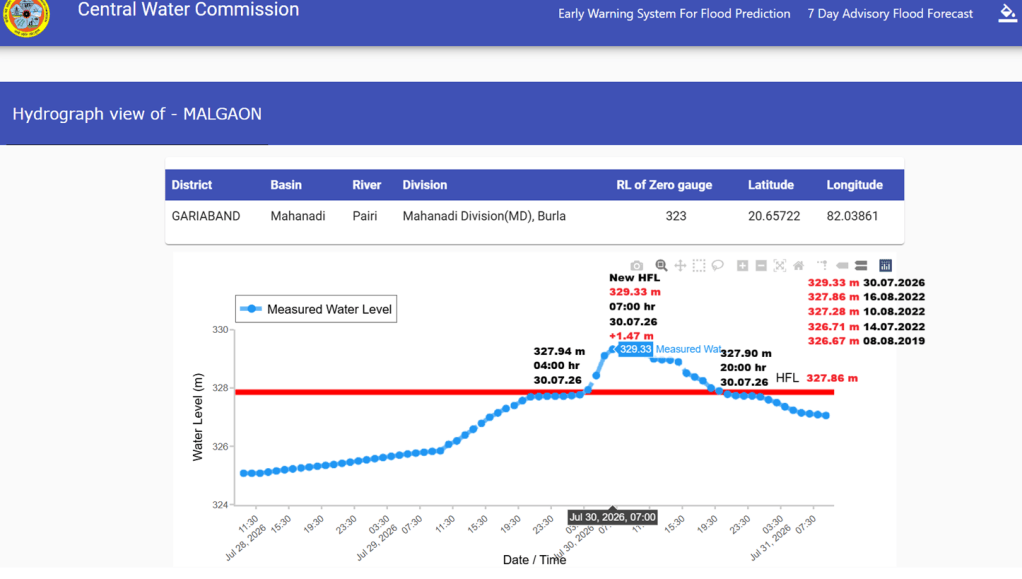
River Pairi in Mahanadi basin at Malgaon site in Gariaband district, Chhattisgarh has set new HFL 329.33 meter on 30.07.2026 after breaching old HFL 327.86 meter dated 16.08.2022. The new HFL is 1.47 meter higher than the old HFL. Before 2022, the HFL for the site was 326.67 meter dated 08.08.2019.
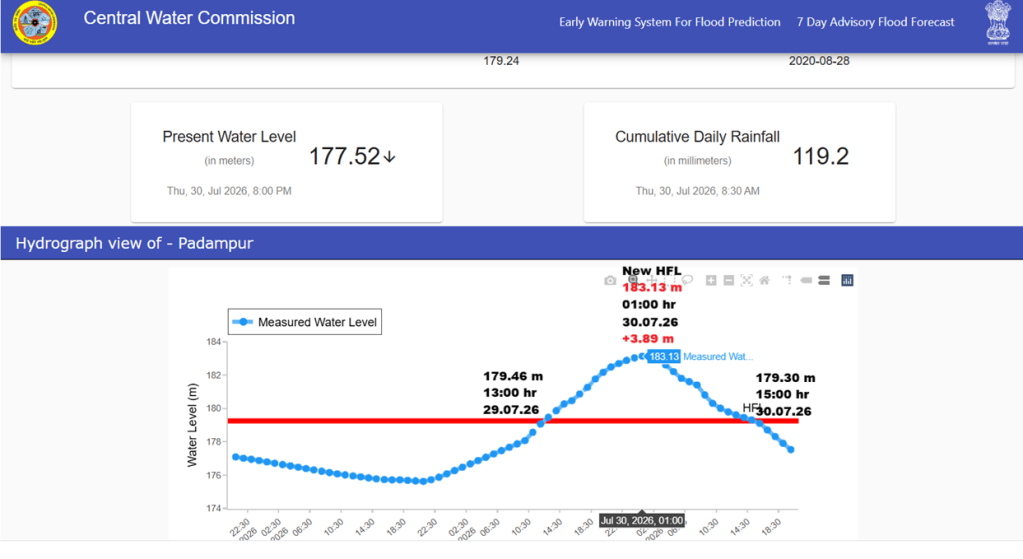
River Ong in Mahanadi basin at Padampur site in Bargarh district, Odisha has crossed its HFL 179.24 meter dated 28.08.2020 at 13:00 hour on 29.07.2026. Present flood level is 180.48 meter at 16:00 hour with rising trend.
Afer 17 years River Ararai in Brahmani & Baitarni basin at Keonjhar site in Kendujhar district Odisha has crossed its HFL 462 meter dated 21.07.2009 at 12:00 hour on 28.07.2026. The river has set new HFL 463.81 meter at 16:00 hour which is 1.81 meter higher than the old HFL. Present flood level is 462.26 meter at 19:00 hour on 28.07.2026 with falling trend.
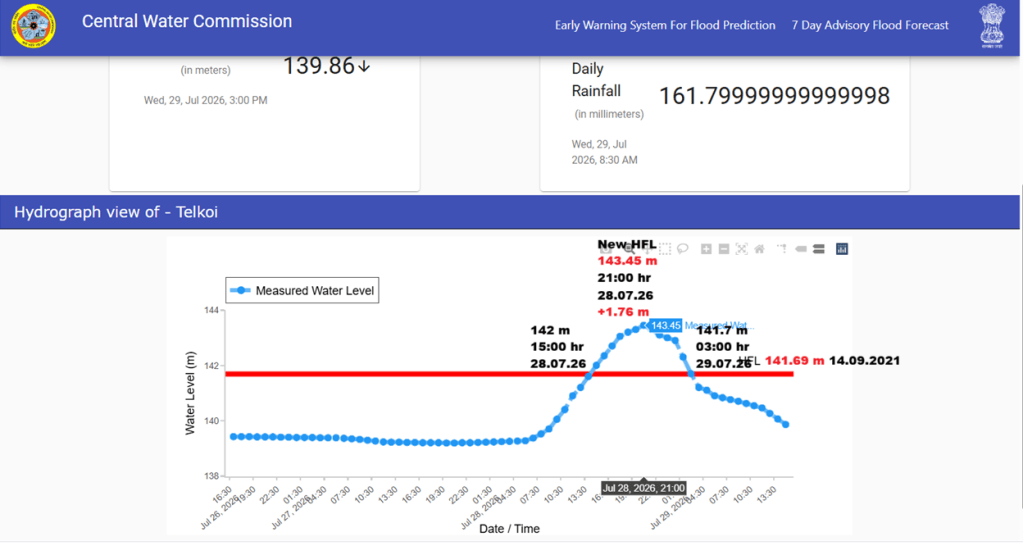
Brahmani river at Telkoi site in Kendujhar district Odisha has crossed it old HFL 141.69 meter dated 14.09.2021 at 15:00 hour on 28.07.2026.
URBAN FLOODS
Srinagar smart city needs a smarter drainage strategy In urban flood management, there are no shortcuts. Every culvert, every drain, every road level, and every outfall functions as part of a connected hydraulic system. Unless this system is understood scientifically through rigorous modelling and evidence-based planning, individual interventions are unlikely to produce lasting resilience. Dr. Yasir Altaf
CLOUD BURSTS
Flash Flood in Ganderbal, Houses, Orchards Inundated A cloudburst triggered a flash flood in the Safapora area of central Kashmir’s Ganderbal district on Aug. 02, inundating houses, shops, orchards and roads, causing widespread disruption. The sudden surge of water entered several residential houses and commercial establishments, damaging household belongings and affecting normal life in the area, reports said. Several orchards were also submerged, with growers fearing significant losses to their crops. The flash flood left several roads and interior lanes waterlogged, disrupting vehicular movement and making it difficult for residents to move around.
A cloudburst struck the Heerpora and surrounding Pehlipora areas of the Shopian district on August 2, 2026, triggering sudden flash floods. The intense downpour caused water and mud to rush into residential houses and cow sheds, creating panic among local residents
Cloudburst hits Pehlipora, Shopian The State Disaster Response Force (SDRF) Shopian launched a swift rescue and evacuation operation on Aug. 01 following a cloudburst in Pehlipora area of the district. Officials said that the cloudburst, triggered by intense rainfall, caused a heavy flow of water and mud that inundated five residential houses and one school building in the locality. Authorities confirmed that no loss of life has been reported in the incident so far. Damage assessment and relief measures are underway, while officials continue to monitor the situation in vulnerable areas amid ongoing rainfall.
Cloudburst leaves trail of damage in Minamarg A cloudburst struck the Minamarg area of Drass on Aug. 01, triggering flash floods and landslides that damaged temporary shelters of nomadic Bakerwal families and led to the suspension of traffic on the Srinagar-Leh National Highway. Officials said four temporary shelters (deras) belonging to Bakerwal families, housing around 20 people and located opposite Police Post Minamarg, were affected by the flash floods.
Police personnel from Police Post Minamarg launched an immediate rescue operation and safely evacuated all the affected families to the Police Post Minamarg building and the nearby Sheep Husbandry Department building. A Wagon R car was also swept away by the flash flood. However, all its occupants escaped unhurt, and no casualties were reported. The cloudburst also triggered landslides, forcing authorities to temporarily suspend traffic on the Drass-Srinagar National Highway at the affected location.
Cloudburst Hits Kishtwar and Shopian Cloudburst incidents were reported in Kishtwar and Shopian districts. In Kishtwar, a cloudburst struck the Chatru area at around 2:30 a.m. on July 31 night, triggering a powerful flash flood. The force of the water swept away vehicles and damaged private property. The full extent of the damage is still being assessed by the authorities.
The SDM, Kokernag, on July 02, ordered the immediate closure of the Sinthan–Kishtwar Road for all vehicular traffic. The decision was taken after recent flash floods and cloudburst incidents severely damaged the road at multiple locations, making it unsafe for travel.
Two Cloudbursts Reported in Kishtwar As per June 01 report, two cloudburst incidents were reported in Kishtwar district – one in the Gahan area of Sarthal and another in Machhipal. According to initial reports, there have been no casualties, injuries, or property damage at either location. The administration confirmed that no loss of life or property has been reported so far. Deputy Commissioner Pankaj Kumar Sharma said that a cloudburst on the hillside between Drabshalla and Gujjuwa triggered flash floods, affecting 34 roads, including those connecting Drabshalla Zero Point, Suru–Sarthal, Gahan, and Machhipal. Restoration work has already begun, and the main highway to Drabshalla has been cleared for traffic.
2025 Heavy Rains and Cloudburst Devastation Heavy rainfall during 2025 caused widespread devastation across Jammu & Kashmir, claiming 152 lives and injuring 179 people. Around 21,000 structures, mostly residential houses, were damaged, while 1,515 livestock perished. According to data compiled by the Department of Disaster Management, Relief, Rehabilitation and Reconstruction, 151 of the deaths occurred in the Jammu division and one in the Kashmir Valley.
Nearly 100 of the victims were pilgrims who died in cloudburst- and landslide-related disasters during the Machel Mata Yatra in Kishtwar district and along the Vaishno Devi pilgrimage route in Reasi district in August. One of the worst incidents occurred on August 14, 2025, when a devastating cloudburst struck Chishoti village in Kishtwar district, killing 63 people, injuring several others, and leaving 30 people missing.
Flash Flood Damages Homes and Vehicles in Chamba Following torrential rainfall, flash floods in three mountain streams caused widespread destruction in Chamba and nearby areas, including Tadoli, Sultanpur, Obri, Bhariyath, and Gholti on July 27 night. The floods damaged 64 houses, eight shops, and a warehouse, while water and debris inundated homes and commercial establishments, forcing several families to evacuate overnight to safer locations. The flood also buried 16 cars, five motorcycles, and one scooter under debris. At several locations, mud and debris entered house courtyards and rooms, causing extensive damage to property.
Cloudburst Washes Away Bridge A cloudburst struck the Dhandhal Nallah area in the Mayar Valley of Lahaul-Spiti district, Himachal Pradesh, on July 25 night, triggering a sudden flash flood in the mountain stream. The flood washed away a bridge and a road, completely cutting off road connectivity to seven villages in the Mayar Valley.
Cloudburst Damages Apple Orchards A cloudburst on July 30 in the Burua area near Manali washed away more than 100 apple trees and buried several orchards under debris.
Heavy rainfall triggered a cloudburst in Chamoli district, Uttarakhand, on June 26, sending large volumes of debris into several houses and shops. The incident also stranded multiple vehicles in the affected area, while authorities assessed the extent of the damage.
DISASTERS
Below-normal monsoon no guarantee against disasters in Himalayas: ICIMOD The warning, issued by the International Centre for Integrated Mountain Development (ICIMOD), comes as deadly floods and cloudburst-triggered disasters continue to affect parts of India and Pakistan, including localised flooding in Arunachal Pradesh and Pakistan’s Gilgit-Baltistan region.
According to the HKH Monsoon Outlook 2026, active El Nino conditions are expected to suppress overall seasonal rainfall across much of South Asia. However, experts said seasonal averages can mask dangerous short-term and localised weather anomalies. “The biggest misunderstanding is that less seasonal rainfall means lower flood risk. Seasonal forecasts describe average conditions over several months, not what happens in a single valley. Under El Nino, long dry spells can be interrupted by intense local storms that trigger devastating flash floods and landslides,” said Saswata Sanyal, disaster risk reduction specialist at ICIMOD.
Scientists said this “dual reality” is likely to define the 2026 monsoon. Short-lived weather systems can temporarily override the broader El Nino pattern, triggering intense localised cloudbursts. This leaves communities facing a volatile mix of prolonged dry spells that threaten agriculture and sudden extreme rainfall events that endanger lives and infrastructure.
Scientists flag emerging Himalayan climate hazard Scientists returning from an expedition to the Satopanth glacier in Uttarakhand’s Garhwal Himalaya have warned that frequent rockfalls witnessed during their field survey point to an emerging mountain hazard that has received far less scientific attention than glacier retreat. They argued that rockfalls are becoming “an underappreciated signal of climate change in the Himalaya” and called for greater scientific research and policy attention to understand how climate change could be destabilising Himalayan slopes.
The observations were documented by Remya SN, assistant professor at Azim Premji University, and Sunil Singh Shah, scientist at the department of geology, HNB Garhwal University, in a commentary published in the journal ‘Nature’. During their expedition to the glacier in May, the researchers encountered frequent rockfalls from the steep slopes of Neelkanth peak. “We observed rocks crashing down every 30 seconds to one minute, sending dust clouds across the glacier and valley below,” the authors said.
Besides repeated rockfalls, the team documented retreating ice, an increasingly debris-covered Satopanth Glacier, uneven glacier thinning, expanding infrastructure around Badrinath and plastic waste near high-altitude glacial lakes.
The researchers stressed that while glacier retreat remains a key indicator of climate change, associated hazards such as rockfalls, slope instability and debris-covered glaciers require far greater monitoring. “Understanding these interconnected processes is critical to improving hazard assessments and protecting vulnerable Himalayan communities as the mountain environment continues to change,” the researchers said.
LANDSLIDES
Under-Construction Rudraprayag Tunnel Landslide A landslide brought down a large section of the hillside on the entrance of an under-construction 900-metre-long tunnel in Rudraprayag on July 28, triggering panic in the area. Also, an adjoining under-construction residential complex suffered major damage. The incident has raised serious questions regarding the safety and construction quality of this ambitious, multi-crore ‘dream tunnel’, a key project of the Char Dham Yatra.
This tunnel aims to connect Badrinath and Kedarnath highways in the future. Once completed, it is expected to provide huge relief from the severe traffic congestion that has plagued Rudraprayag town for years. The landslide has caused significant damage to a residential complex currently under construction outside the tunnel. Several parts of the complex were damaged by the debris.
Recurring Landslides Disrupt Yamunotri Highway With the onset of the monsoon, even light rainfall has begun triggering frequent landslides near Syana Chatti and Hanuman Chatti on the Yamunotri National Highway. Continuous rockfalls and debris from unstable hillsides have repeatedly disrupted traffic along the route. On July 04, the highway remained blocked for nearly eight hours near Syana Chatti, while on July 05, large boulders fell near Hanuman Chatti, closing the road for about two hours.
The closures resulted in long queues of vehicles on both sides, forcing pilgrims, tourists, and local residents to wait until the highway was reopened. Local residents attributed the recurring landslides to extensive hill cutting during the highway widening project, alleging that excessive excavation at several locations has destabilized the slopes and increased their vulnerability to rockfalls and landslides during the monsoon.
Landslide on Yamunotri Highway As per Aug. 01 report, a major landslide occurred on the Yamunotri National Highway near Syana Chatti in the Barkot area of Uttarakhand after a hillside suddenly collapsed. Large boulders and huge quantities of debris rushed downslope, reaching the residential area of Syana Chatti and triggering panic among residents and pilgrims. People rushed out of their homes and hotels to safer locations after hearing the loud noise of the landslide and seeing debris approaching. Fortunately, no casualties were reported, and several hotels and parked vehicles narrowly escaped being hit, preventing what could have been a major disaster.
Debris Flow Threatens Bailey Bridge at Syana Chatti Heavy flows of debris and large boulders surged through the Kupra Khad at Syana Chatti on the Yamunotri Highway on July 29, triggering panic among local residents. Continuous rainfall caused the stream to carry a large volume of mud, rocks, and debris downstream, posing a serious threat to the under-construction Bailey bridge at the site.
ENVIRONMENT GOVERNANCE
SC shuts one door on retrospective green clearances The Supreme Court on July 29 ruled the Centre cannot use administrative orders to grant environmental clearance to projects that broke ground without approval — but experts say a route that still allows such clearances in the future is still open. The verdict comes after years of legal argument over whether India’s environmental law can regularise past violations, and clarifies the terms on which governments may try in the future.
It also spares a slate of projects already cleared under the now-invalidated regime — a slate that includes hospitals, medical colleges, an airport and irrigation works. Environmentalists, including the petitioner NGO Vanashakti, have said that post-facto clearance is fundamentally at odds with efforts to protect the environment by avoiding destruction before it happens. It is why, they say, approving projects that require large-scale tree felling or flattening of natural landscapes should be done only after thorough assessment of their environmental impact.
The Supreme Court has quashed an Office Memorandum issued by the Ministry of Environment, Forest and Climate Change in 2021 on the ground that an administrative order cannot create a perpetual and parallel regime to grant retrospective authorisation to big-ticket infrastructure projects commenced without prior, valid environmental clearance.
SC Eases Industrial Approvals in Taj Trapezium Zone On July 23, 2026, the Supreme Court allowed the Taj Trapezium Zone (TTZ) Authority to process over 410 pending applications for the establishment, expansion or relocation of mostly small and medium industries. Applications can be approved without court permission only if the TTZ Authority, the Central Empowered Committee (CEC) and the NEERI unanimously classify them as non-polluting. All decisions must be made public on the CEC website for objections and remain subject to judicial review if required. The relaxation will continue until a cumulative impact assessment, vision document and final list of non-polluting industries are completed. The Court also referred two applications seeking permission to fell 5,812 trees for NH-21 improvements in Bharatpur and 188 trees for a road project in Uttar Pradesh within the TTZ to the CEC for expert examination.
SC seeks information on Environmental Relief Fund The Supreme Court (SC), July 21, 2026 directed the central government to file a comprehensive affidavit explaining the scheme, if any, for utilisation of the Environmental Relief Fund. The bench comprising Chief Justice Surya Kant, Justice Joymala Bagchi and Justice Vipul M Pancholi also directed the Member Secretary, Central Pollution Control Board (CPCB) as well as the Union of India to assist the court with details regarding the utilisation of the aforesaid amount as per the scheme.
The matter related to the utilisation of the Environmental Relief Fund which appears to have been levied and collected under the provisions of the Public Liability Insurance Act, 1991. The SC was informed by the Union of India that the total amount collected up to 2021 was around Rs 1,000.69 crore. He, however, is not aware of the latest figure.
Though a scheme known as The Environmental Relief Fund Scheme, 2008 was formulated, it appears that no amount thereunder has been reimbursed or released. The fund is stated to be entrusted to the Central Pollution Control Board. Nothing on record suggests how much of that amount has been disbursed or utilised for the fund’s intended purpose, the SC noted.
WORLD DAMS
USA: Imminent Collapse of Western States Water Resources and Infrastructure? Lake Powell is a reservoir created in 1968 to store water primarily for agriculture. It now sits at 25% of capacity and ‘scientists’ are debating calling it a day and draining the entire reservoir. While agriculture was the main driver, it was a necessary evil to support ‘eating’. By contrast, data centers are gobbling waterways dry in a matter of a couple years. What happens to the 4,000+ data centers when America goes dry? What happens to America’s food and drinking water supply?
SANDRP
Also see: DRP 27 July 2026 & DRP 20 July 2026
Follow us on: www.facebook.com/sandrp.in; https://twitter.com/Indian_Rivers


