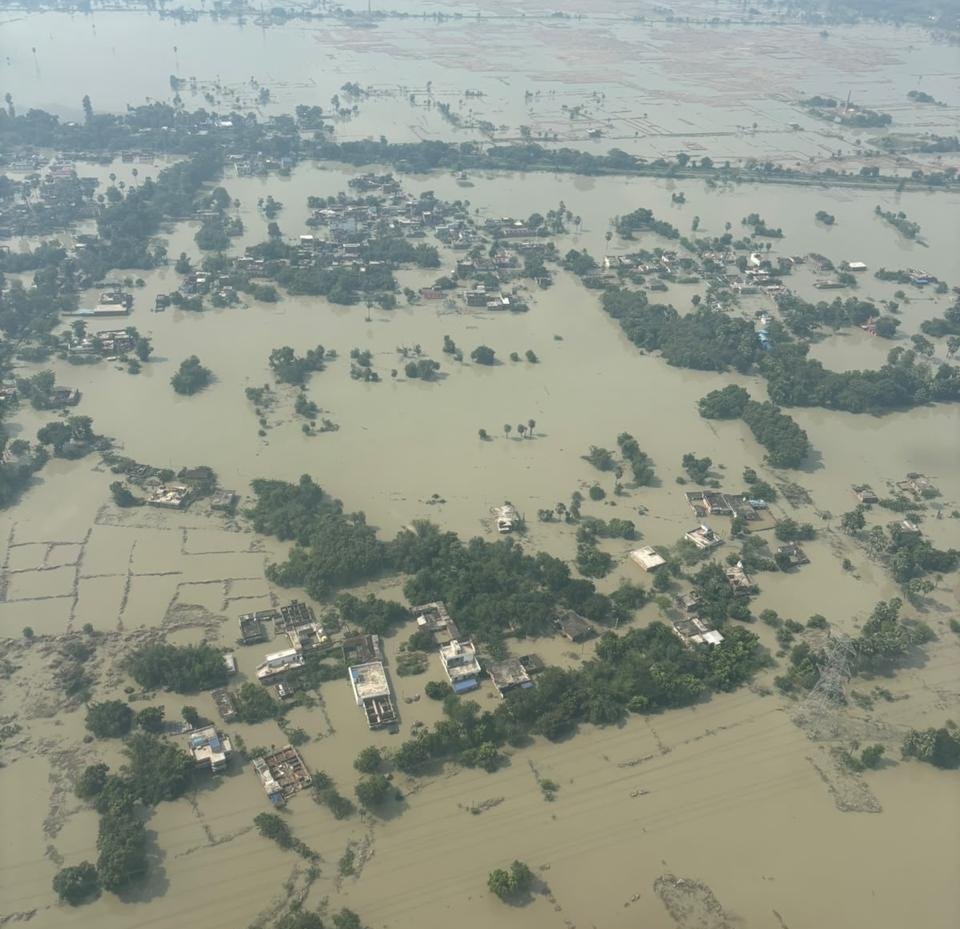
(Feature Image: Flood inundated areas in Saran district after a breach in Gandak embankment. Source: IAF, Oct. 02, 2026)
After July 2020 Gandak floods, SANDRP had highlighted inconsistencies in flood levels recorded at the Central Water Commission’s (CWC) monitoring stations along the river and called for an independent investigation into embankment breaches, obstructions in the river and the role of Nepal’s catchment in the floods. Six years later, these concerns remain relevant and the Gandak continues to experience unusual flood spells.
In 2026, the river has witnessed at least three flood spells, one each in in Aug, Sept and Oct. Two of the floods were associated with cascading disasters in the upstream Bhote Koshi basin in Nepal-Tibet on Aug. 26 and in the Budhi Gandaki basin on Oct. 11 in Nepal.
The most significant flood spell occurred in last week of Sept. 2026 following widespread precipitation across the Gandak catchment in India and Nepal. Based on available information on inflows at Valmikinagar (Gandak) barrage and water levels at eleven flood monitoring stations, this report analyses the impacts of these three flood spells and the questions they raise about flood monitoring and management along the Gandak.
Rasuwa Disaster: The cascading disaster in the upper catchment of the Lhende Khola, a tributary of the Bhote Koshi in the Trishuli basin, started at around 8:30 am on Aug. 26. It remains unclear how long the resulting flood surge took to reach Gandak barrage in West Champaran district, Bihar.
We began tracking inflows at the barrage at 06:00 hrs on Aug. 26, when the recorded inflow was 2,450.40 cumecs. The inflow rose to 4,745.02 cumecs at 16:00 hrs that day. It subsequently declined to 3,577.88 cumecs at 17:00 hrs, before rising again. The hourly data showed an inflow of 4,745.02 cumecs at both 23:00 and 24:00 hrs on Aug. 26. The inflow then declined to 2,747.86 cumecs by 05:00 hrs on Aug. 27.
The number of flood surges generated by the disaster is also not clear. However, the barrage records indicate another rise in inflow on Aug. 27, with the discharge remaining at around 3,509.90 cumecs for five hours, from 11:00 to 15:00 hrs.
The impact of the reported breach of an artificial lake on Aug. 28 is not clearly reflected in the barrage inflow records, as inflows remained below 3,000 cumecs throughout Aug. 28 and 29. Interestingly, the highest inflow recorded during this period was 5,116.14 cumecs at 19:00 hrs on Aug. 30.
Significant inflows continued at the barrage over the following days, until Sept. 8. The highest inflow during this period was 5334.26 cumecs recorded on Sept. 2 at 18:00 hrs. The inflow on Sept. 03 also reached 4,855.51 cumecs at 13:00 hrs, higher than the peak recorded on Aug. 26, the day of the Rasuwa disaster. By 24:00 hrs on Sept. 08, the inflow had declined to 2,861.18 cumecs, the last reading in the data set examined.
There is no official information to reveal whether the higher inflows recorded on Aug. 30 and on Sept. 2–3 were linked to the Rasuwa disaster or to rainfall in Trishuli basin. The daily minimum and maximum inflows recorded at the barrage between Aug. 26 and Sept. 08 are given in Table 1. The complete hourly inflow data are available here.
Table 1: Lowest/Highest Inflows (in cumecs) at Gandak Barrage between Aug. 26 & Sept. 09, 2026.
| Date | Time | Lowest | Time | Highest |
| 26.08.2026 | 06:00 hr | 2450.40 | 16:00 hr | 4745.02 |
| 27.08.2026 | 05:00 hr | 2747.86 | 01:00 hr | 4144.46 |
| 28.08.2026 | 24:00 hr | 2566.57 | 14:00 hr | 2892.27 |
| 29.08.2026 | 01:00 hr | 2501.41 | 10:00 hr | 2892.27 |
| 30.08.2026 | 01:00 hr | 2827.19 | 19:00 hr | 5116.14 |
| 31.08.2026 | 03:00 hr | 3158.64 | 14:00 hr | 3371.10 |
| 01.09.2026 | 01:00 hr | 3087.71 | 11:00 hr | 4254.95 |
| 02.09.2026 | 04:00 hr | 3654.39 | 18:00 hr | 5334.26 |
| 03.09.2026 | 23:00 hr | 4093.47 | 13:00 hr | 4855.51 |
| 04.09.2026 | 22:00 hr | 3702.54 | 01:00 hr | 4311.60 |
| 05.09.2026 | 03:00 hr | 3492.91 | 10:00 hr | 4198.29 |
| 06.09.2026 | 01:00 hr | 3773.36 | 08:00 hr | 4127.47 |
| 07.09.2026 | 23:00 hr | 3365.35 | 07:00 hr | 3915.00 |
| 08.09.2026 | 24:00 hr | 2861.18 | 06:00 hr | 3430.58 |
Source: CWC
Flood Monitoring Sites Along Gandak: The CWC has 12 flood monitoring sites along the river including 1 inflow forecast (Gandak Barrage), 5 level forecast (Khadda, Chatia, Dumariaghat, Rewaghat and Hajipur) and 6 (Triveni, Chhitaunighat, Bagaha, Thakraha, Kukraha and Lalganj) level monitoring sites. The following table presents the recorded water levels at the 11 sites after the Rasuwa disaster.
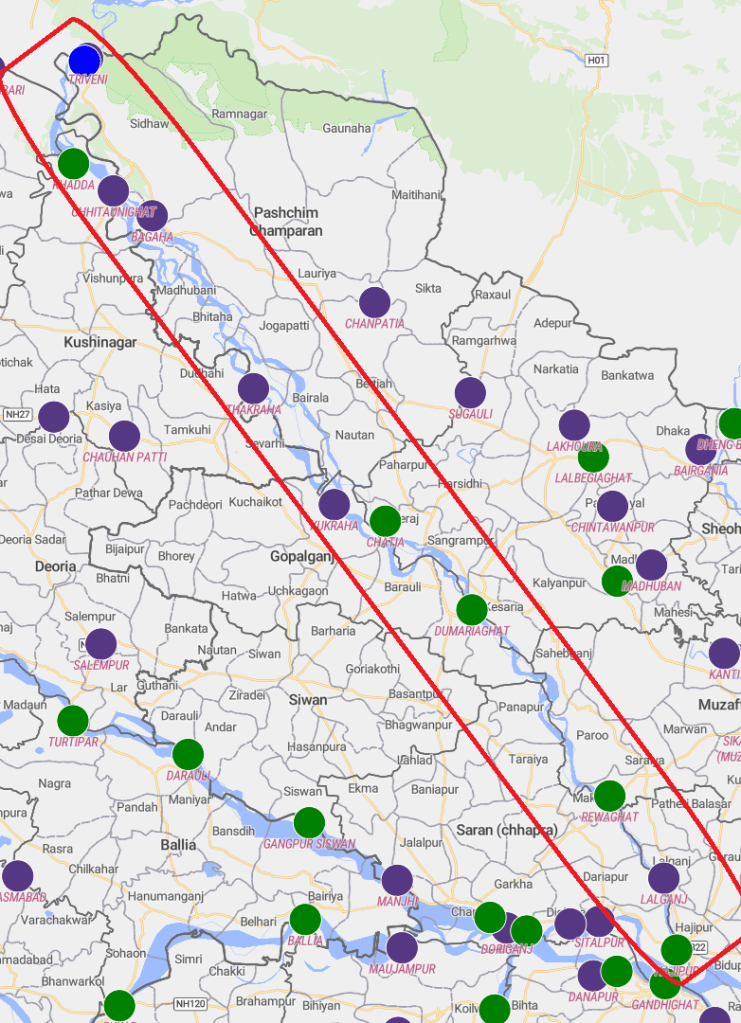
Table 2: Flood level at 11 monitoring sites on Gandak in Aug. 2026
| SN | Site/ District | WL/ DL | HFL/ Date | Peak Level | Peak Level |
| 1 | Triveni/ West Champaran | 108.67 m/ 109.67 m | 112.79 m/ NA | 107.54 m/ 16:00 hr/ 26.08.2026 | 107.87 m/ 19:00 hr/ 30.08.2026 |
| 2 | Khadda/ Kushi Nagar | 95 m/ 96 m | 97.5 m/ 23.07.2002 | 95.35 m/ 04:00 hr/ 27.08.2026 | 95.41 m/ 04:00 hr/ 31.08.2026 |
| 3 | Chhitaunighat/ Kushi Nagar | 91.5 m/ 92.5 m | 94 m/ 29.09.2024 | 92.14 m/ 04:00 hr/ 27.08.2026 | 92.39 m/ 02:00 hr/ 31.08.2026 |
| 4 | Bagaha/ West Champaran | 88.4 m/ 89.4 m | 90.9 m/ 29.09.2024 | 89.25 m/ 09:00 hr/ 27.08.2026 | 89.4 m/ 05:00 hr/ 31.08.2026 |
| 91.25 m/ 28.09.2026 | |||||
| 5 | Thakraha/ West Champaran | 76.18 m/ 77.18 m | 78.68 m/ 23.07.2020 | 77.1 m/ 20:00 hr/ 27.08.2026 | 77.29 m/ 14:00 hr/ 31.08.2026 |
| 6 | Kukraha/ Gopalganj | 69.6 m/ 70.6 m | 72.1 m/ 08.07.2024 | 70.04 m / 14:00 hr/ 31.08.2026 | |
| 7 | Chatia/ East Champaran | 68.15 m/ 69.15 m | 70.04 m/ 26.07.2002 | 66.85 m/ 12:00 hr/ 01.09.2026 | |
| 8 | Dumariaghat/ Gopalganj | 61.22 m/ 62.22 m | 64.36 m/ 24.07.2020 | 62.85 m/ 04:00 hr/ 28.08.2026 | 62.88 m/ 06:00 hr/ 01.09.2026 |
| 9 | Rewaghat/ Muzaffarpur | 53.41 m/ 54.41 m | 55.46 m/ 24.07.2020 | 53.72 m/ 13:00 hr/ 28.08.2026 | 53.74 m/ 11:00 hr/ 01.09.2026 |
| 55.68 m/ 30.09.2026 | |||||
| 10 | Lalganj/ Vaishali | 49.5 m/ 50.5 m | 52.12 m/ 02.10.2024 | 50.76 m/ 14:00 hr/ 28.08.2026 | 50.89 m/ 12:00 hr/ 01.09.2026 |
| 52.32 m/ 30.09.2026 | |||||
| 11 | Hajipur/ Vaishali | 49.32 m/ 50.32 m | 50.93 m/ 18.08.1948 | 49.39 m/ 02:00 hr/ 28.08.2026 | 49.51 m/ 12:00 hr/ 01.09.2026 |
Source: CWC (Note: WL= Warning Level, DL= Danger Level, HFL= Highest Flood Level, m = meter)
The barrage inflow data do not conclusively establish the peak flood surge caused by the Rasuwa disaster or the time it took to reach the barrage in India. The hydrography of the various sites also suggest that the Aug. 2026 Rasuwa disaster did not cause a significant rise in flood level in Gandak river.
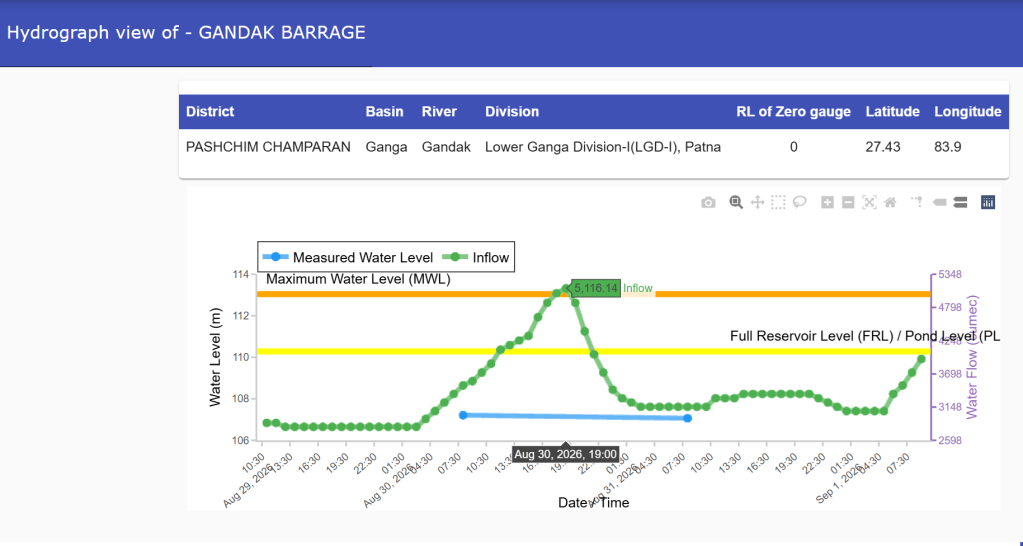
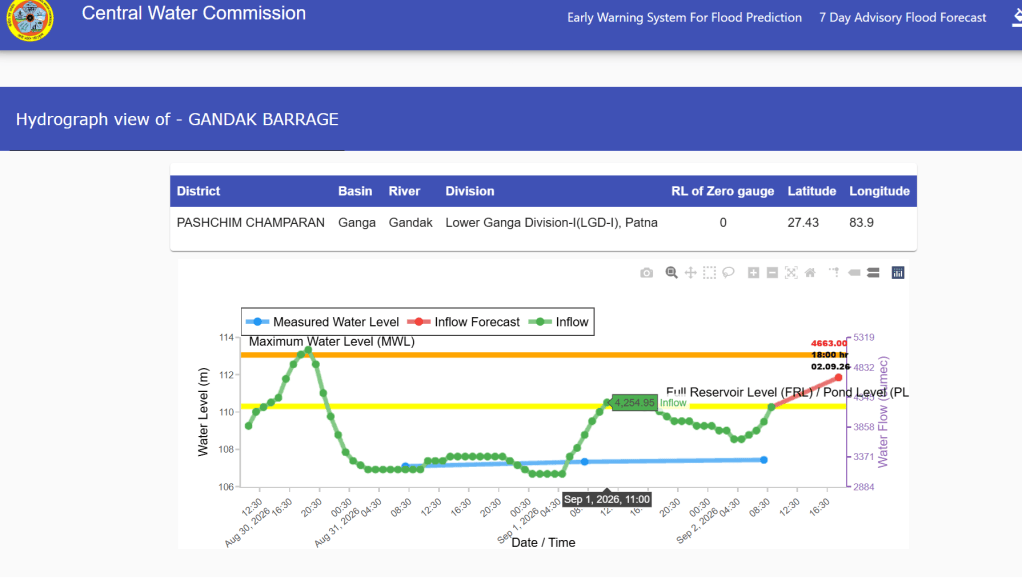
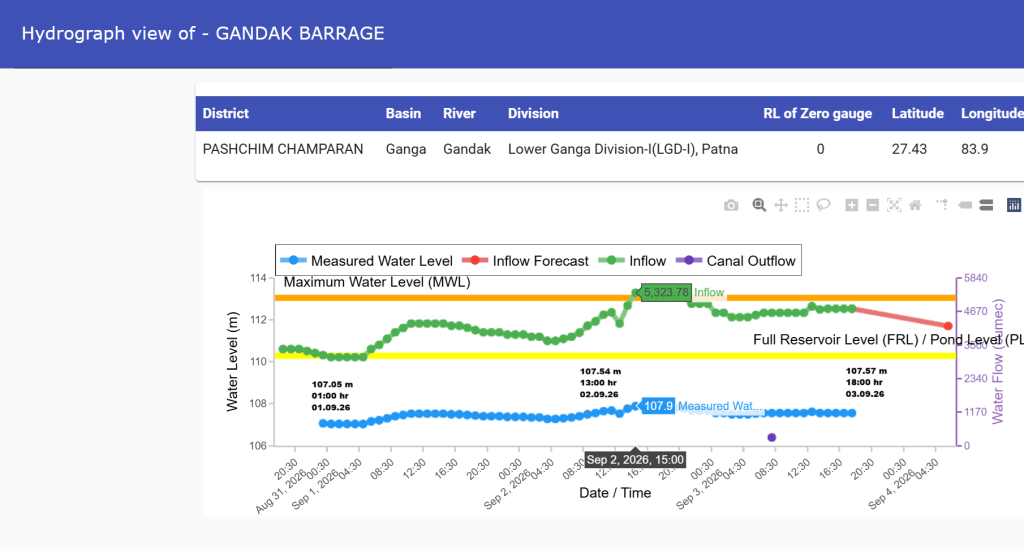
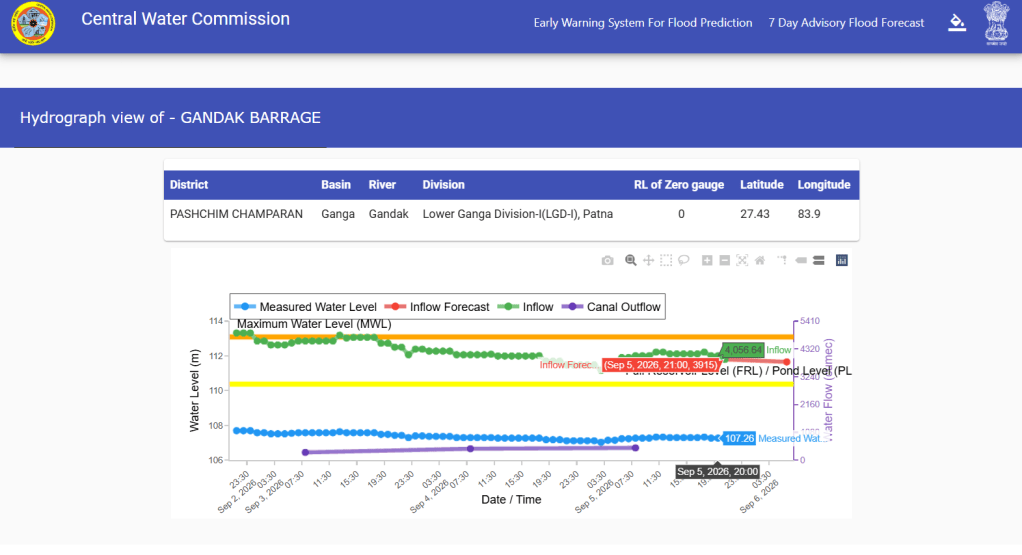
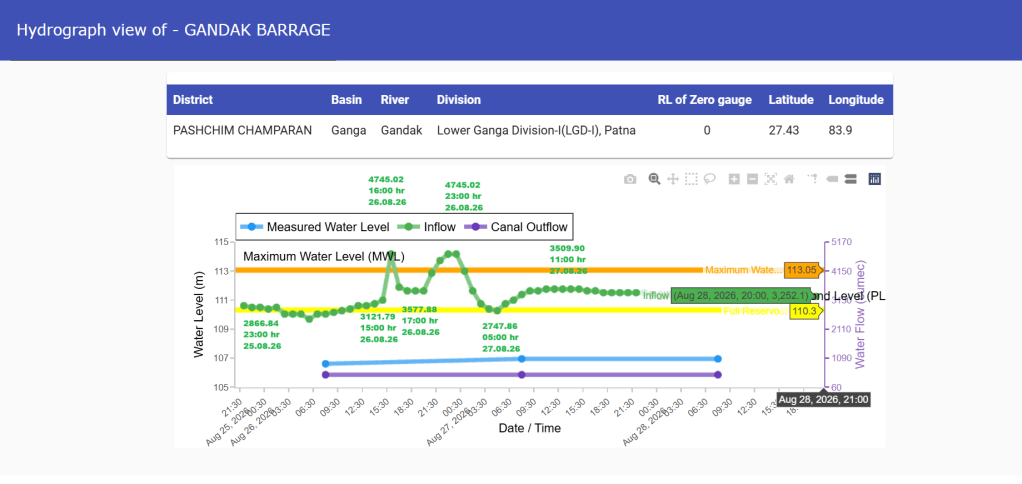
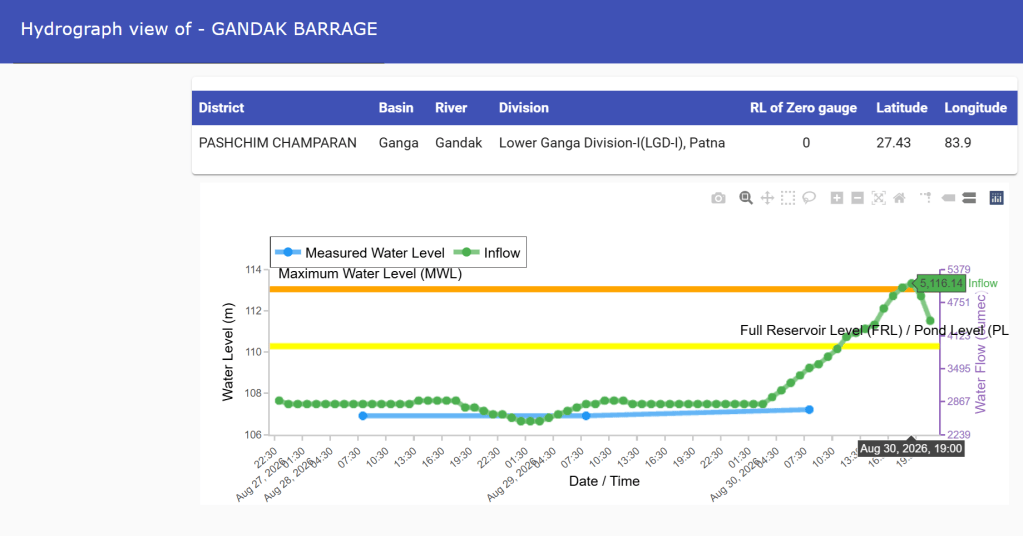
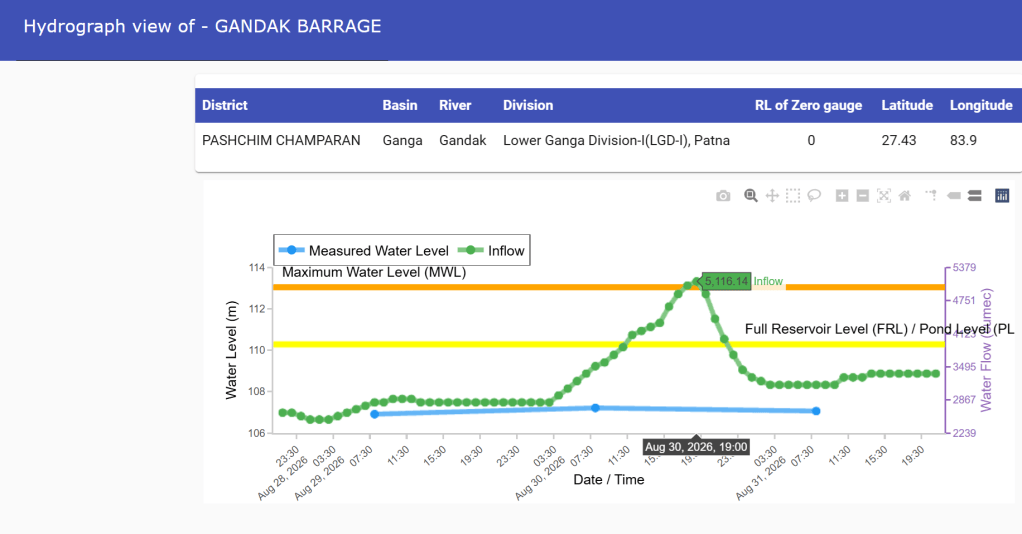
CWC Hydrographs showing inflow at Gandak barrage between Aug. 28 and Sept. 05, 2026.
The flood levels remained below the warning level at Triveni and Chatia sites. It crossed the warning level but remained below the danger level at Khadda, Chhitaunighat, Kukraha, Rewaghat and Hajipur sites. At Bagaha, Thakraha, Dumariaghat and Lalganj, the flood level marginally crossed the danger level.
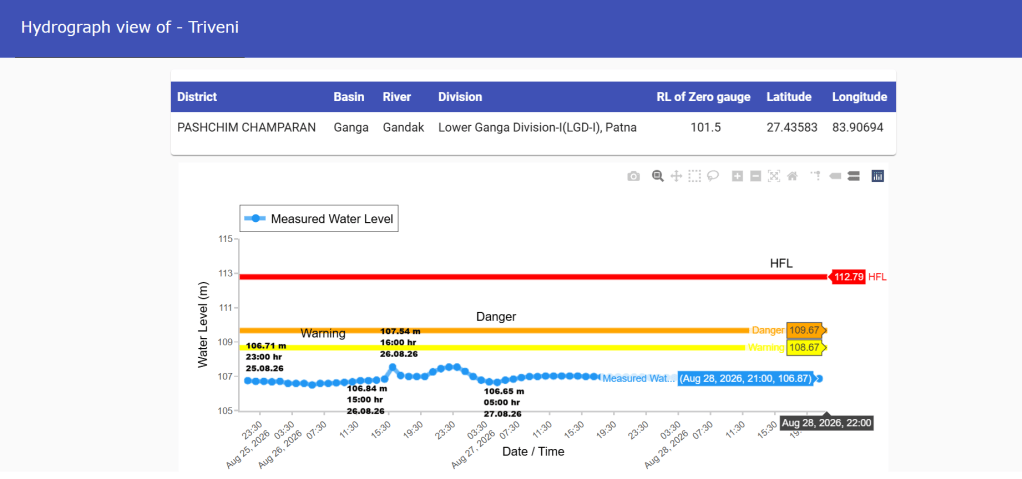
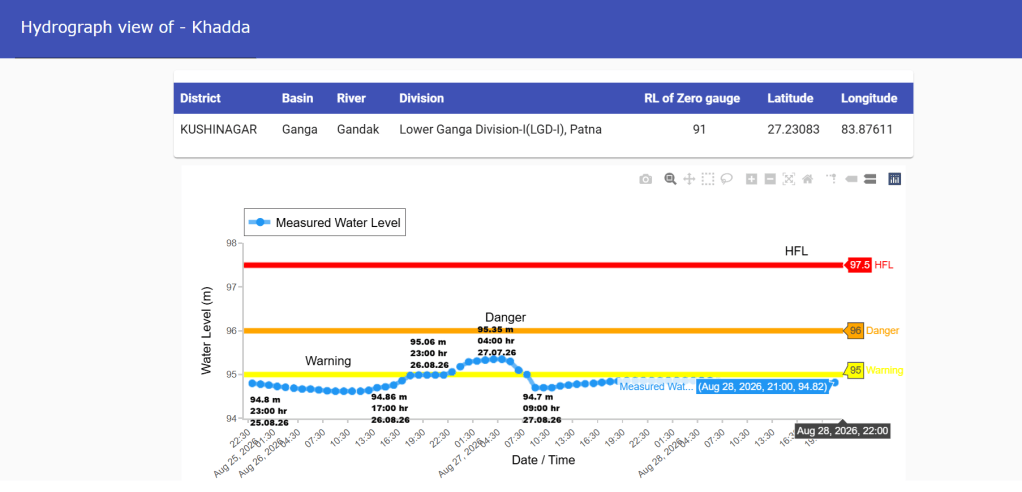
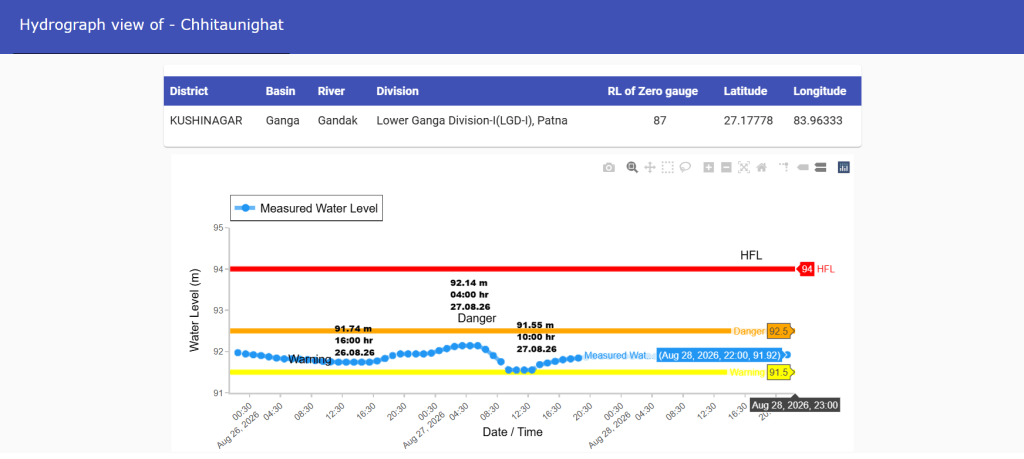
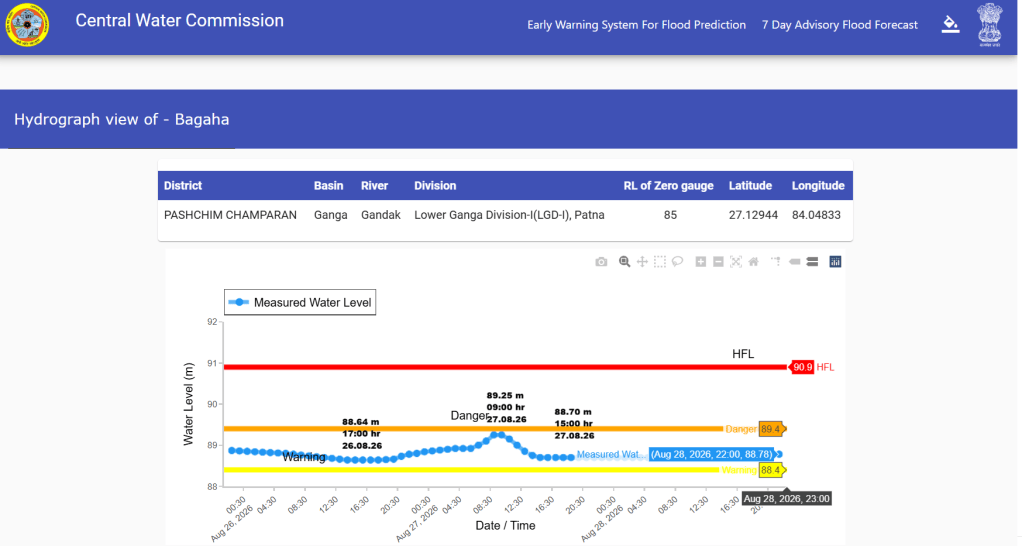
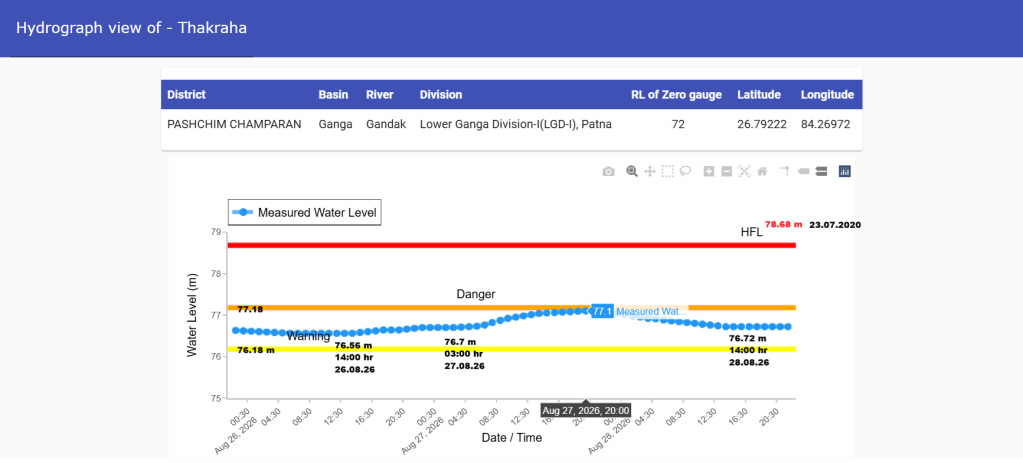
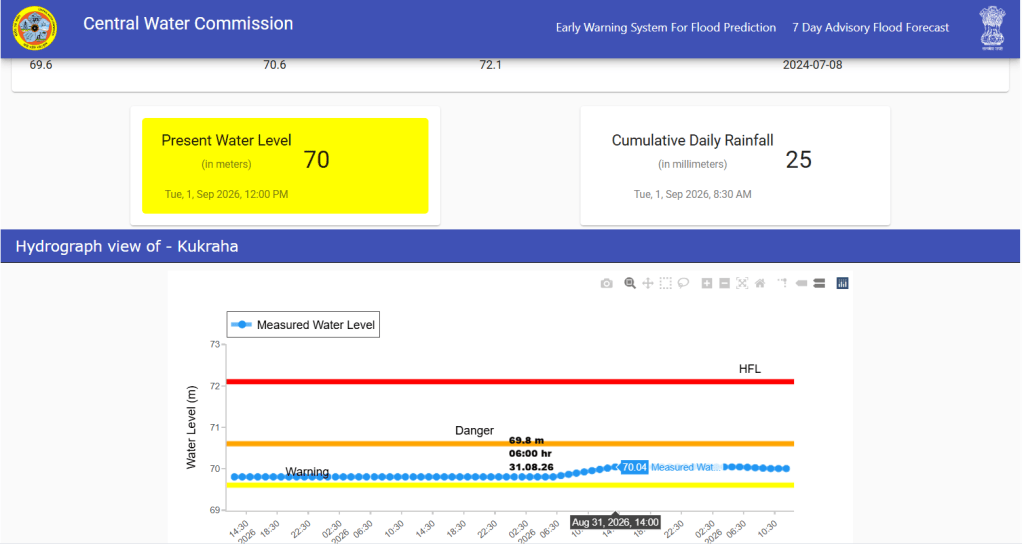
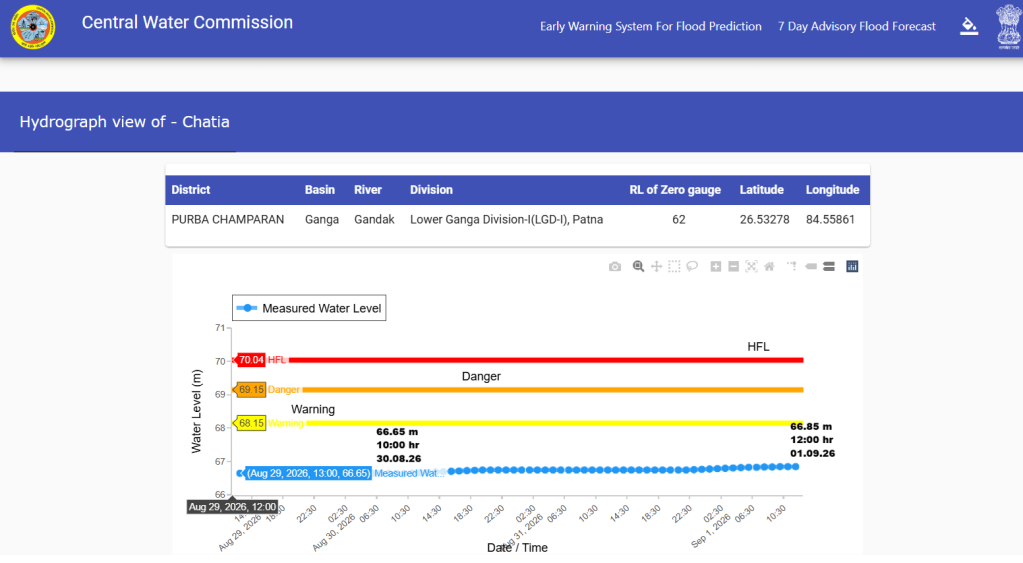
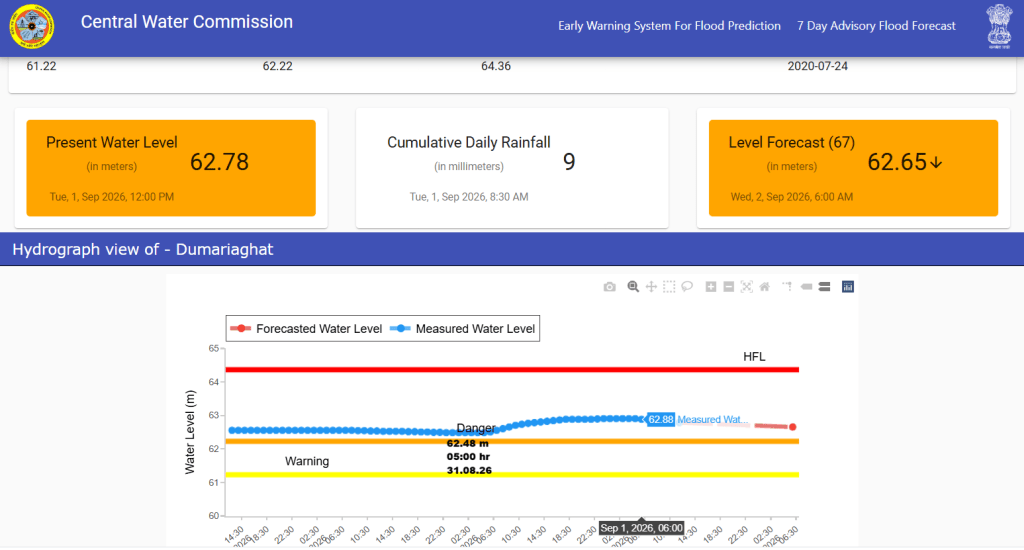
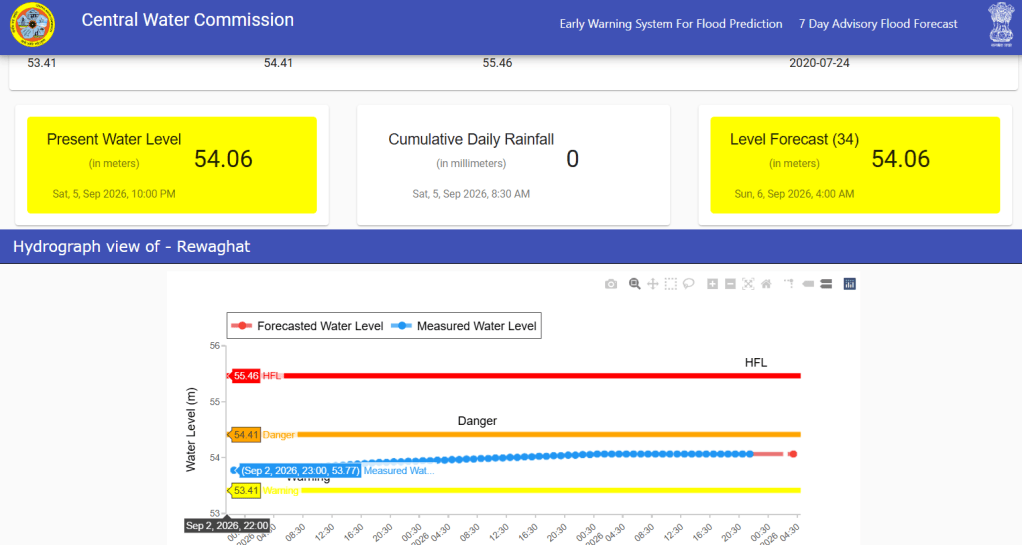
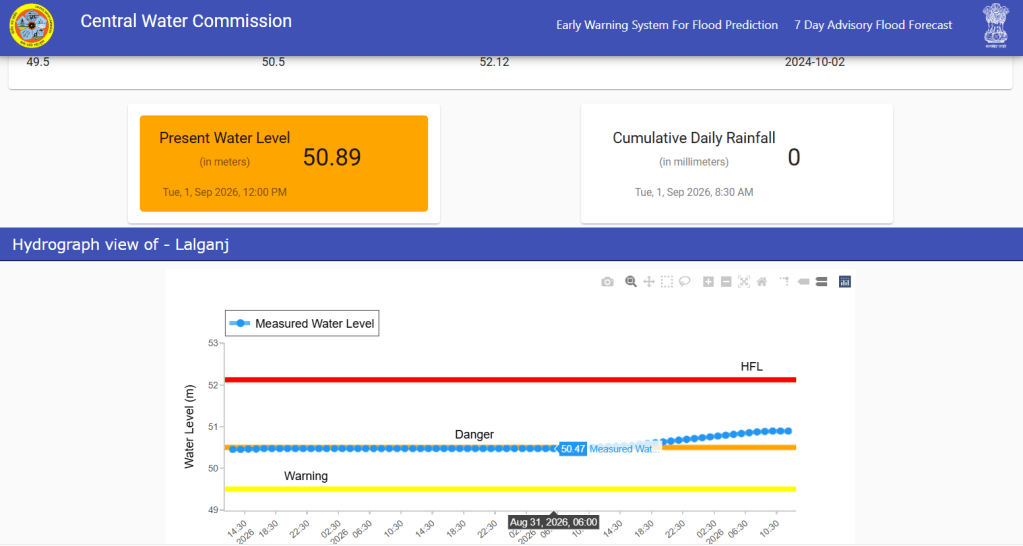
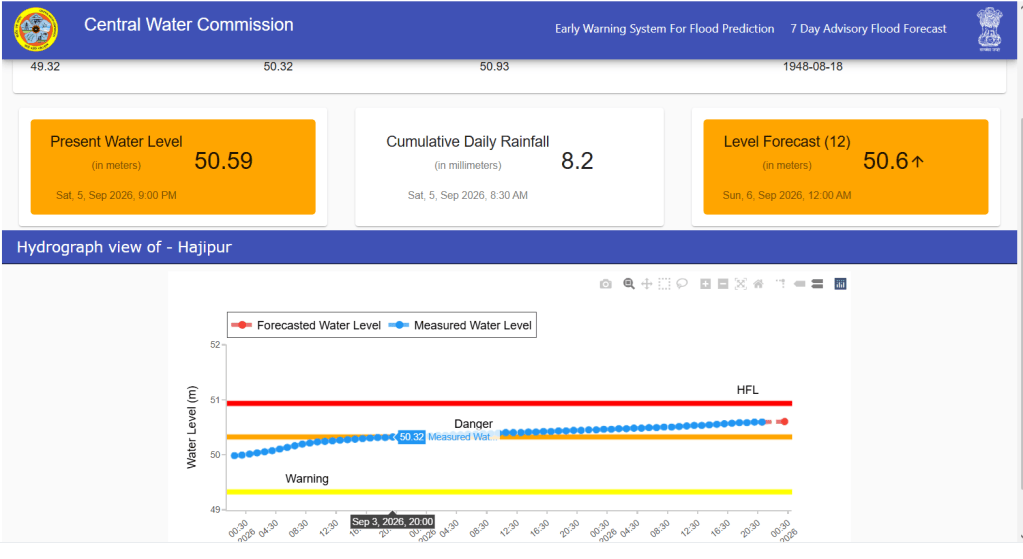
CWC hydrographs showing flood levels at various sites along Gandak between Aug. 28 and Sept. 05, 2026.
Notably, when the Rasuwa disaster occurred, 5 of the monitoring sites were already experiencing above normal flood conditions, while Dumariaghat and Lalganj were in the severe flood category. This indicates that the river was already experiencing elevated water levels before the disaster in Nepal.
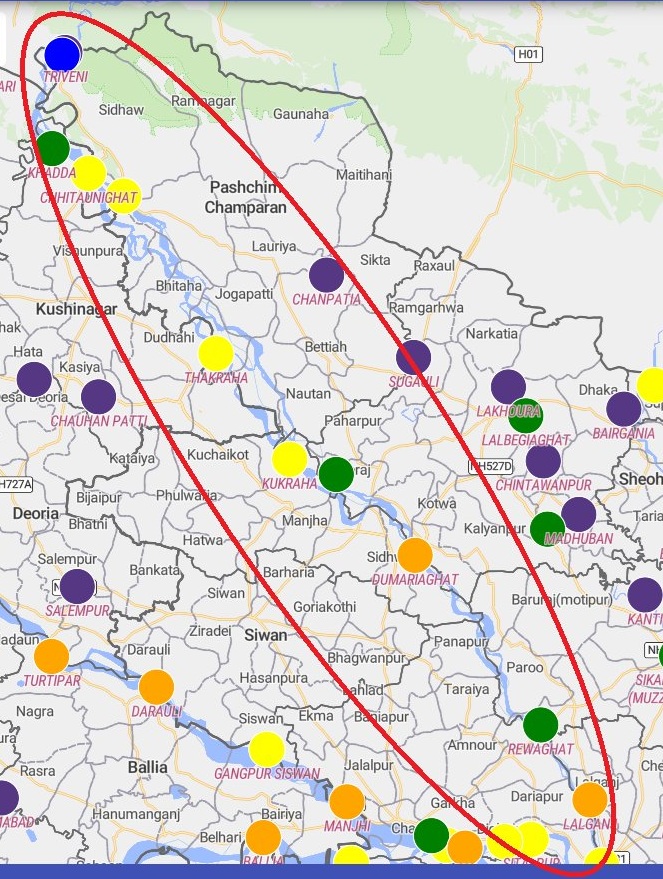
Sept. 2026 Flood: The second and most significant flood spell on the Gandak occurred in the last week of Sept following heavy rainfall across the river’s catchment in India and Nepal. In terms of discharge, the Sept. 2026 flood recorded the third-highest peak discharge from Gandak barrage since its construction. Notably, all six highest discharges from the barrage as listed in the table below have occurred in the last 23 years. Apart from the July 2003 record, the other five have taken place in last eight years between 2019 and 2026.
Table 3: Six Highest Recorded Flood Discharges at Gandak Barrage
| SN | Date | Cusecs | Cumecs |
| 1 | 31 July 2003 | 6,39,750 | 18,112 |
| 2 | 28 Sept. 2024 | 5,62,500 | 15,928 |
| 3 | 28 Sept. 2026 | 5,43,705 | 15,393 |
| 4 | 21 July 2020 | 4,36,500 | 12,359 |
| 5 | 14 Aug. 2023 | 3,14,000 | 8,890 |
| 6 | 18 Sept. 2019 | 2,15,000 | 6,088 |
Source: SANDRP, DTE, News report
Table 4: Hourly Inflows at Gandak Barrage, 26–29 September 2026 (cumecs)
| 26.09.26 | 27.09.26 | 28.09.26 | 29.09.26 | |
| 01:00 Hr | NA | 10,453.25 | 15,127.47 | 6855.52 |
| 02:00 Hr | NA | 10,507.90 | 15,127.47 | 6685.55 |
| 03:00 Hr | NA | 10,883.85 | 15,127.47 | 6430.39 |
| 04:00 Hr | NA | 10,883.85 | 15,396.07 | 6011.33 |
| 05:00 Hr | NA | 11,218.13 | 15,396.07 | 6011.33 |
| 06:00 Hr | NA | 11,331.44 | 14,463.17 | 6011.33 |
| 07:00 Hr | NA | 11,418.88 | 14,084.98 | 5600.56 |
| 08:00 Hr | NA | 11,418.88 | 14,084.98 | 5416.43 |
| 09:00 Hr | NA | 11,558.07 | 13,572.23 | 5416.43 |
| 10:00 Hr | 7932.01 | 11,784.70 | 13,328.61 | 5274.78 |
| 11:00 Hr | 8124.64 | 12,011.33 | 12,726.62 | 5195.46 |
| 12:00 Hr | 8220.96 | 12,237.96 | 12,124.64 | 5036.82 |
| 13:00 Hr | 8220.96 | 12,485.83 | 12,124.64 | 5036.82 |
| 14:00 Hr | 8509.91 | 12,726.62 | 11,671.38 | NA |
| 15:00 Hr | 8509.91 | 13,087.81 | 10,776.20 | NA |
| 16:00 Hr | 8509.91 | 13,454.67 | 9950.10 | NA |
| 17:00 Hr | 8509.91 | 13,572.23 | 9507.08 | NA |
| 18:00 Hr | 8509.91 | 14,211.04 | 9099.15 | NA |
| 19:00 Hr | 8895.18 | 14,211.04 | 8895.18 | NA |
| 20:00 Hr | 8997.16 | 14,211.04 | 8509.96 | NA |
| 21:00 Hr | 9201.13 | 14,589.23 | 8220.96 | NA |
| 22:00 Hr | 9303.11 | 14,722.37 | 7750.60 | NA |
| 23:00 Hr | 9609.06 | 14,992.91 | 7478.75 | NA |
| 24:00 Hr | 10,130.31 | 14,992.91 | 7206.79 | NA |
Source: CWC
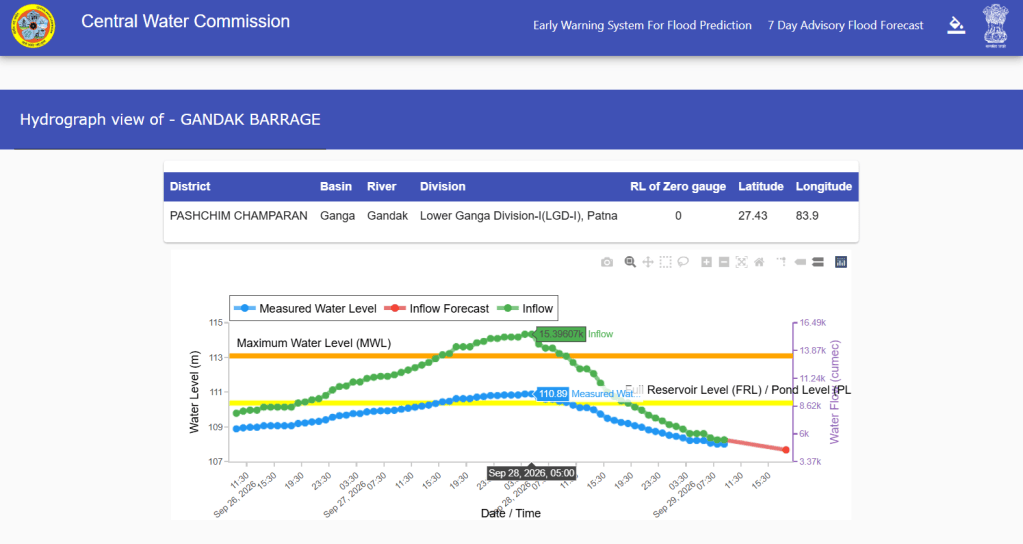
CWC Gandak barrage hydrograph on Sept. 29, 2026.
We began tracking the barrage inflow at 10:00 hrs on Sept. 26, when it stood at 7,932.01 cumecs. It rose steadily and exceeded 15,000 cumecs for five consecutive hours between 01:00 and 05:00 hrs on Sept. 28. By 13:00 hrs on Sept. 29, when we stopped tracking the data, the inflow had declined to 5,036.82 cumecs.
The flood had a significant impact along the river. CWC records show that the Sept. flood crossed the previous HFLs at four monitoring sites and reached close to the previous HFLs at five other sites.
Table 5: Flood Levels at 11 Gandak Monitoring Stations in Sept. 2026
| SN | Site | Old HFL/ Date | Peak level/ Date | Flood Level Corresponding HFL |
| 1 | Triveni | 112.79 m/ NA | 110.89/ 28.09.2026 | -1.9 m |
| 2 | Khadda | 97.5 m/ 23.07.2002 | 96.43 m/ 28.09.2026 | -1.07 m |
| 3 | Chhitaunighat | 94 m/ 29.09.2024 | 93.85 m/ 10:00 hr/ 28.09.2026 | -0.15 m |
| 93.2 m/ 07.07.2024 | ||||
| 93.05 m/ 16.06.2021 | ||||
| 4 | Bagaha | 90.9 m/ 29.09.2024 | 91.25 m/ 12:00 hr/ 28.09.2026 | +0.35 m/ ~19 hrs/ 2 yrs |
| 90.3 m/ 07.10.2022 | ||||
| 90.08 m/ 27.08.2021 | ||||
| 5 | Thakraha | 78.68 m/ 23.07.2020 | 78.65 m/ 24:00 hr/ 28.09.2026 | -0.03 m |
| 6 | Kukraha | 72.1 m/ 08.07.2024 | 71.91 m/ 11:00 hr/ 29.09.2026 | -0.19 m |
| 71.9 m/ 30.08.2021 | ||||
| 7 | Chatia | 70.04 m/ 26.07.2002 | 69.84 m/ 22:00 hr/ 29.09.2026 | -0.20 m |
| 8 | Dumariaghat | 64.36 m/ 24.07.2020 | 64.64 m/ 08:00 hr/ 30.09.2026 | +0.28 m/ ~37 hrs/ 06 yrs |
| 64.10 m/ 17.08.2017 | ||||
| 9 | Rewaghat | 55.46 m/ 24.07.2020 | 55.68 m/ 18:00 hr/ 30.09.2026 | +0.22 m/ ~22 hrs/ 06 yrs |
| 55.41 m/ 17.09.1986 | ||||
| 10 | Lalganj | 52.12 m/ 02.10.2024 | 52.32 m/ 22:00 hr/ 30.09.2026 | +0.20 m/ ~44 hrs/ 02 yrs |
| 51.83 m/ 02.09.2021 | ||||
| 51.75 m/ 25.07.2020 | ||||
| 51.62 m/ 04.08.2001 | ||||
| 11 | Hajipur | 50.93 m/ 18.08.1948 | 50.6 m/ 22:00 hr/ 05.09.2026 | -0.33 m |
Source: CWC
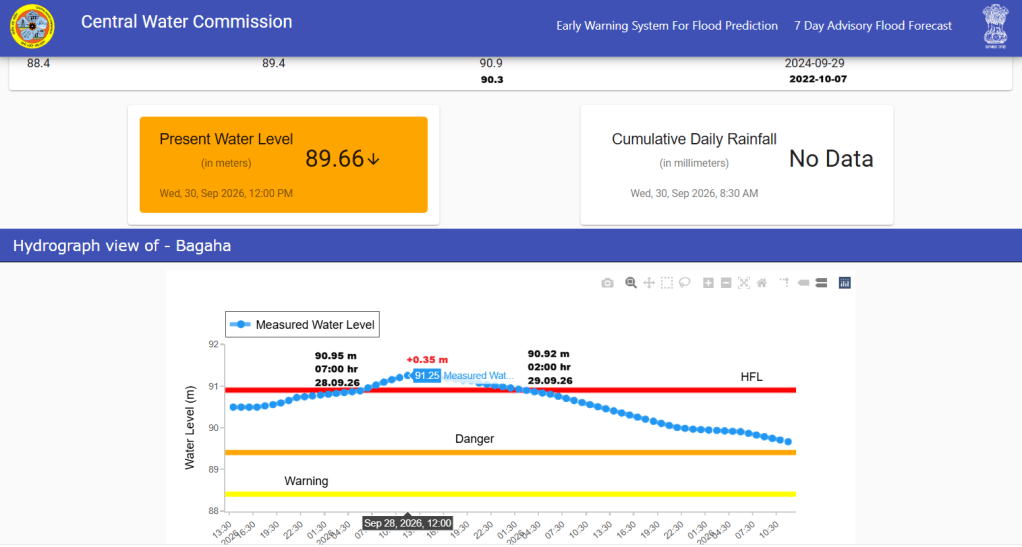
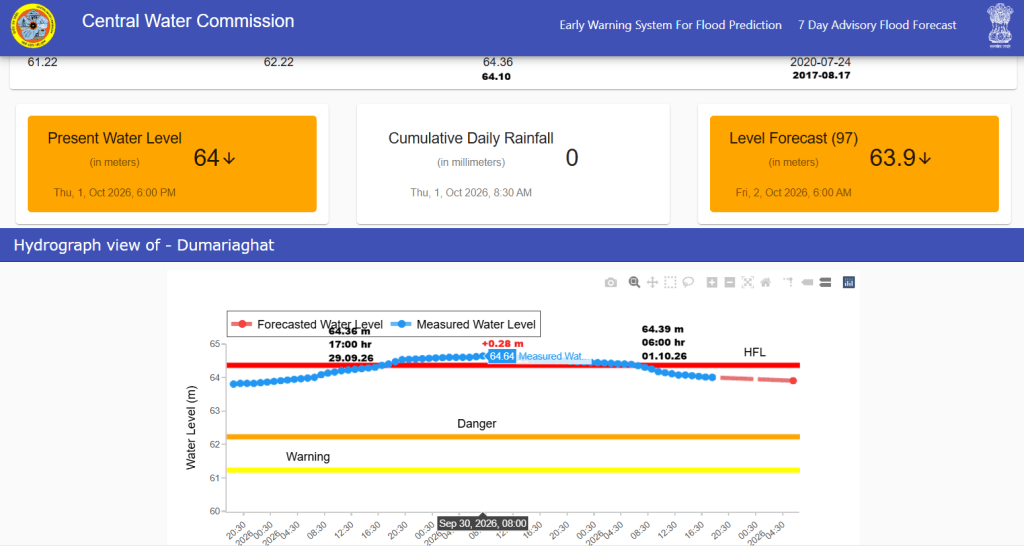
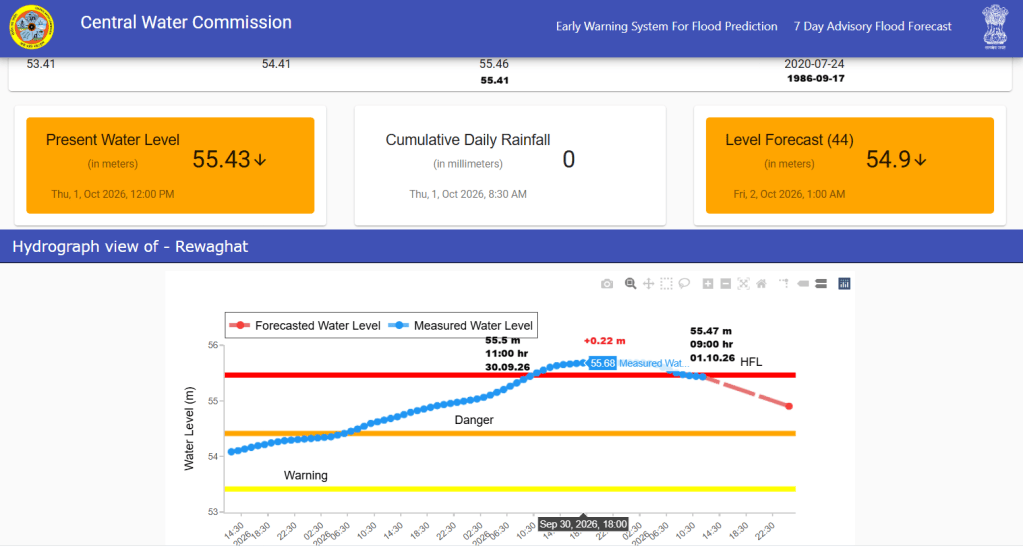
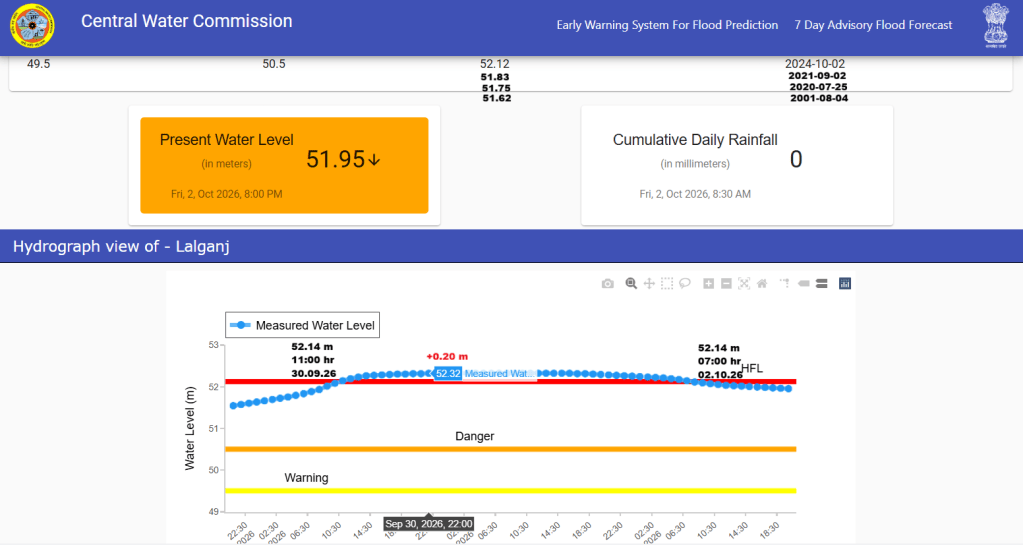
CWC hydrograph showing four sites where Gandak breached HFLs in Sept. 2026.
The CWC data shows that the Sept. 2026 floods in Gandak crossed the previous HFLs at four stations: Bagaha, Dumariaghat, Rewaghat and Lalganj. Interestingly, the flood levels at Triveni, the first monitoring station upstream of Gandak barrage and at Khadda, the first station downstream the barrge, remained 1.90 m and 1.07 m below their respective HFLs.
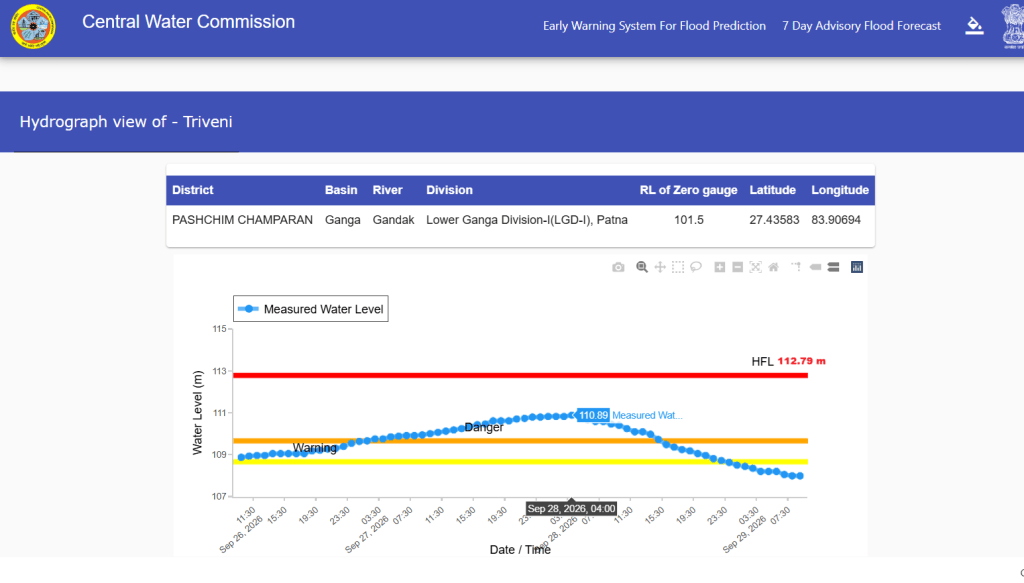
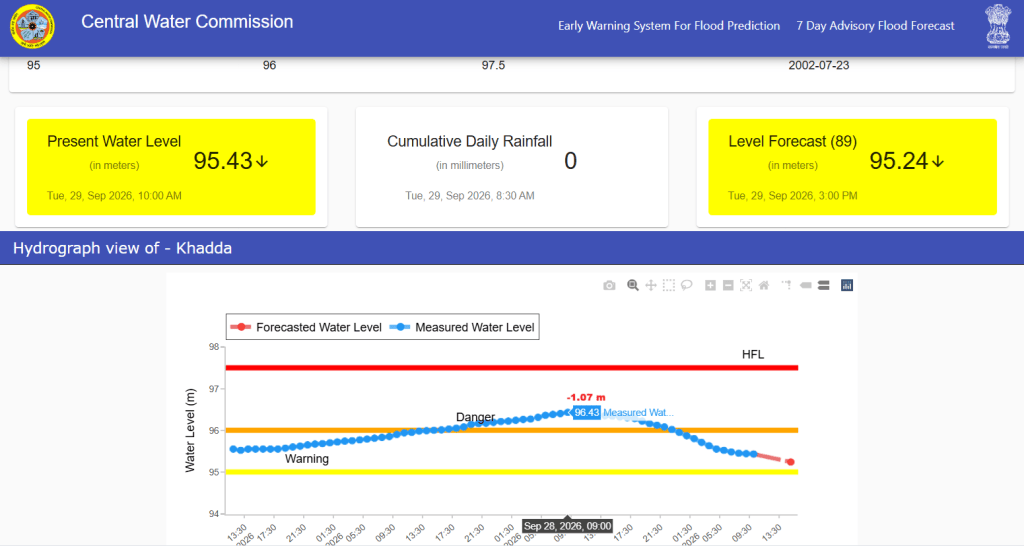
CWC hydrograph showing peak flood levels at Triveni and Khadda sites in Sept. 2026.
At Chhitaunighat, the river missed crossing the previous HFL of 94.00 m, dated 29.09.2024, by just 0.15 m. In contrast, at the downstream Bagaha station, it crossed the previous HFL of 90.90 m dated 29.09.2024 by 0.35 m.
Notably, at three next downstream sites, the river narrowly missed the previous HFLs: by 0.03 m at Thakraha, where previous HFL was recorded 78.68 m on 23.07.2020; by 0.19 m at Kukraha, where previous HFL 72.1 m was recorded on 08.07.2024; and by 0.20 m at Chatia, where previous HFL 70.04 m was recorded on 26.07.2002.
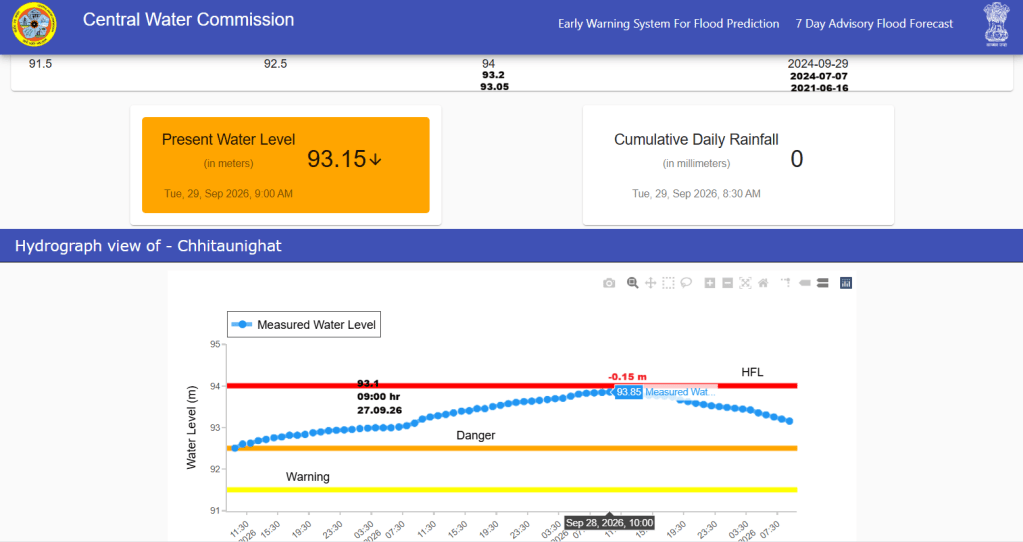
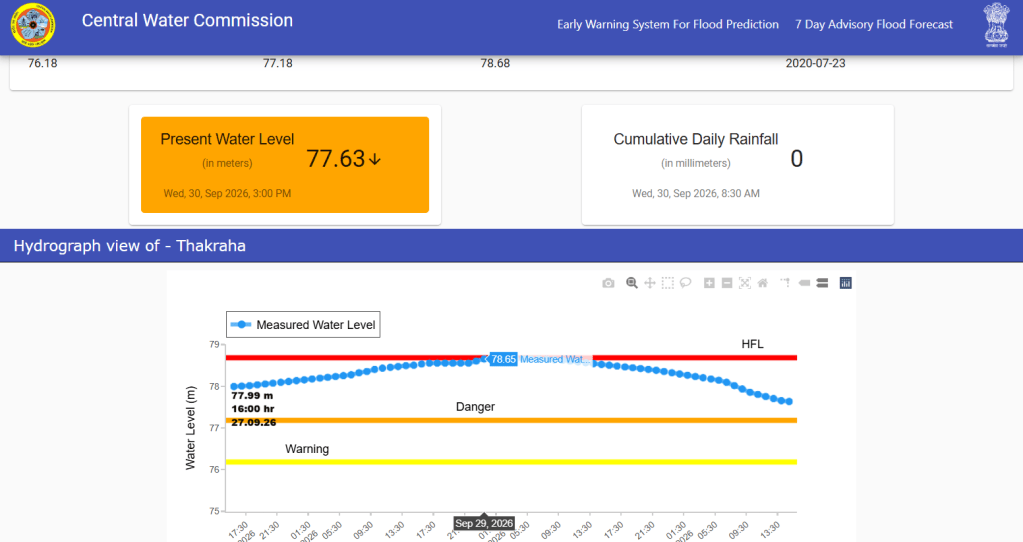
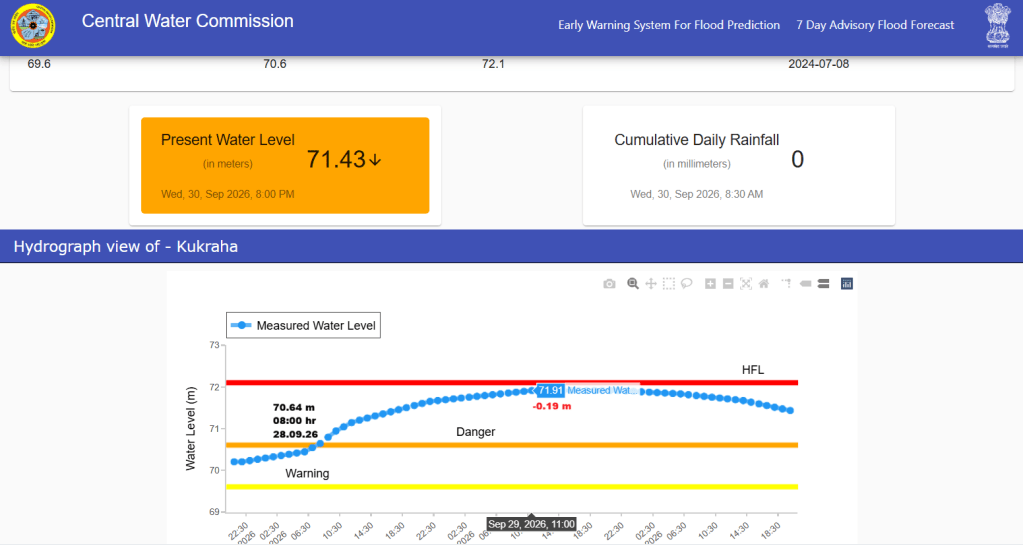
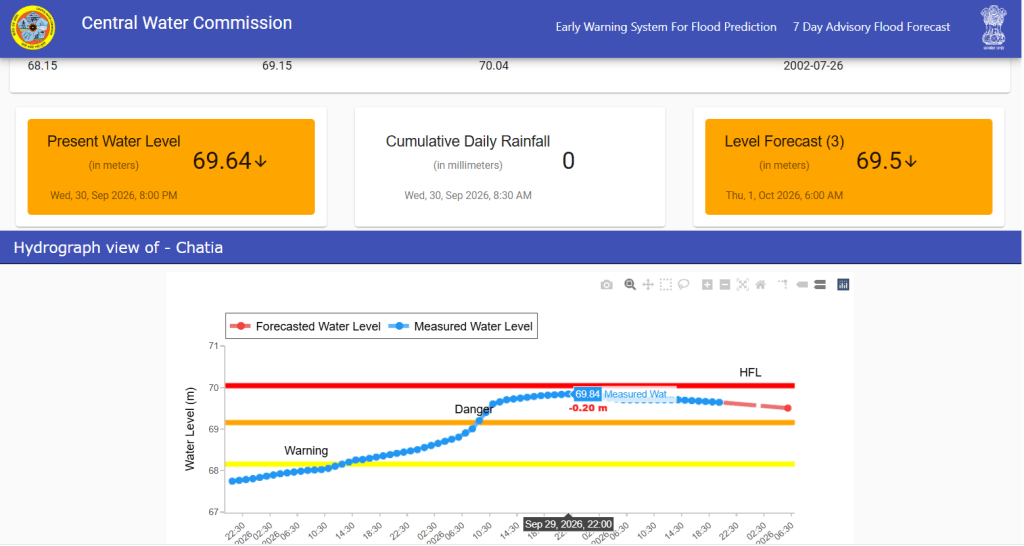
CWC hydrographs shows peak flood levels at Chhitaunighat, Thakraha, Kukraha and Chatia sites where Gandak narrowly missed crossing previous HFLs in last week of Sept. 2026.
Further downstream, the river crossed the previous HFLs at Dumariaghat and Rewaghat by 0.28 m and 0.22 m, respectively. Both stations had recorded their previous HFLs in July 2020. At Lalganj, the Sept. 2026 peak exceeded the previous HFL of Oct. 2024 by 0.20 m. The river remained in extreme floods for longest 44 hours at the Lalganj site, followed by 37 hours at Dumariaghat, 22 hours at Rewaghat and 19 hours at Bagaha site.
It is noteworthy that the HFL of 50.93 m at Hajipur, recorded on 18 August 1948, has remained unbreached for the past 78 years, despite major floods in 1986, 2001, 2003, 2019, 2020, 2023, 2024 and 2026. Following the Rasuwa disaster, the water level at Hajipur reached 50.60 m on Sept. 05, remaining 0.33 m below the 1948 HFL. After the Sept. flood, the peak level recorded at the site was 50.02 m on Oct. 01, which was 0.30 m below the danger level.
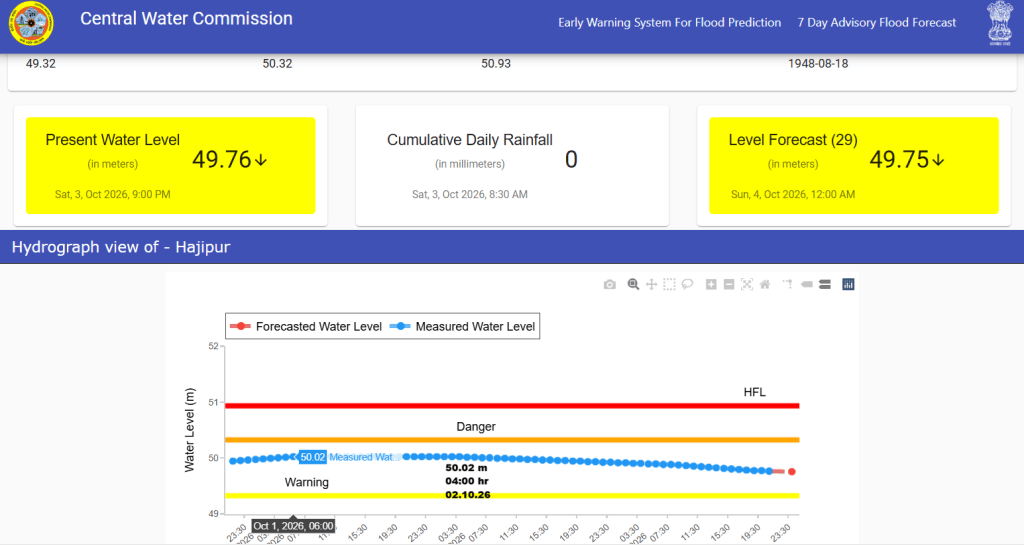
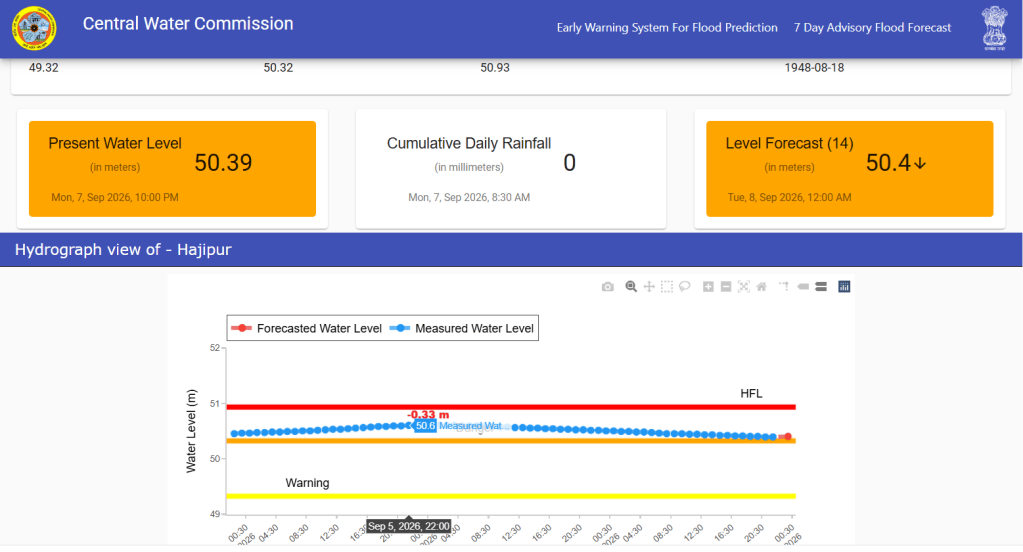
CWC hydrographs showing peak flood levels at Hajipur site after Aug. 26 Rasuwa floods and Sept. 2026 floods.
It is also observed that the HFL at Dumariaghat and Rewaghat has been crossed after 6 years. The previous HFL at each site was attained in July 2020. Also, the Gandak river has been frequently attaining new HFLs at Chhitaunighat, Bagaha and Lalganj sites.
Notably, despite third highest flood discharge from the Gandak barrage, the 2002 HFL at Chatia and 1948 HFL at Hajipur site has remained uncrossed.
Embankment Breach: As per this report, the second flood spell in Gandak recorded a discharge of five lakh cusecs for 13 hours and four lakh cusecs for 32 hours on Sept. 27 and 28 from the Gandak barrage. The high flows reportedly damaged embankments at six locations along the river. The affected areas included Bagaha-I, Bairia and Yogapatti blocks in West Champaran; Baikunthpur in Gopalganj; and Maker and Panapur in Saran district.
The second phase caused an estimated Rs 1,054 crore in damage. Of this, the Water Resources Department (WRD) reported losses of Rs 1,027.34 crore, while the Public Health Engineering Department reported damage worth Rs 26.81 crore.
The flood severely affected six districts along the Gandak including West Champaran, East Champaran, Gopalganj, Muzaffarpur, Saran and Vaishali. At least 18 people reportedly died, including 15 in Saran and three in West Champaran. More than 200 villages were inundated, and standing paddy and other Kharif crops were damaged. The rising Ganga further worsened the situation, as backwater effects slowed the recession of floodwaters in the Gandak.
Budhi Gandaki Flood: The third flood spell in the Gandak followed a cascading disaster in Nepal’s Budhi Gandaki basin in the early hours of Oct. 11. The peak inflow at Gandak barrage was 2016.98 cumces at 24:00 hour on Oct. 11.
The inflows witnessed gradual decline and increased by 847 cumecs in two hours from 1172.8 cumces at 12:00 hour to 2019.83 at 15:00 hour on Oct. 13. It remained at 1900.8 cumces at 08:00 on Oct. 14. It looks that the peak flood reached the barrage after 54 hours.
Inflows during this third spell were considerably lower than those recorded during the Aug. and Sept. floods. Consequently, water levels at the monitoring stations were also comparatively lower than during the first two flood spells.
Questions and Concerns: As in July 2020, the Sept. 2026 flood has raised several questions about the CWC’s flood monitoring of the floods in the Gandak river. First, why has the HFL at Hajipur remained unbreached for the past 78 years, despite major floods in the river? Hajipur is the last monitoring site before the river joins the Ganga near Patna. Rising water levels in the Ganga can cause backwater effects and influence levels at Hajipur. However, the HFL has remained uncrossed during both the July 2020 and Sept 2026 floods, this requires further investigation.
Second, why did water levels at Triveni, upstream of the barrage and Khadda, downstream of it, remain more than a meter below their respective HFLs during the Sept 2026 flood, even as several downstream stations crossed their previous HFLs?
Third, why have flood levels repeatedly approached or crossed previous HFLs at Chhitaunighat, Bagaha and Lalganj sites? Are changes in river morphology, sediment deposition, embankments, bridges or other infrastructure affecting water levels and flood behaviour of the river at these sites?
Fourth, how reliable are the discharge measurements at Gandak Barrage and do the recorded inflows adequately explain the flood patterns observed at the downstream monitoring sites?
Finally, why the embankments are repeatedly facing damage and what are their corresponding impacts on flood levels and HFLs at respective sites? How effectively are flood forecasts and warnings communicated to communities living in vulnerable areas? These questions require field investigations and an independent assessment of the river’s changing flood behaviour.
SANDRP


