Gujarat suffering due to political use of water for elections in 2017.
Rajasthan given more water for elections there in 2018. Will Punjab, Haryana suffer now?
Kerala drought: how much could have been reduced if dams were operated more prudently?
North Interior Karnataka is suffering, but Krishna basin dams are almost full? Issue of unsustainable cropping patterns, groundwater overuse, and neglect of recharge & regulation?
Kutch and North Gujarat are likely to face severe water scarcity this year, officials said. The Kutch region has received a mere 26.51 percent of average rainfall so far, while North Gujarat has received 42.93 percent, central Gujarat 66.83 percent, Saurashtra 72.20 percent and South Gujarat the highest 94.79 percent.
However, the Sardar Sarovar Dam is filled up to 125.82 meters, and it can provide drinking water for the entire state till the next summer, the govt said. As per Govt. storage in Sardar Sarovar Dam on the Narmada, which will be enough to meet the state’s need for drinking water through the next summer.
The Narmada water will also be used to fill up empty dams in Saurashtra including Aji 1, Macchu 2, Vadod and Ankadia through the Sauni scheme, officials said.
“The state govt will provide 20,000 cusecs water for the next 20 days to save the crops in water-starved areas,” Deputy CM Nitin Patel told reporters in Gandhinagar said.
“We plan to fill up 400 big and small ponds in North Gujarat by Narmada water through canals and pipeline network of the Sujlam Suflam scheme,” he said.
RajasthanRainfall deficit in many districts As per IMD, Badmer district of Rajasthan has received rainfall 48 percent below normal till Sept. 16. Similarly rainfall deficit in Hanumangarh 58 percent so far. Jallor district is facing maximum rainfall deficit of 60 per cent less than normal. Likewise the rainfall in Pali district is 35 per cent below the normal and in Jaislmer is facing a rainfall deficit of 38 per cent. In Western Rajasthan it rained only 193 mm during entire monsoon season causing a deficit of 24 per cent below the normal.
Central Water Commission is the only agency doing flood forecasting in India. As per CWC’s Flood Forecasting website[i] the Data Flow Map has information about 226 Flood Forecast Sites in the country comprising of 166 Level Forecast Sites and 60 Inflow Forecast Sites. It also monitors 700 other sites, information is made available through List Based Exploration and Hydrograph View, but no flood forecasting is done for these sites.
Accepting that reservoirs operation and flood management in India lack scientific supports, Madhavan Nair Rajeevan, Secretary, Ministry of Earth Sciences, in an interview has revealed that dams and water reservoirs need flood management systems that use scientific methods to understand when the time is right to open the gates.
(Feature Image: IMD Sub-Division wise Weekly Rainfall Map 26 July – 1 Aug. 2018)
Amid news of monsoon being normal, farmers in several parts in the country have started facing irrigation water problems affecting sowing of Kharif crops. Apart from, insufficient rainfall, mismanagement of water resources is turning the situation grim for them.
As per reports, water levels in Bhakra and Pong dams in Himachal has plunged to lowest in decades. As a result dam authority has issued advisory to lakhs of farmers in Haryana, Punjab and Rajasthan to use water judiciously. Some official also said that the beneficiary states lacks efficient water management practices which is making the situation tough for them.
The Sri Ram Sagar Project in Telangana has no irrigation water. As per state water minister, a Rs. 1100 crore work was going on to renovate the dam. Meanwhile farmers of about 24 villages have started protest demanding irrigation water form SRSP for their standing crops. Given the tense situation, the State Govt has deployed heavy police forces to control farmers agitation.
At the same time, farmers in North Gujarat farmers have lost 40% of sown crops particularly in Ahmedabad, Morbi and Surendranagar. Non availability of Narmada waters have added to the problems. It is worth to mention that mismanagement of water during past four months in Narmada dam by the authority, has worsened the plight of farmers. Meanwhile, there are reports of furious Surendranagar farmers themselves opening the dam gates going against authority.
Similarly, lack of rainfall in Beed district which is part of Marathwada in Maharashtra has affected the rural population badly. In fact, the rainfall situation in a fourth of India, including Bihar and Uttar Pradesh, was in stark contrast to the rest of the country. Overall, the southwest monsoon in 2018 was only 2 % below normal by July, 27.
The southwest monsoon in Bihar was almost 40 % below normal till July 27 and the state was set to be formally declared ‘drought-hit’. It is worth to mention that the monsoon scenario seems less than reassuring, based on Skymet latest forecast and reading between the lines of IMD Aug. 3, press release.
How is development possible along with environment protection? There are two kinds of answers possible to this question. The standard kind of reply would try to provide a list of options that are available to a given development need.
For example, to provide water to a city like Delhi, one can think of many options, including rainwater harvesting; groundwater recharge; protection of wetlands, floodplains, rivers, water bodies, catchment including the ridge; creation of more water bodies; demand side management options; treatment and recycling of sewage; reduction in transmission and distribution losses; curbing unjustified, inappropriate and wasteful use, among others. The politicians, engineers and bureaucrats would however suggest dams on Yamuna like Renuka or Lakhwar Vyasi or Kishau and even interlinking of rivers like Sharda Yamuna Link. The first set of measures listed above provide options where it is possible to fulfil the need of Delhi’s water needs through local options that also ensure least environmental impact or rather environment protection. But the government is likely to dismiss them as impractical, insufficient or both. But how do we decide if these measures provide better options than say what the government is proposing?
That takes us to the second kind of answer to the question of How is development possible along with environment protection? What is the decision making process we deploy to find answer as to which is better option for Delhi’s water needs? If our decision making process just involves the bureaucrats, politicians, engineers, consultants, corporate sector and some “experts”, then that process is more likely to give you one set of answers.
In stead, our decision making can involve more democratic, participatory process starting from needs assessment, prioritization of needs, options available for prioritized needs, comprehensively assessing the costs, benefits and impacts of each of the options, putting all such assessments out in public domain and at each stage involving the real stakeholders in decisive way and involving real public consultation process. Here it is the process that will decide what is the best option for a given need of the society, not some ready made set of answers from some “experts”. Such a framework for decision making is indeed a necessary implication of any democratic society.
Such a process would involve time, but it is never the case that society does not have time for such a process. To illustrate, it was about a decade back that Renuka dam was being debated as next water supply option for Delhi. It was 13 years back that the Memorandum of Understanding for Ken Betwa River Link was signed. It was a decade back that a SANDRP report advocated that Mumbai does not need either Damangaga Pinjal or any more dams for its water needs and this was supported by the then BMC officials.
If we had the will we could have deployed democratic process to find answers to these questions. But do we have the will?
SANDRP BlogIndia’s hydro generation AGAIN below 10% in 2017-18 In 2016-17, for the first time in independent India’s history, hydropower generation from large hydropower projects in India fell below 10% of total electricity generation. In 2017-18, for which the Central Electricity Authority figures have just became available, the trend has continued, with proportion of electricity produced by large hydropower projects going further down. https://sandrp.in/2018/05/31/indias-hydro-generation-again-below-10-in-2017-18/ (SANDRP, 31 May 2018)
CenterPower capacity addition slowest in FY18, renewables contribute 69% Power Capacity addition figures for 2017-18: The country witnessed its lowest capacity addition in power in 2017-18. Incremental addition in power capacity was only 17,200 Mw, the slowest since 2013-14. Renewable energy sources contributed 69 per cent to the capacity addition in the last fiscal, while coal-based thermal power accounted for only 27 per cent of the new capacity installed. Data from the Central Electricity Authority shows that the share of thermal power in an overall generation has fallen from 66.8 per cent in FY17 to 64.8 per cent in FY18. Last fiscal also saw the lowest net thermal power capacity addition since 2013-14 at 4200 Mw.
– In 2017-18, the country generated 1307 billion units of electricity, higher by 5.3 per cent over FY17. Thermal power, made up by coal, gas and diesel based units accounted for 79.7 per cent of the generation. Hydro power and imports from Bhutan comprised 10 per cent whereas renewable energy and nuclear power had a share of eight per cent and three per cent respectively. Plant Load Factor (PLF) of thermal power plants showed a marginal improvement from 59.8 per cent in FY17 to 60.7 per cent in FY18. Among thermal power units, gas-based stations continued to be crippled by below par capacity utilisation at 22.9 per cent during 2017-18. Around 11 per cent of the thermal power plants are gas-based. https://www.business-standard.com/article/economy-policy/power-capacity-addition-slowest-in-fy18-renewables-contribute-69-118052600622_1.html (Business Standard, 26 May 2018)
StudySmall hydel projects reducing fish numbers, diversity Small hydropower projects (SHPs) in the biodiversity hub of Western Ghats have not only altered the composition of freshwater fish communities but also reduced the number of species. This startling revelation has been made by a first-of-its-kind holistic study in India, which has evaluated the environmental impacts of SHPs.
– Scientists from Wildlife Conservation Society – India Program (WCS-India Program), National Centre for Biological Sciences (Bengaluru), University of Florida, Ashoka Trust for Research in Ecology and the Environment, and Foundation for Ecological Research Advocacy and Learning (FERAL), jointly conducted the study in the upper reaches of river Nethravathi, which is part of the Western Ghats biodiversity hotspot.
– The study showed that SHPs reduced the water flow immediately downstream of the dam and caused flow fluctuation when water is released back into the river after power generation, both of which impact fish assemblages (variety and abundance). Dammed streams were found to have altered fish composition and less number of species.
– The study revealed that SHPs have also caused a new problem: a surge in human-elephant conflict situations. Shishir Rao from WCS-India said the number of claims filed for elephant conflict compensation increased by 173% compared to the previous year in an area where an SHP was commissioned.
– Apart from the dam, the construction of associated structures such as large pipes, canals and transmission lines hinders the movement of elephants, forcing them to find new routes, increasing the incidence of conflict, observed the study.
– The study has also expressed concern over the increasing number of SHPs being built across rivers in Western Ghats and elsewhere. It cited the example of the 108-km-long Nethravathi, where 10 SHPs currently exist and 44 more have been proposed.
Based on study findings The Telegraph report reads “Small hydropower projects, long viewed as environment-friendly alternatives to large dams, themselves appear to threaten the diversity and populations of native freshwater fish, a study on river tributaries in the Western Ghats has suggested.
SikkimNHPC shows interests in Lanco Infratech’s 500 MW Teesta hydropower project NHPC Ltd is interested in acquiring Lanco Infratech’s 500 MW hydropower project on the Teesta river in Sikkim, said Balraj Joshi, chairman and managing director. Lanco Infratech Ltd is undergoing insolvency proceedings, and is among the 12 non-performing asset accounts referred to the National Company Law Tribunal by the Reserve Bank of India. “The Teesta-VI project is half completed and we are interested in reviving the project by participating in the expression of interest (EoI) process,” said Joshi. Joshi said NHPC cannot bid for the project under the current stipulation, with the public sector unit seeking a ‘solution’ from the government https://www.livemint.com/Industry/n1T5FVKf5LltAKsnSkePEN/NHPC-eyes-Lanco-Infratechs-500-MW-Teesta-hydropower-project.html (Live Mint, 28 May 2018)
In another significant development, a day after Krishak Mukti Sangram Samiti’s (KMSS) demand to terminate the construction work of 168 dams in Arunachal, NEEPCO has reportedly stopped the survey works for new projects in the State.KMSS leader Akhil Gogoi expressed concern over the cracks at 600 MW Kameng dam in the earthquake prone Arunachal on May 6. https://nenow.in/north-east-news/kmss-demands-termination-kameng-dam-construction.html (North East Now, 6 May 2018)
Meanwhile an earthquake has hit the state on June 2. A 5.2 magnitude earthquake was reported on June 2 morning in Tezu, Lohit district news agency ANI reported. According to USGS, the earthquake struck the north-eastern town at 11:16 am. No loss of lives or damage of properties have been reported so far.
Polavaram DamNGT notice to Centre on plea alleging obstruction in Godavari due to construction at Polavaram A plea before the NGT said environmental flow of Godavari river is being obstructed due to construction of a wall at Polavaram dam, leading to a devastating effect on marine wildlife and the livelihood of 8,000 fishermen. A bench headed by acting NGT chairperson Justice Jawad Rahim issued notices to the Polavaram Project Authority, union environment ministry, inter-ministerial monitoring committee, Central Inland Fisheries Institute, Andhra Pradesh, district collector of West Godavari and others while seeking their replies before July 31.
– Advocate Pragya Parijat Singh, appearing for the petitioner, told the bench that the environmental flow of the river was being obstructed due to construction of a diaphragm wall. She said the construction of such a wall has a devastating effect on marine wildlife in the river and the livelihood of 8,000 fishermen in and around the Polavaram area. “The water is getting dried up and thousands of fishermen are stranded due to loss of livelihood. Not just that, the ecology is getting disturbed as the aquatic life is suffering. All these are in clear abrogation of environmental clearance dated October 25, 2005. The dam construction at Polavaram involves building of a 1.5 metre thick concrete diaphragm wall up to depths from 40-120 metre below the river bed. The purpose of a diaphragm wall is to secure the river bed stability for withstanding water pressure across the dam. https://www.hindustantimes.com/india-news/ngt-notice-to-centre-on-plea-alleging-obstruction-in-godavari-due-to-construction-at-polavaram/story-HJlM1RIOkUVIzQ1z3ywm8M.html (Hindustan Times, 28 May 2018)
Sardar Sarovar DamNGT intervention sought to save dried up Narmada Environment and citizens groups in Bharuch have knocked the doors of the NGT seeking urgent directions for release of adequate water from the Sardar Sarovar dam into downstream of Narmada in wake of the rapidly drying up riverbed that could potentially result in an ecological disaster. NGT has issued notices to the Narmada Control Authority (NCA), the Sardar Sarovar Narmada Nigam Ltd (SSNNL) and the ministry of environment and forests, asking them to reply by July 30.
The notices were issued following a public interest application filed by the Narmada Pradushan Nivaran Samiti and the Bharuch Citizen Council (BCC). “The salinity ingress affects the river till about 72 km upstream from the river mouth at present, while tidal effects are felt as far up as 100 km upstream,” the petition stated. President, Bharuch Citizen Council, Jivraj Patel said, “We were forced to seek judicial intervention as the government has paid little heed to this serious issue, which we have raised time and again. The river must get its legitimate share of water, which needs to be determined based on fresh scientific studies instead of the arbitrary criteria of water requirement determined by SSNNL.” https://timesofindia.indiatimes.com/city/surat/ngt-intervention-sought-to-save-dried-up-narmada/articleshow/64376067.cms (The Times of India, 30 May 2018)
The plea claimed that drying up of river bed is causing immense damage to environment, agriculture and local industries. “Due to unavailability of surface water, water intensive and heavily polluting industries along the Narmada Estuary withdrew large quantities of water from bore wells aggravating water crisis in the region and accelerating rate of toxic sea water intrusion into the aquifers of the downstream area,” the plea claimed. https://timesofindia.indiatimes.com/india/plea-claims-inadequate-release-of-water-in-narmada-damaging-environment-ngt-issues-notice/articleshow/64384767.cms (The Times of India, 30 May 2018)
Pancheshwar DamGovt’s call draws flak Leaders of various opposition parties, voluntary organisations and public groups condemned the decisions taken by the Central and State Governments for the Pancheshwar dam project in Uttarakhand. They alleged that through such “criminal decisions”, attempts were being made to snatch away the legal rights of the poor people who will be affected by this hydro power project. These views were expressed at a mass convention organised here by the Chetna Andolan and Azadi Bachao Andolan on May 28, 2018. Leaders of the Congress, Uttarakhand Kranti Dal, Communist Party of India, CPI (Marxist) along with representatives of Chetna Andolan, Uttarakhand Mahil Manch, Mahakali Lok Sangathan (Pithoragarh) and various others were among those present in the meeting.
– Work on the Pancheswar project and all other such hydro power projects can be started after recognising the rights of the local communities and after securing approval from all the Gram Sabhas in the affected region. Without such measures, starting work on the project is akin to a criminal action by the Government, they alleged. http://www.dailypioneer.com/state-editions/dehradun/govts-call-on-pancheshwar-draws-flak.html (The Daily Pioneer, 28 May 2018)
It is true that public hearing is of no meaning without giving information about the dam, Dam company do not want that people know about the truth, ones public hearing happened then no say of people. A video with the people of Panv talla village can be seen on this link https://www.facebook.com/100012446893888/videos/422346131523613/
EIA public hearing sans environment issues The environmental public hearing for the Environmental Impact Assessment (EIA) of the inter-State Chanakha-Korata barrage across Penganga river organised by the Telangana Pollution Control Board at Pippalkuti village in Tamsi mandal on Thursday was all but that. Only one of the eight villagers who spoke at the meeting broached environment subject, not about the barrage but about the proposed balancing reservoir in his village. Joint Collector B. Sandhya Rani, who conducted the proceedings, clarified at the beginning of the meeting that it was dealing only with environmental aspects of Chanakha-Korata. http://www.thehindu.com/news/cities/Hyderabad/eia-public-hearing-sans-environment-issues/article23981550.ece (The Hindu, 24 May 2018)
Raising slogans, the farmers said several of their demands have not been met despite the fact that they were evicted in 1965. Samiti leaders said residents from 19 villages were evicted and nearly 394-hectare land was acquired by the state government.
“The work started in 1965 and the dam was completed by 1973. Nearly 1,203 farmers were affected. Out of these, only 340 farmer families were provided land in Maval and Khed areas. As many as 863 families have so far not received any land… We have been demanding justice for over 50 years,” said a samiti leader.
Collector Naval Kishore Ram said they have made every effort to ensure monsoon preparedness. “We have identified 84 villages in the district that are flood-prone and took necessary precautions there. These villages are spread out in Bhor, Baramati, Mulshi, Khed, Shirur, Junnar, Daund, Indapur, Haveli and Maval talukas,” Ram told TOI.
Once identified, residents of the dilapidated structures will be sent evacuation notices by the officials concerned. This includes areas that are most likely to be inundated when water is released from dams. Municipal bodies were told to clean up drains and culverts before the arrival of the monsoon.
Banavate said all the departments were briefed on the measures to be taken up. “A report has to be submitted in the first fortnight of June. Flood-line marking and various other measures need to be taken in coordination with the India Meteorological Department,” Banavate said.
Gujarat DOES THIS PROPOSAL, BIGGER THAN KALPSAR, HOLD ANY WATER? “Ahead of the 2019 polls, the BJP is all set to make a 4,900 sq km Rann Sarovar an electoral plank. While the idea has been floated by an industrialist known to be close to Prime Minister Narendra Modi, Jaysukhbhai Patel, managing director, Ajanta-Oreva group, if a recent well-attended meeting on Rann Sarovar in Gujarat Vidyapeeth is any indication, it has already been “discussed”, among others, with Modi, BJP chief Amit Shah, Gujarat chief minister Vijay Rupani, at least two ministers, and senior government officials.”
– This one would cost between Rs 50 and 100 crore. All that one needs to do is to dam the 1.26 km stretch of Hadakiya Creek, which joins Kutch, Saurashtra and the Gulf of Kutch at Surajbari, to ensure that the monsoon water, gathered into the Little Rann, does no “go waste” into the sea, into the Gulf… What you would have is the 4,900 sq km Rann Sarovar, filled with nine lakh cubic metres of sweet water, “equal to that of the Narmada dam”, to quote from the 90 page Gujarati booklet distributed at a recent Gujarat Vidyapeeth meeting… the book believes that the Rann Sarovar’s about 10 feet deep water, gathered from the mythical river Saraswati to Banas, Rupen, Kankavati, Brahmani, Macchu, Chandrabhaga, “in all 110 big and small rivers”, would become a major source irrigation, even as solving Saurashtra-Kutch’s drinking water problem, turning the adjoining areas into a “green belt.”… on advice from the Ministry of Water Resources, Government of India, the Central Salt and Marine Chemicals Research Institute (CSMCRI) has submitted a report Rann Sarovar, which is “broadly positive” about the proposal. https://www.counterview.net/2018/05/eye-on-2019-polls-tycoon-discusses-with.html (Counter View, 30 May 2018)
Uttar Pradeshरोहिन पर बना कच्चा बांध टूटाEven before beginning of monsoon season, there are reports of two dams getting damaged both in Maharajgunj district of Uttar Pradesh:
नौतनवा तहसील क्षेत्र के ग्राम सभा रतनपुर के समीप नहर में पानी छोड़ने के लिए रोहिन नदी के बीचो-बीच बनाया गया बांध पानी का दबाव न झेल पाने के कारण शुक्रवार की सुबह भरभरा कर बह गया। बताते चलें कि नौतनवा तहसील क्षेत्र के रतनपुर के समीप से होकर भारतीय क्षेत्र में प्रवेश करनी वाली रोहिन नदी के पानी को नहर में मोड़ने के लिए ¨सचाई विभाग ने ठेकेदार के माध्यम से मिट्टी का कच्चा बांध बनवाया था।
नहर में छोड़े गए इस पानी से लक्ष्मीपुर व नौतनवा ब्लाक के दर्जनों गांवों के किसान गर्मियों के सीजन में गेहूं की ¨सचाई करते हैं और बरसात आने से पहले ही बाढ़ के खतरे को भांपकर ¨सचाई विभाग 15 जून से पहले स्वयं बांध को तोड़वा देता है, लेकिन इस साल जून माह के पहले ही दिन शुक्रवार को जैसे ही रोहिन नदी में बाढ़ आई, पानी के दबाव को न झेल पाने के कारण नहर में पानी मोड़ने के लिए बना कच्चा बांध भरभरा कर बह गया। यहां बता दें कि बीते अगस्त 2005 में आई भीषण बाढ़ से रोहिन नदी पर नहर में पानी की आपूíत करने के लिए बना बीयर गेट टूट जाने के बाद से कोई स्थाई बांध नहीं बनाया गया।” https://www.jagran.com/uttar-pradesh/maharajganj-rawin-on-broken-raw-dams-18029624.html (Dainik Jagran, 1 June 2018)
पहली ही बारिश में टूटा महाव बांध नेपाल की पहाड़ियों पर हुई मूसलाधार बारिश के कारण शुक्रवार की दोपहर डेढ़ बजे देवघट्टी गांव के सामने महाव बांध करीब 10 मीटर कट गया। इससे आधा दर्जन गांवों में हड़कंप मच गया है। 1महाव नाले का उफनाया पानी देवघट्टी, शिकारगढ़, नरायनपुर, हरपुर आदि गांवों की ओर तेजी से बढ़ रहा है। महाव नाले के रौद्र रूप देख किसानों संग ग्रामीण भी सहम गए। किसानों का कहना है कि अभी बरसात बाकी है। महाव का अभी टूट जाना प्रशासन के दावों की पोल खोलकर रख रहा है। महाव के टूटने के बाद भी अब तक राहत व बचाव कार्य प्रशासन के तरफ से शुरू नहीं किया गया है। इसको लेकर ग्रामीणों में आक्रोश है। किसानों ने कहा कि यदि जिला प्रशासन इस पर गंभीर नहीं हुआ तो पिछले वर्ष के रिकार्ड भी टूट जाएंगे और सैकड़ों किसानों की खेती चौपट हो जाएगी।
11.89 करोड़ की लागत से हुआ था सिल्ट सफाई का काम : महाव को बाढ़ से बचाव के नाम पर इस साल भी धन की खूब बर्बादी हुई। नाले की सिल्ट सफाई के नाम पर सिंचाई विभाग ने 1.89 करोड़ की लागत से महाव की सफाई कराई,और दोनों किनारों की मरम्मत कराई थी। मानक के अनुसार महाव की सफाई व दोनों किनारों को मजबूत न बनाने के कारण ही पहली ही बरसात में सिंचाई विभाग के कार्यों की पोल खुल गई और आधा दर्जन गांवों के लोगों पर बाढ़ से चौतरफा घिरने का खतरा मंडराने लगा। https://epaper.jagran.com/ePaperArticle/02-jun-2018-edition-Maharajganj-page_7-7020-12882-271.html (Dainik Jagran, 2 June 2018)
Bhakra DamWater level low, Punjab, Rajasthan stares at paddy-sowing crisis With the Bhakra reservoir level going below 1,500 feet in May, nearly 50 feet lower than the same time last year, Punjab and Rajasthan are staring at an irrigation crisis during the paddy-sowing season. More worrying is the decline in water inflow since melting of snow in the glaciers is almost half of the normal this year. The water level at Bhakra on May 26, 2018 was recorded at 1,495 feet (MDDL 1462 ft) against 1,545 feet on the corresponding day in 2017. In the Ranjit Sagar dam, the water level is 1,636.6 feet, against 1,685 feet the same day last year. From May 20 to 25, the Bhakra level receded by 6 feet, while the same increased from 1539.33 feet to 15.44.9 feet (by 5.57 feet) last year. During the 2017-18 winter, there was 50 per cent of the last year’s snowfall. This estimate was prepared on the basis of satellite images by the National Remote Sensing Agency. https://www.hindustantimes.com/punjab/bhakra-water-level-low-punjab-stares-at-paddy-sowing-crisis/story-iltEx1qnGfnNCl1L7isAeJ.html (Hindustan Times, 28 May 2018)
WOW: Traditional fish consumers in Kashmir are largely inspired by folklore that fish be consumed in months which bear alphabet ‘R’. And hence, from May to August, fish is rarely consumed. “No one knows from where this logic came but our family has been following this logic of cooking fish for generations,” said Rabiya, a resident of nearby Maharaj Bazar.
Mission Kakatiya is the flagship program of government of Telangana, a state whose formation itself was catalysed by perceived regional injustices in water distribution for irrigation. Launched in 2014, the mission aims to harness benefits of tank irrigation by increasing command area, water supply for irrigation and opportunities for agriculture. Based on multiple field studies, this Highlight presents a midterm assessment of the project’s impact on increasing irrigated area, farmers’ incomes, groundwater recharge, opportunities for agriculture and associated
Tapi; GujaratHyacinth, garbage stifling river Tapi’s rejuvenation Tapi river, the perennial river which passes through the Diamond City, looks almost dead. Hyacinth is stifling recreation in the river starved of water because of scanty rainfall in its catchment areas in the past few years. Garbage has only made matters worse for the river which is gasping for breath. Tapi’s flowing capacity through the city has got reduced to three lakh cusecs from six lakh cusecs one-and-half-decade ago. A couple of years ago, Gujarat Government had sanctioned Rs957 crore for ‘Tapi sudhikaran’ project. All the sewer gates in the upstream of the river were to be closed during the phase-1 of the project. The fact is waste still continues to flow into the river from the 14 sewer gates. https://timesofindia.indiatimes.com/city/surat/hyacinth-garbage-stifling-river-tapis-rejuvenation/articleshow/64279662.cms (The Times of India, 23 May 2018)
The BMC has already sent notices to 25 cowsheds asking them to relocate. Meanwhile, washermen who use the dhobi ghats on the river bank, will be allowed to continue using them only provided they build a sewage treatment plant to treat the dirty water. This is the first time that the civic body is taking action against cowsheds and washermen near Dahisar river, though locals have made several complaints since 2015.
Dredging and concretisation work at Dahisar river halted, win for activists Members of River March a citizen movement has raised strong objections to the alleged dredging of the Dahisar river bed being carried out as well as the ongoing work to build a concrete wall along the edges inside the Sanjay Gandhi National Park (SGNP) forest area.
Environmentalist Stalin D said that putting concrete in the river is as good as killing the river. “The entire work is a matter of concern and on what basis was it sanctioned needs to be investigated,” he said.
Urban Conservationist Vikram Pawar who is part of the River March movement also visited the site and said, “The approach taken by the forest department should have been to holistically study the entire catchment area and carry out analysis of the causes of flooding in 2017 along with experts in this field and then initiate work rather than simply deciding to build concrete banks and dredge it,” he said.
A senior SGNP official said that the work being carried out was for betterment of the river and it was planned after the flooding during heavy rains on August 29 that caused extensive damage to not only the park but also left several offices flooded. “The funds came in late and hence the work had to be initiated late. However since few citizens and experts along with them raised the issue we stopped the concretisation work and are restoring the bed too.” said the official.
Himachal PradeshSnow cover declines in major river basins Rapidly changing climate is degrading the snow cover of Himalayan rivers originating in Himachal Pradesh, according to a recent study by the Himachal Pradesh state council for science technology and environment’s state centre for climatic change. The centre for climatic change used satellite data of 2017- 2018 to estimate snow cover in these rivers. The data was compared with that of average values estimated during the period 2016-2017. Major rivers like Chenab, Beas, Parvati, Baspa, Spiti, Ravi,Sutlej and their perennial tributaries originating from Himalayas depend upon the seasonal snow cover for their discharge. Seasonal snow in the Himalayan rivers play a major role in controlling their hydrology.
– Analytical data shows that the Chenab basin, which is located on north of Pir Panjal Range, behaves differently in comparison with the southern basins for winter precipitation. The snow melt has been more on the southern portion of Himalayas compared to the northern side of Pir Panjal Range. The Ravi river basin, which is on the southern side of Pir Panjal Range, also shows less snowfall area during 2017- 2018. The Chenab basin received more snow between November and December while the snow cover declined December onwards. “There is an overall reduction in the area under seasonal snow cover during the winters of 2017-18 in comparison to the area as observed during 2010-16 period in Himachal Himalaya” said Kunal Satyarthi, Member Secretary HIMCOSTE. The research showed that the river basins experienced more snow during December and November whereas the snow cover declined from January to March of 2017-2018.
– The northern basins of Chenab and Sutlej show a reduction of snow cover area in the month of October by 35% and 37% respectively. In the winter, the studies showed there is a marginal reduction in the months of January and February by 2% each in Chenab basin and 9% and 6% respectively in Sutlej basin during the same period, while in November and December it showed a positive trend with 16% and 10% increase in Chenab basin and 14% and 48% in Satluj basin. The Ravi and Beas basins which are on the southern side of the Pir Panjal range, showed negative trends in the months of October, January, February and March. The reduction in snow cover in these months was 67%, 51%, 30% and 16% respectively in the Ravi basin while the figures for the Beas basin were 24%, 28%, 19% and 8%. In November and December the snow cover showed an increase in area by 20% and 43% in the Ravi basin and 5% and 40% in the Beas basin. https://www.hindustantimes.com/india-news/impact-of-climate-change-snow-cover-declines-in-major-river-basins-of-himachal-pradesh/story-TFn5Lp0OdetpqqJgrxI4iN.html (The Hindustan Times, 28 May 2018)
MaharashtraNGT orders closure of 350 polluting units in Taloja Bringing huge relief to fishermen and people living along Kasadi river and Panvel creek, NGT on May 30 has ordered immediate closure of 350 polluting industries in Navi Mumbai’s Taloja MIDC area till further orders:
“The NGT’s principal bench in Delhi also directed the Taloja MIDC Common Effluent Treatment Plant (CETP) managers to deposit Rs 5 crore as penalty in addition to the Rs 5 crore asked to be deposited last month for failing to contain pollution of the river.
Taloja, the most-polluting CETP in the state, has been categorised as a non-performing plant by the Maharashtra Pollution Control Board (MPCB). It has been recording very high levels of BOD (Biochemical oxygen demand) and COD (Chemical Oxygen Demand), which are wastewater quality indicators. In fact, the BOD and COD levels recorded are over ten times the permissible limits. Incidentally, according to a recent Central Pollution Control Board study, Maharashtra has the most polluted rivers in the country.
A corporator from Panvel, Arvind Mhatre, had filed a petition with NGT last year pointing out the air, water and land pollution caused by MIDC units in the Taloja belt in Raigad district. The industries release their effluents to the CETP, which processes it and releases it to the creek. While leakages in pipelines to the CETP has polluted Kasadi, some units also released effluents directly into the river.
Following his petition, when the NGT ordered inspections, samples of water from the CETP inlet and outlet were found to be highly polluted. Last month, the NGT bench directed the CETP managers to commence work on upgrading the plant within a month.
A major reason for the poor performance of the CETP is that it’s virtually nobody’s child now. The state government and MPCB have been trying to get more funding from the units to upgrade the CETP. The MPCB had ordered takeover of the CETP by MIDC, but there’ve been delays in bid finalisation for selecting a partner to run the plant. As a result, the CETP is currently under an administrator deputed by the Panvel cooperative registrar’s office. This has also stalled the upgrade of the CETP to expand its capacity.” https://timesofindia.indiatimes.com/city/mumbai/ngt-orders-closure-of-350-polluting-units-in-taloja/articleshow/64391832.cms (The Times of India, 31 May 2018)
GANGA Char Dham All Weather Road Project:Your permissions are not in order, stop muck dumping in valley, NGT tells Centre NGT has expressed dissatisfaction with the Centre’s execution of Chardham all-weather highway in Uttarakhand without having “permissions in order” related to forest clearances and categorically directed it to stop muck dumping in the river valley. It also sought a detailed list of all 480 sites designated for dumping muck as part of the 900-km long project and directed Centre to submit clearances obtained to dump muck, which also involves forest land.
It is very sad that Government itself exploiting the loopholes!“This entire Chardham project area falls in the catchment of Ganga-Bhagirathi, Yamuna, Alaknanda and Mandakini river valleys where the widening up to 12-24 metre requires cutting of thousands of tress, excavation of hills, dumping of muck, blasting of rocks and movement of heavy machineries in the highly sensitive terrain of Himalayas.
There was no information published for any Environmental Impact Assesment (EIA) regarding this project. It is nowhere found in the public domain whether the EIA of this massive project which costs approximately Rs 12,000 crores was conducted or not. The petitioner came to know about the execution of this project after large-scale cutting of the trees on the different segments of this Chardham route (Rishikesh to Gangotri, Dharasu to Yamunotri, Rishikesh to Kedarnath and Badrinath) began in December 2017. https://www.newsclick.in/government-divides-900-km-long-chardham-project-52-parts-bypass-environmental-clearances (The Times of India, 2 June 2018)
– Cleaning of the Ganga was a poll plank for the present ruling coalition. However, the schemes are stuck at various levels with state governments. Its other programme of river linking remains a non-starter. Some companies (the Vedanta group is one) have been given some areas of the river for maintenance. Rivers that are tributaries to the Ganga are also being tackled. “There are 40 tributaries of Ganga and we are working to clean these,” Gadkari said.
– One of these is planned in Delhi. “The work on cleaning the Yamuna’s water is going slow and I am concerned. I have met the (Delhi) chief minister and Lt Governor three times about it,” he said.
– As for solid waste management along the rivers, he admits to lacunae. “The work will start in cities by the side of the Ganga. Operational maintenance of such projects has been given to the private sector and technology will be used to monitor it.”
– Gadkari says close to Rs 200 billion has been sanctioned for 193 projects on new sewage treatment plant — in Uttarakhand, Uttar Pradesh, Bihar, Jharkhand and West Bengal. Of the 193 projects identified in 2014, only 20 are complete. The highest amount sanctioned is to one of the most polluting states, UP, of Rs 52.4 billion. Followed by Bihar with Rs 45.5 billion for creating sewage treatment plants. So far, states have spent Rs 34.6 billion, at Rs 8.6 billion a year. “This government will be definitely judged by the work it did for the Ganga. No other government had ever dedicated so much fund and schemes and attention to the Ganga, with an almost impossible target. We know the public will not forgive us if we fail to clean the Ganga, especially after so much gung ho,” said a senior in the Bharatiya Janata Party (BJP).
Bihar Ganga Riverfront Development Project delayed by 6 months “The World Bank-funded Ganga riverfront development project has been delayed for the second time. The initial deadline for this dream project of CM Nitish Kumar was June 2016, which was revised to June this year and, if officials are to be believed, the deadline to complete the project will be extended by another six months. The project cost is also likely to be revised.
– The riverfront project entails development of 6.6km-long and 15ft-wide walkway along 20 ghats in the city which will have amenities like decorative street lamps, public lavatories, 500 seating benches and green cover. The CM had laid the foundation for the project on February 12, 2014.
– Citing reasons for delay in the project, the official said, “We usually stop the work during monsoon due to flood threat. Land acquisition is another big hurdle. However, required land has been acquired for the project.” He added the original expenditure of the project, which was pegged at Rs 254 crore, would be revised.
Uttar Pradesh In Varanasi Ganga water levels have receded to the LOWEST EVER RECORDEDThere is NOT A SINGLE DROP of Ganga water, all that is reaching Varanasi is sewage allege saints. “From ministers to businessmen, everybody has peddled on these banks. Many schemes were announced to ensure the river is cleaned, but none of it materialised because of a complex web of politics.
Water was released in the river when french president Macron visited the banks of Kashi but even that has dried up now. The district magistrate has also written a letter to the authorities for the same.
Dr BD Tripathi, Chairman of Mahamana Malaviya Research Centre for Ganga at BHU says, “three sewage treatment plants were set up in 1986. Thirty years back, there was 200 MLD of sewage discharge, now its 350 MLD. In addition 75 MLD industrial pollution is falling in the river. They could not install a fourth treatment plants.” https://www.thequint.com/videos/news-videos/people-of-varanasi-request-to-pm-modi-to-clean-river-ganga (Quint, 30 May 2018)
Land row stalls Ganga water plan for Raj Nagar Extension A delay in identifying land for setting a plant to treat Ganga water to be supplied to households in Raj Nagar Extension has cast a cloud of uncertainty on when the project would be complete.
Officials in UP Jal Nigam said they had written at least three letters to Ghaziabad Municipal Corporation and Ghaziabad Development Authority to make land available for project but the missives have not elicited any response.
The officials said that only after land is identified, they can prepare a detailed project report and lay down the deadline for its completion. “Last month, we had presented a feasibility report to GMC mentioning a tentative cost for implementing the project. It was estimated at around Rs 820 crore,” said GP Shukla, chief engineer in the Jal Nigam. “As for land, we had specifically spelt out the need for three acres for the plant and some additional land for laying pipelines from Murad Nagar to Raj Nagar Extension, where we propose to set up the treatment plant,” he added.
The chief engineer said it would take at least two years to implement the project. Municipal commissioner CP Singh said there was no dearth of land, adding they planned to start the process of identifying it in a meeting of corporation board.
NationalMap of dams on Ganga River This map shows 39 dam and barrage on Ganges River System from Tehri to Farakka. The major rivers are- Ganga, Sarda, Gandaki, Koshi, Yamuna, Ken, Betwa, Sone, Mayurakshi, Damador. How the rivers are surviving!
YAMUNA DelhiIWAI approves Rs. 55 crore for Taxi project on Yamuna A pilot ferry service in Yamuna is reported to be started after the monsoon and regular services are set to begin by this year end. Though it will be limited to only a few kilometres stretch from Tronica City in Ghaziabad to Sonia Vihar in Delhi, this service is likely to emerge as a major tourist attraction.
Inland Waterways Authority of India (IWAI) has approved Rs 7.55 crore for the water taxi project, which involves setting up of three floating jetties and ancillary facilities for tourists to reach the boarding and deboarding points. Last week, IWAI officials told shipping minister Nitin Gadkari that no construction will be carried out for jetties as per the direction of the National Green Tribunal (NGT). TOI heaps insults over NGT, EIA process and Principle committee, assuming all boxes will be ticked by year end. https://timesofindia.indiatimes.com/city/delhi/soon-take-a-ferry-ride-on-yamuna/articleshow/64376038.cms (The Times of India, 30 May 2018)
Large scale illegal sand mining in Ghaghara river (Basti) is causing significant damage to embankments thus increasing the risk of flood during monsoon. घाघरा नदी के किनारे माझा में बालू खनन बड़े पैमाने पर हो रहा है। कुछ जगह वैध खनन हो रहा है तो कई जगह अवैध। बालू के अनियोजित खनन से कलवारी से लेकर दुबौलिया तक तकरीबन 30 किलोमीटर की लंबाई में जगह-जगह तटबंधों की सुरक्षा को खतरा उत्पन्न हो गया है। इस संबंध में बाढ़ खंड द्वारा जिला प्रशासन को सूचित भी किया जा चुका है उसके बाद भी खनन पर अंकुश नहीं लग रहा है।
बाढ़ के दिनों में नदी का बहाव सीधा तटबंध की तरफ हो जाने से बंधे संवेदनशील हो जाते हैं जिससे उनकी सुरक्षा को खतरा पैदा हो जाता है। पिछले वर्ष कुदरहा ब्लाक के पिपरपाती तथा दुबौलिया ब्लाक के कटरिया-चांदपुर में स्थिति काफी बिगड़ गई थी। किसी तरह बाढ़ खंड ने स्थिति पर नियंत्रण किया। यह हाल तो तब था जब बालू का खनन नहीं हो रहा था। इस बार जिस तरह से बालू खनन हो रहा है उससे बंधे कितना सुरक्षित रह पाएंगे यह अपने आप में बड़ा सवाल है। https://www.jagran.com/uttar-pradesh/basti-threat-to-safety-of-embankments-with-sand-mining-18028919.html (Dainik Jagran, 1 June 2018)
WET LANDS
MaharashtraGovt formally notifies 16.9 sq km Thane Creek Flamingo Sanctuary The state government has formally notified 16.9 sq km on the western side of the Thane creek as a dedicated flamingo sanctuary. In addition to over 40,000 flamingoes that call the creek home for six months, the sanctuary also hosts a variety of migratory birds including the sand plover and Black-tailed Godwits. The sanctuary, proposed as one of the mitigation measures for the Mumbai Trans-Harbour Link will come under the Mumbai Mangrove Conservation Unit. The flamingo sanctuary is spread on the western side of Thane creek across Mulund (143 ha), Bhandup (95 ha), Kanjurmarg (265 ha), Vikhroli (257 ha) and Mandale (31 ha). It will be under the Mumbai Mangrove Conservation Unit. It was proposed as one of the mitigation measures for the MTHL. https://timesofindia.indiatimes.com/city/mumbai/maharashtra-govt-formally-notifes-16-9-sq-km-thane-creek-flamingo-sanctuary/articleshow/64261447.cms (The Times of India, 21 May 2018)
“The local activists have again written to Cidco and the Wetlands Body Committee about the latest dumping. Senior Cidco officer in-charge of Kharghar, S Rokade said, “The area (between sectors 19 and 18) is a low-lying one, but no pond is earmarked there. So the residents will have to talk to the Cidco planning department about it.” Singh replied, “We have been seeing the pond at the site for nearly 15 years even if it is not marked.”” https://timesofindia.indiatimes.com/city/navi-mumbai/setback-for-kharghar-residents-as-fresh-debris-dumped-near-pond/articleshow/64389950.cms (The Times of India, 30 May 2018)
HyderabadAlgae chokes Hyderabad’s drinking water lifelines, sparks alarm Osmansagar and Himayatsagar, two major drinking water sources for twin cities of Hyderabad and Secunderabad, are now infested with algal growth. The presence of unwanted vegetation indicates that the drinking water sources are gradually losing their pristine environment.
– A thick blanket of weeds and algae has formed in the shores of the lakes as water has been impounded for long.
– Hyderabad Metropolitan Water Supply and Sewerage Board (HMWSSB), which controls the lakes, has not released water downstream in the last 18 months.
– The reservoirs have been losing water due to evaporation. It increases during summer. About one MGD of water is lost in evaporation.- Lack of outflow has led to stagnation of water in the lakes resulting in algal bloom. Research studies have revealed that the water quality in the two lakes has been deteriorating over the years.
– Since their construction about 90 years ago, Osmansagar and Himayatsagar reservoirs have been catering to the needs to lakhs of people.
Op-EdWho pays to save Jakkur lake?by Isher Judge AhluwaliaInteresting case of how Jakkur lake in Yelahanka area in NE Bangalore got rejuvenated starting around 2005 through a 10 MLD STP and constructed wetland. Come KPCL with a 370 MW Gas based Thermal Power plant, needing 10 MLD of treated sewage, it may jeopardise the whole success story. But if KPCL were to cool the used water and recycle it to the lake, the lake may continue to function.http://indianexpress.com/article/opinion/columns/jakkur-lake-bengaluru-water-pollution-wastewater-management-5196201/ (The Indian Express, 30 May 2018)
On May 17, the Bombay high court (HC)-appointed wetland grievance committee has initiated an enquiry into the matter after citizens submitted satellite images that show 75% of the water body has been reclaimed. As per report, dumping of construction debris has destroyed three-fourth of Murbi Talav, a four-acre pond located in the Mumbai Metropolitan Region (MMR) between sector 18 and 19 at Kharghar, Navi Mumbai, over a period of three years. Local residents claim the area has always been a wetland. A much larger water body in sector 17 located a few hundred metres away from Murbi provides high tide saline water to this pond through channels present underneath these residential buildings, said Naresh Singh, resident of the area since 2008 and another member of Abhivyakti.
Member of the HC wetland grievance committee said the matter was discussed earlier this month. “We have issued directions to CIDCO to submit a report within this month about how the water body is being reclaimed. We are also checking whether this area is a wetland, and ground surveys for the same are underway,” said JR Gowda, member secretary of the committee. https://www.hindustantimes.com/mumbai-news/debris-dumping-shrinks-huge-pond-in-navi-mumbai-by-75/story-gzG6usl9lVjdrMs0KvAOGJ.html (Hindustan Times, 17 May 2018)
Important, useful on Groundwater Management: Wells, not dams, have been the temples of modern India.
In order to make access to water adequate and equitable, we must shift our focus from water sources to water resources. Both science, and community participation and cooperation, are key to addressing our water woes.
A growing demand for water implies the need for an improved understanding of our resources, and the ability to manage that demand in an equitable and sustainable way.
India is a groundwater economy. At 260 cubic km per year, our country is the highest user of groundwater in the world–we use 25 percent of all groundwater extracted globally, ahead of USA and China.
When we think of water however, our brains have been programmed to think of large dams and rivers, and not wells. This, despite the fact that India has at least four crore irrigation wells and millions of farmers who use well water in agriculture.
This article challenges the analysis and arguments presented in Tushaar Shah et al (2017). It shows on the basis of empirical data that solar photovoltaic systems for well irrigation are economically unviable, and offering high capital subsidies for such systems and then guaranteeing a higher feed-in-tariff for the electricity produced than the market price would ruin the state electricity utilities and distort energy markets, while incentivising farmers to pump excess groundwater to raise water-inefficient crops and sell the excess water for a profit. https://www.epw.in/journal/2018/21/special-articles/solar-irrigation-cooperatives.html (EPW, 26 May 2018)
MaharashtraDrought-prone Yavatmal district sets example as farmers construct 6,000 ‘farm pools’ The construction of over 6,000 ‘farm pools’ by cultivators to meet the irrigation demand in Maharashtra’s drought-prone Yavatmal has set an example for other districts. A farm pool or pond is dug out to harvest rainwater. With the digging of these pools, around 6,000 hectares of land will get “protected irrigation”, raising hopes of a better rabi crop.
– However, executing the farm pool work in a scattered manner increased the expenditure due to unnecessary movement of machinery from one place to another. To overcome this difficulty, farmers were encouraged to create farm pools in a cluster manner. 10,518 farmers in the district applied online for the scheme, and 8,355 applications were found to be technically eligible. Out of these, the construction of around 6,200 farm pools has been completed in about six months. https://www.firstpost.com/india/maharashtras-drought-prone-yavatmal-district-sets-example-as-farmers-construct-6000-farm-pools-4484313.html (First Post, 27 May 2018)
Also see,Maharashtra groundwater level dips in 71 of state talukas Maharashtra’s Groundwater Survey and Development Agency (GSDA) survey:… “A whopping 71% of the state’s 353 talukas reported a drop of more than a metre in the ground water level by March 2018 compared to a 5-year average. By now (May 2018) two months later, the water level is expected to be even lower.
GSDA compared the ground water level in 3,920 observation wells in the state in March with the average water level in the last five years.
Groundwater depletion was highest in the arid Vidarbha and Marathwada regions, the survey found. As many as 40% of the 252 talukas which reported the decline in ground water level are located in Vidarbha and 22% in Marathwada.
The GSDA survey also found that the ground water level had fallen by more than a metre in 10,521 villages and by 1-2 metres in 6,896 villages. It had declined by 2-3 metres in 2,649 villages and by more than 3 metres in 976 villages.
Officials say a decline up to a metre in groundwater level is not alarming. However, experts say it is a cause for concern and indicates that groundwater is being extracted at a faster rate than it is being replenished. “The sample is very small so the decline in ground water level is likely to be more intense than reflected in the data,” says water expert Pradeep Purandare, formerly with the Water and Land Management Institute.
SANDRP BlogIndia’s Summer of Water Crisis in 2018 With the rise in temperature, several parts of country have started facing severe water crisis. The rural areas and urban settlements seem equally affected. The report also suggest the mismanagement of water sources, failure in treatment of water pollution has more role in aggravating the situation than the natural reasons. https://sandrp.in/2018/05/30/indias-summer-of-water-crisis-in-2018/ (SANDRP, 30 May 2018)
Sterlite ProtestGovt orders permanent closure of Sterlite plantVedanta’s Thoothukudi copper unit closed down permanently for causing water and air pollution and violating environmental norms:
“The Tamil Nadu government on May 28 ordered the closure of the Sterlite Copper factory in Thoothukudi in the back drop of last week violent agitation led by residents who claim the smelter has caused widespread pollution of air and water in the southern city.
The govt order endorsed the Tamil Nadu Pollution Control Board’s directive last week to close the unit citing constitutional provisions to “protect and improve the environment,” and “in larger public interest.”
Within an hour of the order announced on Monday afternoon, district officials of Thoothukudi, headed by Collector Sandeep Nanduri, arrived at the plant to seal the premises.
– Legal experts believe the state’s move may not stand the scrutiny of higher courts.
– PIL filed by Fatima Babu, a lecturer and member of the MDMK, based in Thoothukudi, had won a stay at the Madras High Court, stalling the proposed expansion of the plant.
– The court delivered an interim injunction while directing the central government to renew the environmental clearance of the factory only after a public hearing, which is to be conducted before September 23, 2018.
– Social activists tracking the longdrawn crusade against the copper factory are of the view that the prospect of a further legal battle is clear and present. “It is very likely that the company will move the Supreme Court against the closure order because the case against rejection of the consent to operate licence (pollution control board had refused to renew a licence for the plant) is going on at the appellate authority,” said V Ramasubbu, one of the litigants against Sterlite in earlier cases. https://economictimes.indiatimes.com/news/politics-and-nation/tamil-nadu-government-orders-permanent-closure-of-sterlite-plant-in-tuticorin/articleshow/64355730.cms (The Economic Times, 29 May 2018)
Op-EdWhy shutting down Sterlite’s polluting copper factory in Thoothukudi is only a small victory by Nityanand Jayaraman: The Tamil Nadu government’s order may not survive a legal challenge unless it’s strengthened by citing the company’s gross illegalities. For 22 years, the Tamil Nadu Pollution Control board and the central environment ministry have colluded with Sterlite, allowing it to operate an under-designed factory. In its order of April 9, 2018 rejecting the renewal of Sterlite’s Consent to Operate, the board presented pathetically weak reasons to support its decision. Instead of citing Sterlite’s serious legal violations, the pollution regulator chose easily reparable ones. The reason: both the board and the environment ministry are party to the company’s serious violations. In Sterlite’s case too, getting it to clean up the contaminated environment, including the heavily polluted factory premises, compensate the affected people or rehabilitate the workers who lost jobs for no fault of theirs, will take some doing.
– So, unless the Tamil Nadu government follows up its order with a reasoned justification, based on science and evidence, for the factory’s closure, it would be betraying Thoothukudi’s residents. The opposition parties need to push for the Assembly to pass a unanimous resolution backing the government’s decision to shut down the Sterlite factory as the logical step to take for the state’s well-being. https://scroll.in/article/880637/why-shutting-down-sterlites-polluting-copper-factory-in-thoothukudi-is-only-a-small-victory
GujaratACB spots leaks in water conservation efforts ACB officials said that in past two months, they have registered nine cases related to water management in Gujarat. In the same period, the agency also conducted a major search operation at the headquarters of Gujarat Land Development Corporation (GLDC) and found a total of Rs 56.5 lakh cash — the biggest haul from a government office in an ACB case. It started with a case filed by Bhuj office of ACB on March 24 against two officials of water conservation department and a private contractor where the trio showed farm ponds dug on paper in Rapar taluka and incurred loss of Rs 2 lakh to the government exchequer. The same modus operandi came to light when ACB filed four cases in Valsad district on May 24 where collectively the government exchequer incurred loss of Rs 31.79 lakh by not making 35 farm ponds in four different villages of the district and still showing their completion on paper. https://timesofindia.indiatimes.com/city/ahmedabad/acb-spots-leaks-in-water-conservation-efforts/articleshow/64346075.cms (The Times of India, 28 May 2018)
Shimla Water CrisisResidents warn tourist about ongoing water crisisIs it Shimla’s WORST WATER CRISIS EVER: ” Residents of the state capital have taken to the social media to warn tourists against visiting the city and advising them to reschedule their itinerary in the wake of the worst-ever water crisis.
“Please do not consume our water, if we get it in days to come. There is no water for the past one week. Please plan your trip to some other destination”, reads an advisory posted by a local resident on the social media.
They urged the tourists to take precautions while eating at dhabas and restaurants as water is not available for cooking and unsafe water is being used instead.
Some of the hotels have posted messages on their social networking sites saying, “Please do not come to Shimla and those who have made advance booking in our hotel will get the full refund if they wish to make a cancellation request.”
The Tourism Industry Stakeholders’ Association (TISA) and the Shimla Hotel and Restaurant Association (SHRA) is contemplating resorting to “No service, no bill” policy.
According to information, the price of a water tanker (12,000 litre) has gone up from Rs 2,500 to Rs 8,000.
MK Seth said occupancy in hotels was about 80-90 per cent at present. Tourists are making frantic calls and asking for booking cancellation. If “false propaganda” was not stopped, tourist inflow would be badly affected, he added.
With the beginning of summer vacation in schools in the plains from June 1, tourists will make a beeline for the city to get a relief from the scorching heat. Although water problem is not a new for Shimla, it is for the first time that people are not getting it even on the seventh or the eight day. ” http://www.tribuneindia.com/news/himachal/do-not-consume-our-water-locals-to-tourists/596463.html (The Tribune, 29 May 2018)
Shimla residents continue to face acute water crisis:“The Municipal Corporation is distributing water under police protection. Over 70 police personnel have been specifically deployed to deal with the situation in the water-deprived hill-station.
– The demand for bottled water has increased by 50 to 60 per cent due to water scarcity in Shimla.
– The tourism industry in Himachal Pradesh’s Shimla has also been massively hit as tourists are cancelling their visits to the hill-station.
– The Shimla administration has also postponed a major tourist attraction, International Shimla Summer Festival, scheduled from June 1 to 5 due to the scarcity of water in the town.
– On May 30, Himachal Pradesh High Court directed the Shimla Municipal Corporation not to distribute water through tankers. The court has also directed the state government and the Shimla Municipal Corporation to not allow any water supply for building construction and car washing.
– The high court, which on May 29, ordered stringent water-saving measures, has now asked Shimla Municipal Corporation to disconnect water supply to hotels which do not pay their pending water charges within two days.
– High Court also ordered a halt to construction activity and washing cars in the core areas of the city for the next few days. It also directed that no water tankers will be sent to individuals, even if they are ministers, bureaucrats or judges. Only the governor and the chief minister were exempted from the order.
– Protests over the crisis continued in the city with Congress activists blocking some roads. Local residents also expressed their anger on social media in the last few days, with some asking tourists to stay away from the hill town.
– Shimla authorities also deployed 27 tankers to distribute 2.25 lakh litres of water at 63 points in the city. The total availability of water from all sources in Shimla now is 21.75 million litres per day against a requirement of 32-35 MLD.
Op-EdWater harvesting is the answer, not dependence on the state by Sanjay Austa: What Shimla’s residents must do is give up their dependency on the government, and begin to follow water conservation practices like harvesting and recycling water, which have so far been adopted by a minuscule portion of the population.
– The several hotels in the tourist town are loath to invest in water-saving efforts too. For instance, on paper, its compulsory for all Shimla hotels to harvest rainwater. But to avoid the costs of a filtration plant, most hotels fill their rainwater tanks with municipal water. Very few hotels have recycling plants.
– Finally, it is also a question of priorities. In a drive to make Shimla look pretty, there is a rule that the roof of every house must be painted either red or green. Non-compliance leads to a fine, so everyone complies. It costs about Rs 30,000 to paint a roof, and half of that to install a rainwater harvesting system. The residents of Shimla, the hotels who profit from the tourists who visit the town, and the state government need to get their priorities right. https://scroll.in/article/881021/water-woes-in-shimla-underline-the-need-for-water-harvesting (Scroll, 1 June 208)
The advocacy for a long distance, highly capital, energy and carbon footprint heavy centralised option of mega water supply from Kol Dam for Shimla is clearly misplaced. Its clear the author has no value for local options from rain to local water bodies to treated sewage, leading to use of uncontaminated local sources. Some useful information:
Shimla city has supply from five major water sources — Gumma, Giri, Ashwini Khad, Churat and Seog. The overall installed capacity is 65 million litres per da (MLD) while the demand is approximately 45 MLD. Despite the higher installed capacity, the city never gets more than 35 MLD as average throughout the year. A lot of the water leaks out during pumping and distribution.
The other major problem is that Ashwini Khad, a major source, was contaminated in 2005 when a sewage treatment plant (STP) was constructed in Malyana, just 5 km upstream. Since then, there have been periodic breakouts of hepatitis. This source met the requirements of a quarter of the city’s population and its near-closure cannot be compensated even by an increase from Giri. At present, not more than 2-3 MLD of water is being pumped into the city from Ashwini Khad.
The growth of the city is massive. From a population of 30,000, now the city has over 2,00,000 people with over 1 lakh entering and leaving the city every day. The city also has more than 40 lakh tourists visiting every year.
Climate change and its impact seem to be profound on the Shimla city water supply system. The winters were, by and large, dry; the rainfall was 80 per cent deficient. It rained in March and April. But the retention of water in these months is very less. The sources of water have gone 50 per cent below the average. The city is experiencing less snow and more rain, but of less duration. http://www.tribuneindia.com/news/comment/thirsting-for-water-in-shimla/596349.html (The Tribune, 29 May 2018)
– In 2016, the Central Ground Water Board conducted an aquifer mapping study in Saja and Bemetara blocks in the district to understand the groundwater potential in the area and recommended groundwater recharging through rainwater harvesting at places where the water level is more than five metres in the post-monsoon period. As per the CGWB officials, the geological terrain of the Keshtara panchayat is ideal for groundwater recharge with harvested rainwater due to the presence of shale, dolomite and limestone rocks in the region. But so far, no work has been done to implement it.
– On May 1, 2018, the Bemetara district administration invited India Water Portal to suggest ways to improve the existing water sector situation. The suggestions included:
* Implementation of block-wise aquifer management plans as recommended by the CGWB.
* Implementation of direct borewell recharge wherever possible to improve the availability of water for drinking and irrigation needs.
* Repairing existing but unused water structures.
Improving community participation in managing water resources through competitions and rewards.
Bemetara district administration agreed on all but the direct borewell recharge method on the agricultural sites because, according to the deputy director of the department of irrigation, Vinod Verma, the state government feels that there is a threat of groundwater contamination due to pesticide use by farmers. http://www.indiawaterportal.org/articles/not-enough-water-villagers-look-solution (India Water Portal, 25 May 2018)
IMDMonsoon Hits Kerala 3 Days Before Schedule The Southwest Monsoon hit Kerala on May 29, three days before its scheduled arrival, the India Meteorological Department said. This is the earliest start to the monsoon, the lifeblood of India’s $2 trillion economy, since 2011. As per the weather office, if 60 per cent of the available 14 stations –Minicoy, Amini, Thiruvananthapuram, Punalur, Kollam, Allapuzha, Kottayam, Kochi, Thrissur, Kozhikode, Thalassery, Kannur, Kudulu and Mangalore — report 2.5 mm or more rainfall for two consecutive days, the onset of monsoon over Kerala can be declared on the second day. This is one of the main parameters for declaring monsoon arrival. Further, the westerly winds must be up to 15,000 feet above main sea level and outgoing long-wave radiation less than 200 wm-2 (watt per square metre). The necessary parameters were met following which the onset of monsoon over Kerala was announced, Mritunjay Mohapatra, Additional Director General, IMD was quoted as saying. https://www.ndtv.com/kerala-news/3-days-before-its-scheduled-arrival-southwest-monsoon-hits-kerala-imd-1859219?pfrom=home-topstories (NDTV, 29 May 2018)
On May 29, 2018, the southwest monsoon has further advanced into remaining parts of southeast Arabian Sea, Comorin – Maldives area, entire Lakshadweep, most parts of Kerala, some parts of Tamil Nadu and some more parts of southwest, central and northeast Bay of Bengal. Thus the southwest monsoon has set in over Kerala, today, the 29th May 2018, 3 days ahead of its normal date. http://www.imd.gov.in/pages/press_release_view.php?ff=20180529_pr_263 (IMD, Press Release, 29 May 2018)
Shutters of dams raised as heavy rains continueIn the wake of increasing water level due to continuing torrential rain since May 27 evening, the district administration on May 30 issued an alert to the people residing along the banks of the rivers:
“Low-lying areas in the district were inundated and water level in Muvattupuzha and Periyar rivers is rising as shutters of Malankara and Bhoothathankettu dams were opened. Five shutters of Bhoothathankettu dam were partially opened by one metre. Normally, the irrigation department opens dam shutters only by June when monsoon intensifies. However, this year water level in the dam increased even during the summer rains.
The temporary sand bund at Kanakkankadavu in Chalakudy river collapsed in the downpour. The sand bund was constructed to prevent intrusion of brackish water from the backwaters.
It’s raining in Wyanad & Kodagu, water level rising in Cauvery dams With Wyanad in Kerala and other places in the Cauvery catchment area including Kodagu continuing to receive good rains, reservoirs in the Cauvery basin have been seeing good inflow of water in the past few days.
Reservoir
In flow on
May 24, 2018
In flow on
May 30, 2018
Kabini
815 cusecs
2,635 cusecs
Hemavathi
114 cusecs
2,856 cusecs
Harangi
90 cusecs
1,250 cusecs
Also the water levels in the dams are much higher compared to the corresponding period in the previous year as per water resources department sources.
Region wise, the season rainfall is likely to be 100% of LPA over North-West India, 99% of LPA over Central India, 95% of LPA over South Peninsula and 93% of LPA over North-East India all with a model error of ± 8 %.
The monthly rainfall over the country as whole is likely to be 101% of its LPA during July and 94% of LPA during August both with a model error of ± 9 %.
– Compared to April forecast, the forecast probability of Normal, above normal and excess rainfall has gone by 1% each, reducing by 2% the forecast probability of below normal rainfall and by 1% the forecast probability of deficient rainfall. This does not seem like significant change. http://www.imd.gov.in/pages/press_release_view.php?ff=20180530_pr_264 (IMD, 30 May 2018)
MoES Commissions High Resolution Ensemble Prediction Systems for Probabilistic Weather Forecasts The Ministry of Earth Sciences (MoES) on June 1, has commissioned two very high resolution (12 km grid scale) state-of-the-art global Ensemble Prediction Systems (EPS) for generating operational 10-days probabilistic forecasts of weather, made possibly due to the consistent efforts made by the scientists at Indian Institute of Tropical Meteorology (IITM), Pune, National Centre for Medium Range Weather Forecasting (NCMRWF), Noida and India Meteorological Department (IMD). The PIB PR says: “The frameworks of the new EPSs are among the best weather prediction systems in the world at present. Very few forecasting centres in the world use this high resolution for short-medium range probabilistic weather forecasts.”
CLOUD BURST 2nd Incident of CLOUD BURST in Uttrakhand in 2018: On June 1, there were cloud bursts at four locations Badkot, Tehri, Pouri and Nanital in Uttrakhand. Tehri and Pouri districts are reportedly most affected by incident. The level of Mandakani river rose dangerously in Rudraprayag district. The flash flood in the have reportedly damaged few bridges leaving locals disconnected.
In Thailisain block of Pouri few cowsheds were washed away along with cattle. A house wall collapsed in Kapkot, Bagheshwar. Landslides blocked highway in Chamoli. Char Dham Yatra is affected.
Weather department has issued high alert for next 24 hours forecasting heavy rains in hilly State. There were thunderstorm accompanied with rains in Dehradun and Ramnagar. In Ramnagar a storm occurred in the evening uprooting many trees resulting in disruption of traffic for several hours. https://www.thequint.com/news/india/uttarakhand-cloud-burst-pauri-paithani (The Quint, 1 June, 2018)
There was another cloudburst incident in Betalghat Pithoraghar. Cloud burst in Betalghat area of Pithoragarh district has caused huge devastation. Debris has been entered in many homes and shops. The fields got buried with rubble. There is no information of deaths in the incident. https://uttarakhandnewsnetwork.com/2018/06/crops-destroyed-after-cloud-burst-in-pithoragarh/ (Uttrakhand News Network, 1 June 2018)
Hindi report on Cloud burst incident in Uttrakhand उत्तराखंड में चार स्थानों पर बादल फटने से नुकसान हुआ है। शुक्रवार को एक के बाद एक टिहरी, उत्तरकाशी, पौड़ी और नैनीताल जिलों में बादल फटने से स्थानीय नदी-नालों में उफान आ गया। खेत मलबे से पट गए और कई घरों में पानी घुस गया। पैदल मार्ग बहने से करीब कई गांवों का संपर्क भी कट गया है। यद्यपि चमोली में बारिश के दौरान मलबा आने से बदरीनाथ हाईवे मलबा आने से आठ घंटे बंद रहा। https://epaper.jagran.com/ePaperArticle/02-jun-2018-edition-garwal-page_3-8928-15209-105.html (Dainik Jagran, 2 June 2018)
He also batted for joint-dredging of rivers and said the prime ministers of the two countries had an extensive discussions on the issue.
Responding to a question on China building dams on the Brahmaputra, he said: “On the Brahmaputra basin, we are very concerned about diversion of water and Bangladesh is prepared to join a joint basin management concept where we will discuss the points of water as it flows from the point of origin to the point of exit in the sea.”
On the Teesta water-sharing agreement, he said discussions have been going on within India between the states of Sikkim, West Bengal and the Centre.
NepalGovt Scraps Chinese Contract for West Seti Hydro project Nepal’s finance minister made the announcement to scrap the hydel power project with the Chinese firm while releasing the first federal budget for fiscal 2019. The reservoir type 750 MW West Seti project in western Nepal couldn’t be completed as the company, China Three Gorges Corporation or CTGC, demanded a hike in the power purchase rate, the price at which Nepal would be buying electricity. A year ago, the Chinese firm had given Nepal an option to reduce the production capacity to 600 MW, in case Nepal was not agreeable to paying a higher power purchase cost. The agreement signed between the two nations state that the Chinese firm CTGC will have a 75 per cent stake in the project and the rest will be held by the Nepal Electricity Authority. The project with the reservoir covers Baitadi, Bajhang and Dadeldhura. It was expected to produce 1.8 billion units of electricity a year. The project with the 207-metre-tall dam was estimated to cost $1.8 billion, including the interest charges of $0.4 Billion. https://www.ndtv.com/world-news/nepal-scraps-chinese-contract-will-build-mega-power-project-on-its-own-1859540?pfrom=home-lateststories (NDTV, 26 May 2018)
THE REST OF WORLD
USADAM EMERGENCY, EVACUATIONS IN USA AFTER LANDSLIDE TRIGERRED BY STORM Authorities in western North Carolina in USA has canceled evacuations in an area south of the Lake Tahoma dam, which had been in “imminent danger” of failing after a landslide. The landslide was set off by heavy rainfall associated with subtropical storm Alberto. Local officials said on May 30 morning (US Time) that an engineer had performed a safety inspection and determined that the evacuation order was no longer needed. Earlier after midnight on May 29, the National Weather Service had declared a flash flood emergency in the area, which read: “McDowell county emergency management reports water is spilling around the sides of Lake Tahoma dam. Evacuations ongoing south of the dam. THIS IS A LIFE-THREATENING SITUATION. HEED ALL EVACUATION ORDERS IMMEDIATELY!” An Update from NWS read: “A landslide has comprised the integrity of Lake Tahoma Dam. MANDATORY EVACUATIONS underway from the Dam at Lake Shore Dr to Lake Tahoma Rd (NC 80) to the confluence of the Catawba River near Resistoflex Rd and Riverside Park. ACT NOW TO PRESERVE YOUR LIFE!”
About 2,000 people were evacuated after emergency managers said the Lake Tahoma dam in western North Carolina was in danger of “imminent failure.” Heavy rain triggered landslides at the dam, and the National Weather Service said “evacuees are being asked to flee.” http://time.com/5295102/north-carolina-evacuations/ (Time, 30 May 2018)
American RiversAFTER THE FLOOD, BUILDING SAFER AND SMARTER “We must reject outdated flood control approaches. In the past, many cities and towns reacted to floods by building dams, levees and floodwalls, channelizing rivers in concrete straitjackets – an approach that actually increases flood damage downstream. Billions have been spent on dams, levees and other flood control structures, but we have been largely unsuccessful in “controlling” anything. Flood damages have continued to increase nationwide, costing taxpayers, families, businesses and the environment.
We now know that often the best way to reduce flood damage, and to safeguard people and property, is by avoiding development in floodplains, re-connecting rivers with their floodplains and by protecting and restoring wetlands. After decades of sustaining major flood damage, Vermont now actively promotes these natural flood-management solutions, as opposed to building more and bigger dams, levees and floodwalls. Recent projects in California’s Central Valley prove that reconnecting rivers to floodplains has multiple benefits for flood protection, water supply, fish and wildlife habitat and recreation.” https://www.americanrivers.org/2018/06/after-the-flood-building-safer-and-smarter/ (American Rivers, 1 June 2018)
StudyIn a Warming West, the Rio Grande Is Drying Up A study last year of the Colorado River, which provides water to 40 million people and is far bigger than the Rio Grande, found that flows from 2000 to 2014 were nearly 20 percent below the 20th century average, with about a third of the reduction attributable to human-caused warming. The study suggested that if climate change continued unabated, human-induced warming could eventually reduce Colorado flows by at least an additional one-third this century.
“Both of these rivers are poster children for what climate change is doing to the Southwest,” said Jonathan T. Overpeck, dean of the School for Environment and Sustainability at the University of Michigan and an author of the Colorado study. While both the Colorado and the Rio Grande are affected by warming, Dr. Overpeck said, the Rio Grande has also been hurt by declines in winter precipitation. https://www.nytimes.com/interactive/2018/05/24/climate/dry-rio-grande.html (The New York Times, 24 May 2018)
ReportEngland at risk of water shortages due to overuse and leaks England Environment Agency (EA) has warned that people need to use less water and companies must curb leaks to prevent future water shortages and damage to rivers and wildlife.
It also says that many sources of water supplies are already overstretched and, with climate change and a growing population, much of England could see significant supply shortages by the 2050s – particularly in the south-east.
In England, almost 9,500bn litres of freshwater were abstracted in 2016, which is enough to cover the whole of Greater London in nearly 6m (20ft) of water. But 3bn litres a day are lost through leaks from pipes – equivalent to the amount of water used by more than 20 million people in an average day, the EA said in a new report.
Large amounts of water are also wasted by households, where average use is 140 litres per person a day. In total, a third of water taken from the natural environment is wasted through leaks, treatment losses, and in the home.
The amount of water taken out of the environment for households, industry and agriculture was already unsustainable for more than a quarter (28%) of groundwater resources in 2017, and almost a fifth (18%) of surface water such as rivers have also seen unsustainable levels of abstraction.
That meant that somewhere between 6% and 15% of rivers were in a poor environmental condition, including more than three-quarters of chalk streams – a unique and globally important habitat.
England’s population is growing, and is set to rise to 58.5 million by 2026, putting even more stress on water supplies. If no action is taken to reduce demand and increase water supplies, most areas will not be able to meet demand, the report said.
Even with low population growth and less severe changes to the climate, there will be significant water supply deficits by the 2050s, particularly in the south east. The report also warned that energy generation is a major user of water.
In the future, more nuclear or renewables could reduce the use of water, but if gas or other fossil fuel power plants are used with technology to capture their carbon emissions and store it underground, that could lead to increased water use, the report said.
The state of Madhya Pradesh (MP) was bifurcated in the year 2000. The total area of MP state is 3,08,245 sq. km. The state has been divided into 50 districts and 342 sub districts. The total human population of the state is 725.97 million. (2011 census) with a decadal growth rate of 20.3%. Key centres of growth are around the urban centres of Gwalior, Indore, Bhopal and Jabalpur.
Climate
It has a subtropical climate. Hot dry summer extends from April to June followed by monsoon from July to September and winter months (November to February) are cool and relatively dry. The average rainfall is about 1,370 mm and it decreases from east to west. Summer mean maximum temperature rises to about 42.5 deg C in northern parts and the average temperature during winters is as low as 10 Deg C again in the north while it varies from 10 – 15 deg C in the south. (Source: Gosain et al in Climate Change in Madhya Pradesh: A Compendium of Expert Views – II)
Reliable data and information that is both correct and validated on ground, is a pre requisite to understand any feature or activity. And for a river, a constantly evolving and truly complex entity, it becomes even more crucial. The wellness quotient of rivers, their present health status, all these and more can only be understood, once we have the rudimentary knowledge of the river and the basins that they form.
A step in this direction has been taken up by the India WRIS (Water Resources Information System) project (A joint venture between Central Water Commission and Indian Space Research Organisation), that aims “to provide a ‘Single Window Solution’ for water resources data & information in a standardized national GIS framework”[i]. This project has generated 20 basin level reports that share important information on the salient features of the basin, their division into sub basins, the river systems that flow through it and the water resource structures, such as irrigation & hydro electric projects in the basin. Another crucial inclusion is the length of major rivers in each basin, which have been GIS calculated (Geographic information system)[ii] and in a few reports the place of origin of the rivers too is mentioned. (Ganga Basin Report). This is an improvement over the earlier documented river lengths that included the canal length along with the river lengths, in earlier CWC documents (e.g. water and related statistics)!
The Basin reports include basin level maps which also show the proposed inter basin transfer links and the major water resource structures & projects. Individual maps at the sub basin level mark the rivers & their watersheds. The report gives details on the topography, climate, the land use / land cover area , and also the information on hydro meteorological stations like groundwater observation cells, flood forecasting sites and even water tourism sites.
These reports can be downloaded from the WRIS site.[iii]
The reports are an attempt to document the water resources data & information for a better and more integrated planning, at the basin level. A table below tabulates some important parameters from the 20 basin reports.
Missing Dams! It can be seen from table on next page that total number of dams in all the 20 basins come to 4572. Assuming that this includes all the completed large dams in India by Dec 2013 (WRIS report is dated March 2014), if we look at the number of large dams in India as in Dec 2013 in the National Register of Large Dams (NRLD), the figure is 4845. This leaves a difference of 273 large dams, which are missing from the WRIS list! This seems like a big descripancy. Unfortunately, since NRLD gives only statewise list and does not provide river basin wise list and since WRIS list provides only river basin wise list and does not provide the names of districts and states, it is not possible to check which are the missing dams, but WRIS need to answer that.
Sub Basins These 20 basins have been further delineated into a number of sub basins. The sub basins details include the geographical extent of the sub basin, the rivers flowing in it, the states that they travel through, number and size range of watersheds and also the details of dams, weirs, barrages, anicuts, lifts & power houses, accompanied by maps at this level. The irrigation and hydro electric projects in the area are detailed and mapped for greater convenience. The sub basin list is given here to get a detailed picure.
Indus Basin Sub-basins:
River Dras in Indus Basin in Jammu and Kashmir (Photo by Sabita Kaushal)
Beas Sub Basin
Chenab Sub Basin
Ghaghar and others Sub Basin
Gilgit Sub Basin
Jhelum Sub Basin
Lower Indus Sub Basin
Ravi Sub Basin
Shyok Sub Basin
Satluj Lower Sub Basin
Satluj Upper Sub Basin
Upper Indus Sub Basin
S. No
River Basin
Major river
No. of sub basins
No. of watersheds
No. of water resource structures
No. of water resource projects
Irrigation
Hydro Electric
Dams
Barrages
Weirs
Anicuts
Lifts
Power Houses
Major
Medium
ERM*
1
Indus (Upto border)
Indus (India)
11
497
39
13
18
0
45
59
30
40
21
55
2a
Ganga
Ganga
19
980
784
66
92
1
45
56
144
334
63
39
b
Brahmaputra
Brahmaputra (India)
2
180
16
17
5
0
4
21
9
13
3
17
c
Barak & others basin
Barak
3
77
4
3
0
0
0
3
0
6
3
3
3
Godavari
Godavari
8
466
921
28
18
1
62
16
70
216
6
14
4
Krishna
Krishna
7
391
660
12
58
6
119
35
76
135
10
30
5
Cauvery
Cauvery
3
132
96
10
16
9
24
16
42
3
15
6
Subernarekha
Subernarekha & Burhabalang
1
45
38
4
12
0
0
3
5
34
0
1
7
Brahmani & Baitarni
Brahmani & Baitarni
2
79
61
5
4
1
0
1
8
35
4
1
8
Mahanadi
Mahanadi
3
227
253
14
13
0
1
6
24
50
16
5
9
Pennar
Pennar
2
90
58
0
1
2
0
1
7
14
0
1
10
Mahi
Mahi
2
63
134
0
4
0
0
3
10
29
3
2
11
Sabarmati
Sabarmati
2
51
50
2
10
0
0
0
9
11
4
–
12
Narmada
Narmada
3
150
277
2
2
0
4
9
21
23
1
6
13
Tapi
Tapi
3
100
356
8
11
0
13
2
13
68
2
1
14
WFR Tapi to Tadri
Many independent rivers flowing
2
96
219
0
3
0
1
18
13
15
1
12
15
WFR Tadri to Kanyakumari
3
92
69
6
6
4
0
29
19
12
7
21
16
EFR Mahanadi_ Pennar
4
132
64
5
12
12
0
0
12
46
10
0
17
EFR Pennar _ Kanyakumari
4
165
61
2
2
11
0
6
13
33
4
5
18
WFR Kutch _ Saurashtra
Luni
6
268
408
1
10
0
0
0
8
100
4
15
19
Area of inland drainage in Rajasthan
Many independent rivers flowing
–
–
1
0
0
0
48
0
11
1
1
0
20
Minor rivers draining into Myanmar(Burma) & Bangladesh
Many independent rivers flowing
4
54
3
5
0
0
3
–
3
4
1
–
Total
94
4335
4572
203
335
* Extension, Renovation and Modernization ** Data has been accumulated from the individual Basin Reports from India WRIS[iv]
Ganga Basin
Yamuna Lower
Yamuna Middle
Yamuna Upper
Chambal Upper
Chambal Lower
Tons
Kosi
Sone
Ramganga
Gomti
Ghaghara
Ghaghara confluence to Gomti confluence
Gandak & others
Damodar
Above Ramganaga Confluence
Banas
Bhagirathi & others ( Ganga Lower)
Upstream of Gomti confluence to Muzaffarnagar
Kali Sindh and others up to Confluence with Parbati
Brahmaputra Basin It is strange to see that the profile divides this huge basin into just two sub basins, when it could have easily divided into many others like: Lohit, Kameng, Siang, Subansiri, Tawang, Pare, Teesta, Manas, Sankosh, among others.
Brahmaputra Lower
Brahmaputra Upper
Barak & Others Basin
Barak and Others
Kynchiang & Other south flowing rivers
Naochchara & Others
Godavri Basin
Wardha
Weinganga
Godavari Lower
Godavari Middle
Godavari Upper
Indravati
Manjra
Pranhita and others
Krishna Basin
Bhima Lower Sub-basin
Bhima Upper Sub-basin
Krishna Lower Sub-basin
Krishna Middle Sub-basin
Krishna Upper Sub-basin
Tungabhadra Lower Sub-basin
Tungabhadra upper Sub-basin
Srisailam Dam on Krishna River (Source: Wikipedia)
Cauvery Basin
Cauvery upper
Cauvery middle
Cauvery lower
Subernarekha Basin No sub-basins.
Brahmani & Baitarani Basin
Brahmani
Baitarani
Mahanadi Basin
Mahanadi Upper Sub- basin
Mahanadi Middle Sub- basin
Mahanadi Lower Sub- basin
Pennar Basin
Pennar Upper Sub-basin
Pennar Lower Sub-basin
Mahi Basin
Mahi Upper Sub-basin
Mahi Lower Sub-basin
Sabarmati Basin
Sabarmati Upper Sub- basin
Sabarmati Lower Sub-basin
Narmada Basin
Narmada Upper Sub-basin
Narmada Middle Sub-basin
Narmada Lower Sub-basin
Tapi Basin
Upper Tapi Sub- Basin
Middle Tapi Sub- Basin
Lower Tapi Sub- Basin
West flowing rivers from Tapi to Tadri Basin
Bhastol & other Sub- basin
Vasisthi & other Sub- basin
West flowing rivers from Tadri to Kanyakumari Basin
Netravati and others Sub- basin
Varrar and others Sub- basin
Periyar and others Sub- basin
East flowing rivers between Mahanadi & Pennar Basin
Vamsadhara & other Sub- basin
Nagvati & other Sub- basin
East Flowing River between Godavari and Krishna Sub- basin
East flowing River between Krishna and Pennar Sub- basin
East flowing rivers between Pennar and Kanyakumari Basin
Palar and other Sub-basin
Ponnaiyar and other Sub-basin
Vaippar and other Sub-basin
Pamba and other Sub-basin
West Flowing Rivers of Kutch and Saurashtra including Luni Basin
Luni Upper Sub-basin
Luni Lower Sub-basin
Saraswati Sub-basin
Drainage of Rann Sub-basin
Bhadar and other West Flowing Rivers
Shetrunji and other East Flowing Rivers Sub-basin
Area of inland drainage in Rajasthan Due to very flat terrain and non-existence of permanent drainage network, this basin has not been further sub divided.
Minor rivers draining into Myanmar and Bangladesh
Imphal and Others sub basin
Karnaphuli and Others sub basin
Mangpui Lui and Others sub basin
Muhury and Others sub basin
Narmada Basin: Some details To understand the compiled information at the basin level, we take a look at the one of the basin level reports, the Narmada Basin Report[v] (dated March 2014) as an illustrative example. An overview of the basin area right at the beginning, gives its geographical location, shape, size, topography, climate & population. This basic relevant information is tabulated in a concise table for easy access, as given below:
Salient Features of Narmada Basin from WRIS Basin Report
River information The major river flowing in the basin, the Narmada River (also called Rewa) that flows through the 3 states of Madhya Pradesh, Maharashtra & Gujarat, its length (1333 km) and the length of its 19 major tributaries out of a total of 41 is given, based on GIS calculations. There is also a clear river network map of the Narmada basin that demarcates the 3 sub basins along with the watersheds, and shows the dams / weirs /barrages and the rivers in the basin.
Narmada Basin Report Cover Page (Source: WRIS)
Narmada Upper Sub-Basin, with 16 watersheds
Narmada Middle Sub-Basin, having 63 watersheds
Narmada Lower Sub-Basin, with 71 watersheds
The surface water bodies details include the size (less than 25 ha to more than 2500 ha) and type (Tanks, lakes, reservoirs, abandoned quarries or ponds) of existing bodies. Nearly 91.8% of these are tanks.
Irrigation Projects The water resource projects in the basin are as follows:
21 Major Irrigation Projects
23 Medium Irrigation Projects
1 ERM Project
6 Hydro-Electric Projects
Interestingly description is only of the major and medium irrigation projects, information on minor projects is completely absent. An attempt to include the details of minor irrigation projects would have made the report more useful. The reports seem to not understand the significance of the smaller projects and their importance for the people and in the conext of the River Basin too.
Water resource structures The number and type of big manmade structures in the basin is given. These are a total of 277 dams, 2 barrages, 2 weirs and 4 lifts, of which again the major structures are marked on a map, and details given as in table below. Dams are classified on the basis of storage and purpose they are used for, and the dam numbers are available at sub basin level.
Narmada Sub Basin details from WRIS Basin Report
The report gives tabulated data for each of the dams, which is supposed to have name of the river, height, length, purpose, year of commissioning, etc. Since GIS is the strength of ISRO, they could have easily given latitude and longitudes of each dam, but they have not. Shockingly, in case of 186 of the dams, name of the river on which it is built is given as ‘Local Nallah’, and in case of 10 they have left the column blank. This means for nearly 71% (196 out of 277) of the dams they do not even know the name of the river they are build on. This is actually an improvement over the performance of CWC. The CWC’s National Register of Large Dams[vi], we just checked, mentions Narmada only 13 times (for 12 dams of Gujarat and 1 dam of Madhya Pradesh).[vii]
It is well known that Narmada Basin is the theatre of India’s longest and most famous anti dam movement, Narmada Bachao Andolan. The movement involves opposition to Sardar Sarovar, Indira Sagar, Omkareshwar, Maheshwar, Jobat dams, among others. Such social aspects should also form part of any river basin report.
Surface water quality There are 19 surface water quality observation sites in the basin, that collect water data and the report spells out , “As compared to the other rivers, the quality of Narmada water is quite good. Even near the point of origin, the quality of river water was in class ‘C’ in the year 2001 while it was in class ‘B’ in earlier years. As was observed for most other rivers, in case of Narmada also, BOD and Total Coliform are critical parameters.” This shows that even in Narmada Basin, water quality is deteriorating. The statement also remains vague in absence of specifics.
Inter basin transfer links Details of the Par-Tapi-Narmada Link, which is a 401 km long gravity canal and its proposal to transfer 1,350 MCM (Million Cubic metre) of water from ‘surplus rivers’ to ‘water deficit’ areas is given, along with a map. How has the conclusion of surplus or deficit been reached? Does the assessment exhaust all the options including rainwater harvesting, watershed development, groundwater recharge, better cropping patterns and methods, demand side management, optimising use of existing infrastructure, etc? Is this is the least cost option? Does the water balance include groundwater? Who all will be affected by this or even how much land area will be affected by this proposal, there is absolutely no talk of this? No answers in the report.
India River Basins Map (Source – WRIS)
There’s more to a river There is no information in basin reports on the regulating or statutory bodies that have a say in the basin in the report. However, some information on the existing organisations and inter-state agreements at the various basin level is given at another WRIS location.[viii]
The Basin reports for 20 basins are clearly an asset for understanding and analysing water resource situation. However, there is no mention of the numerous ecological, social and environmental services these rivers provide us with. The demographic details of the basin are available, but there is no information on the flora and fauna, who also need and thrive on the river waters. A good navigation tool for water resource information and river management projects at basin level, nevertheless, for a broader and more comprehensive outlook these reports should have included the following essential aspects too:
River status: The present water quality & pollution level of the major rivers as well as their tributaries
River governance: The local committees, civil bodies and institutions that play a role in river basin development
River safety measures: Effect of the existing and planned river management projects on the state of the river, people and society.
River ecology: Status of biodiversity, and other ecological aspects of the rivers

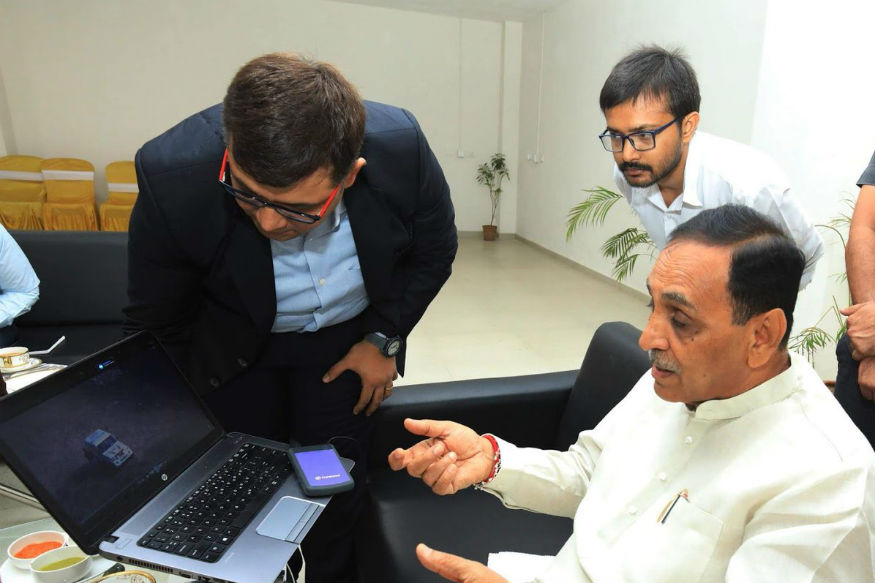
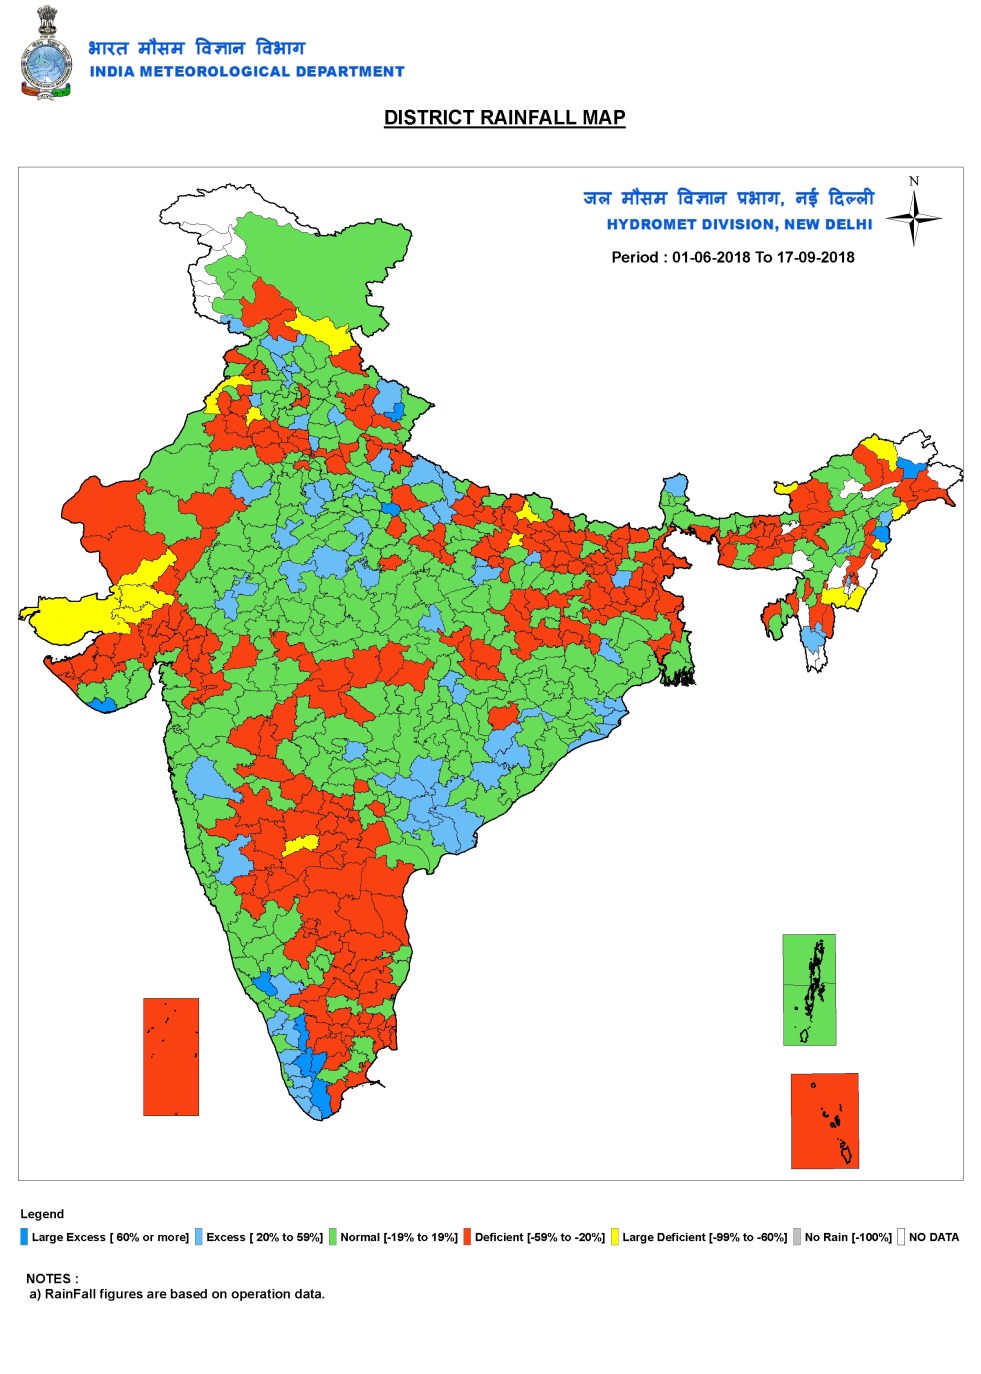


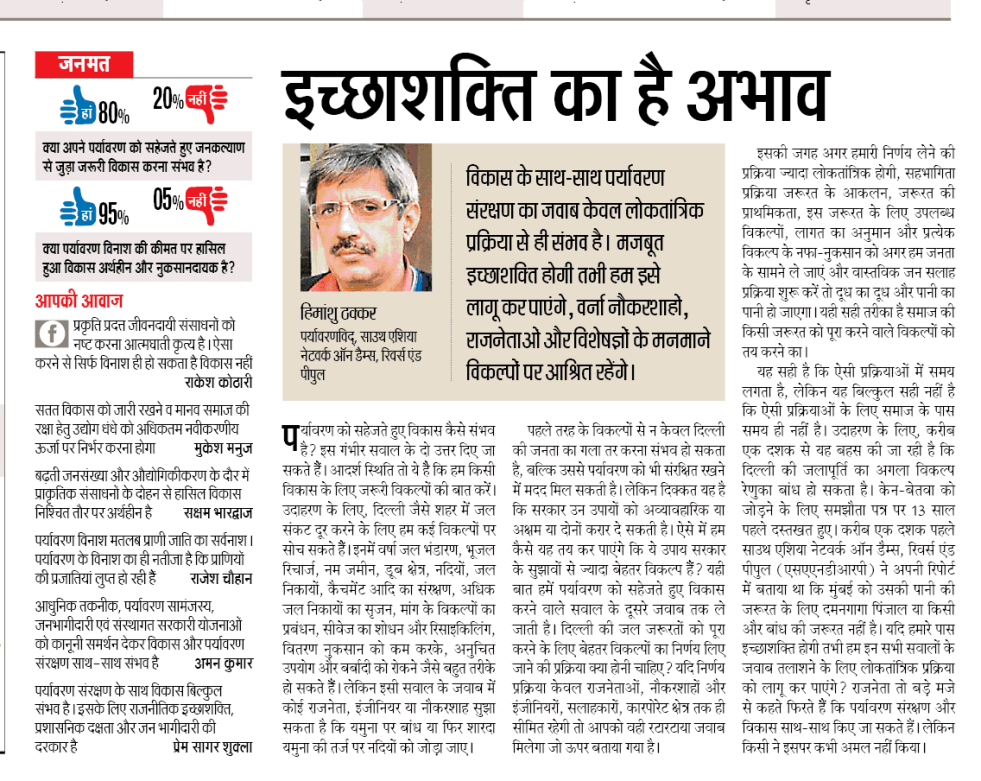
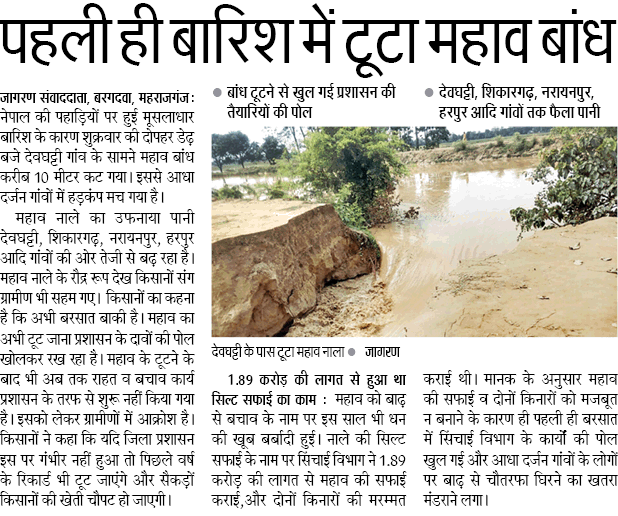
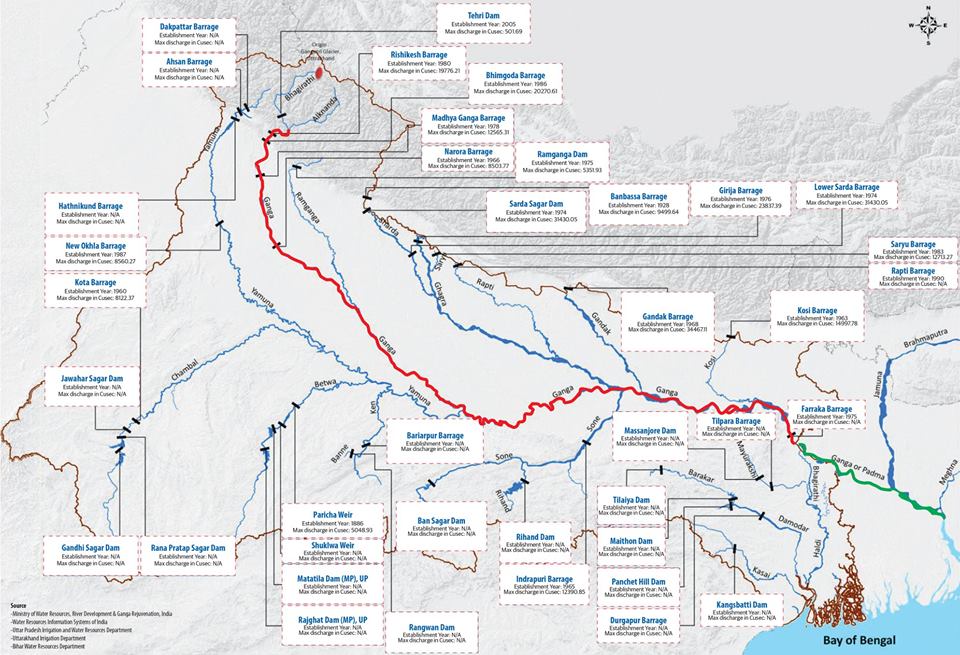
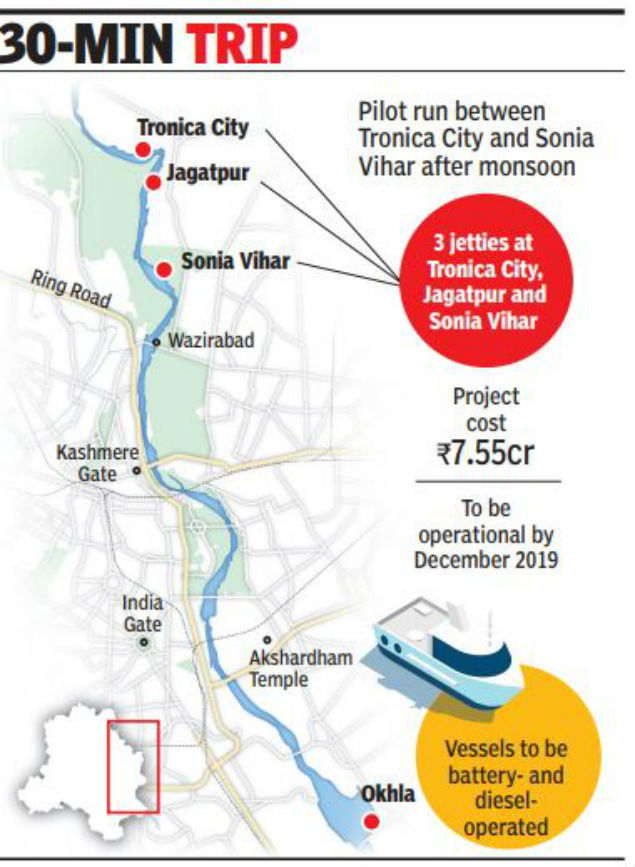
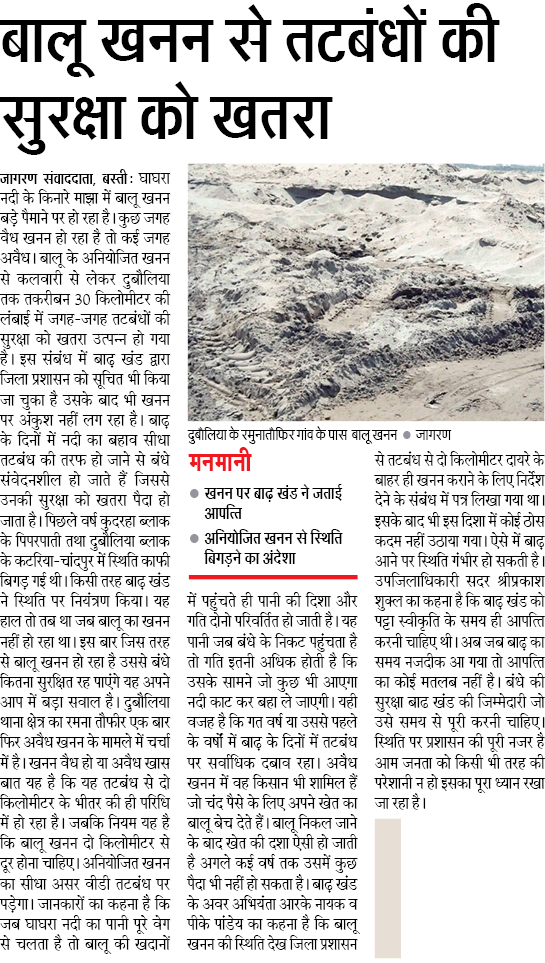
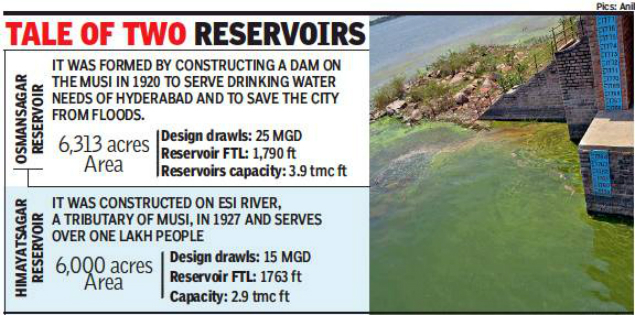
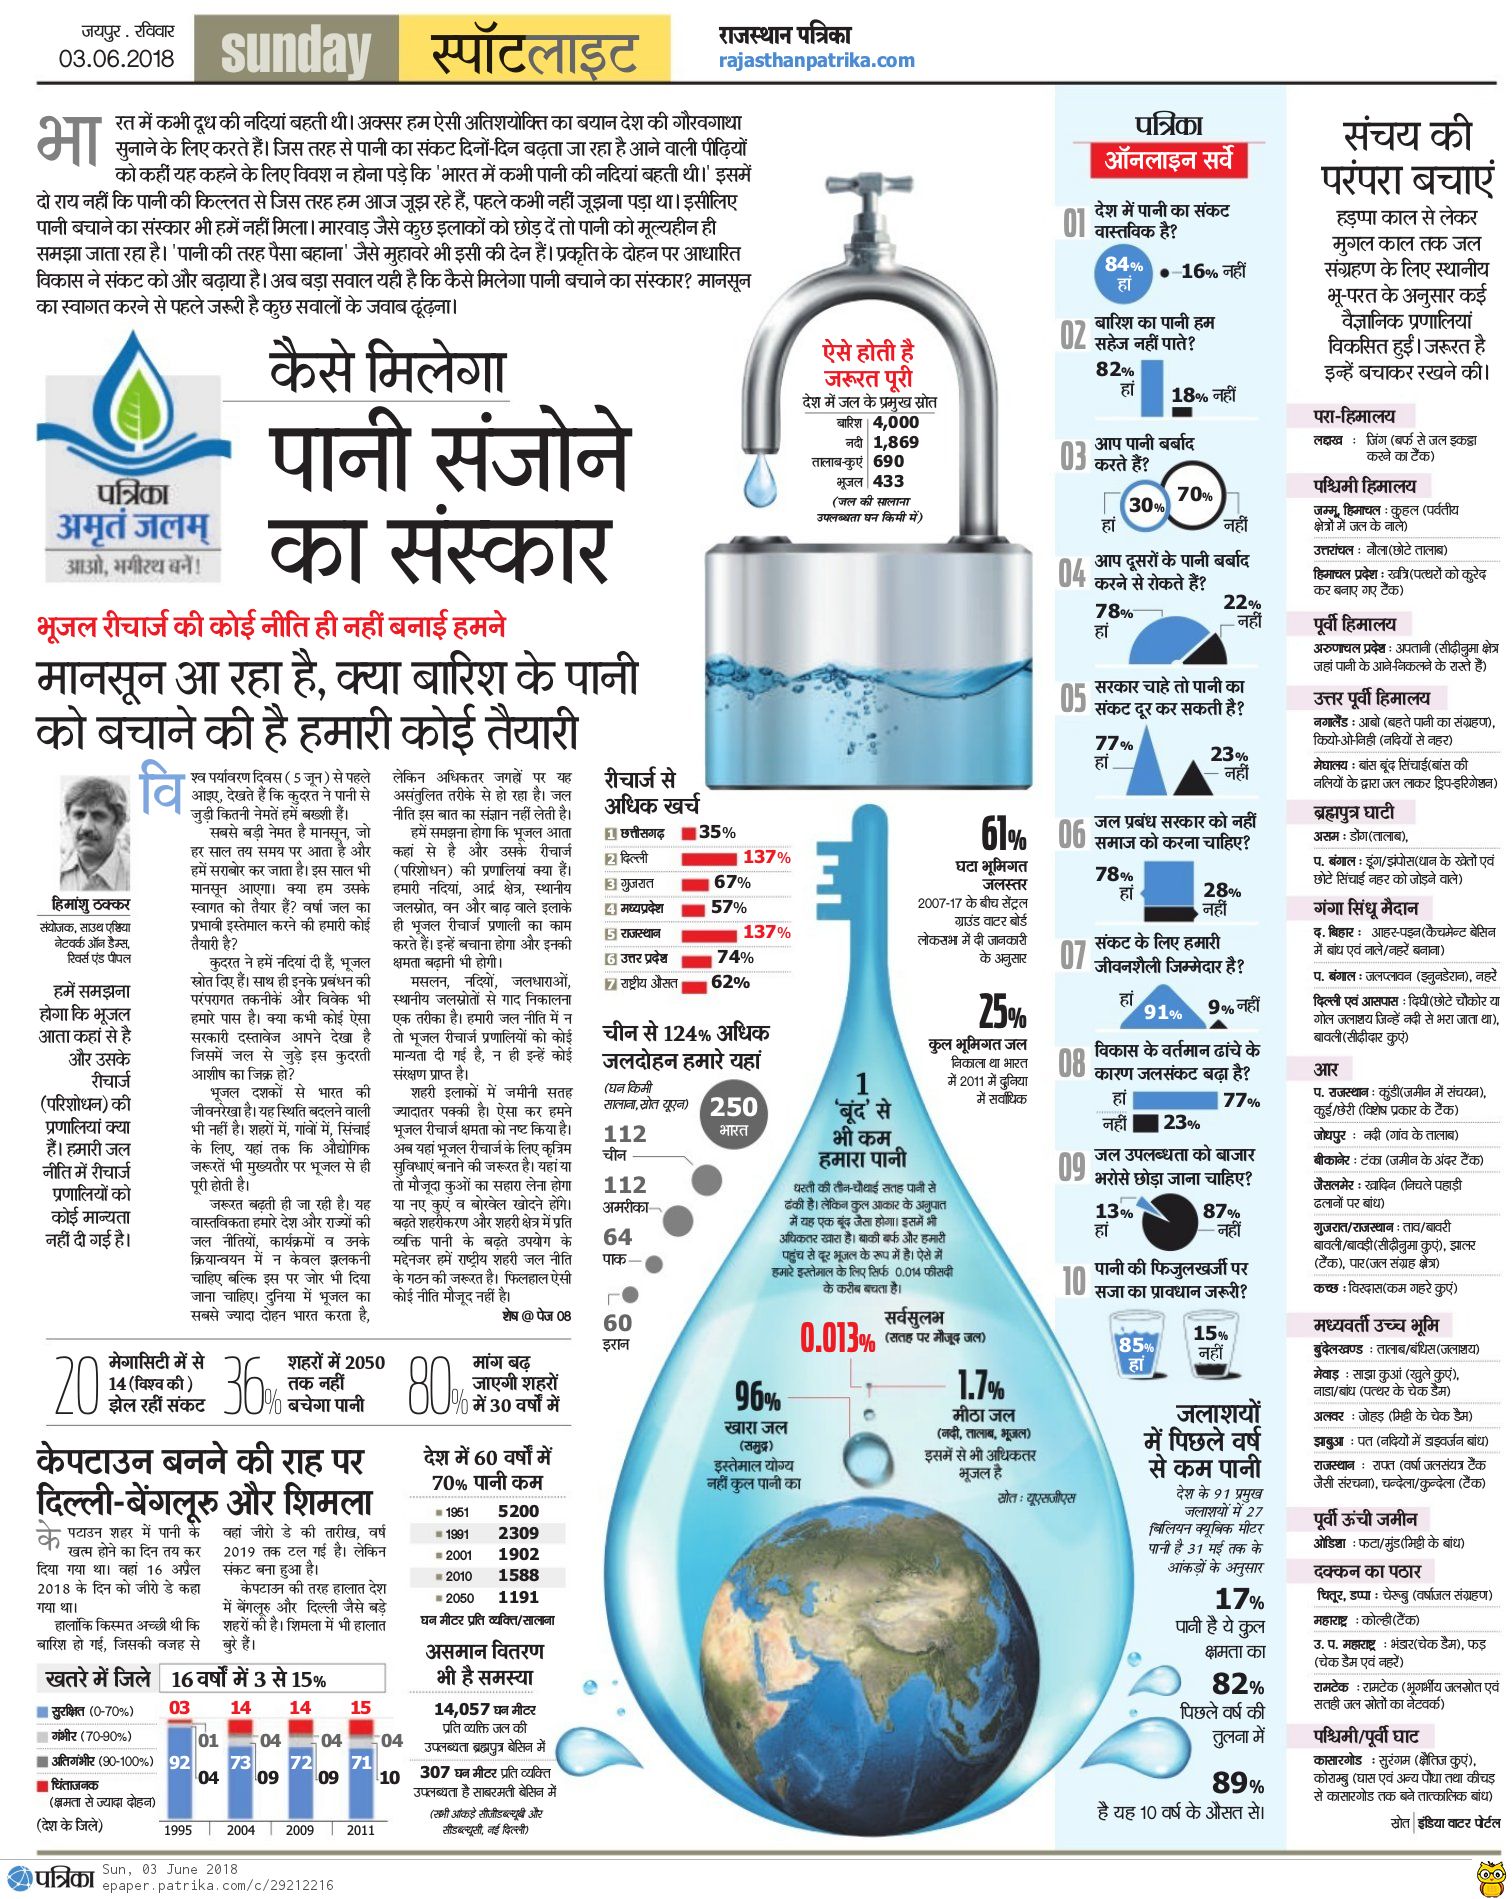
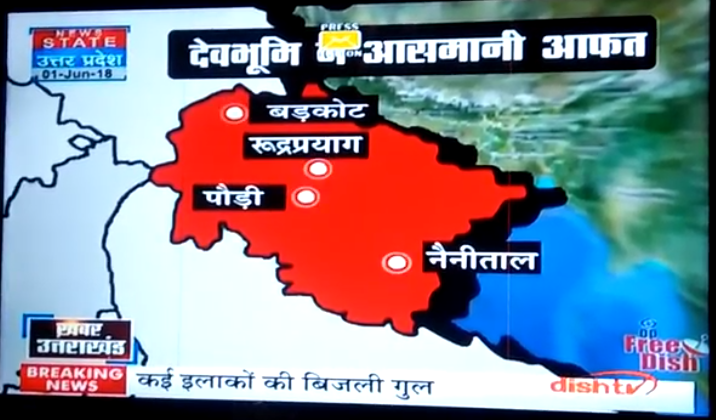
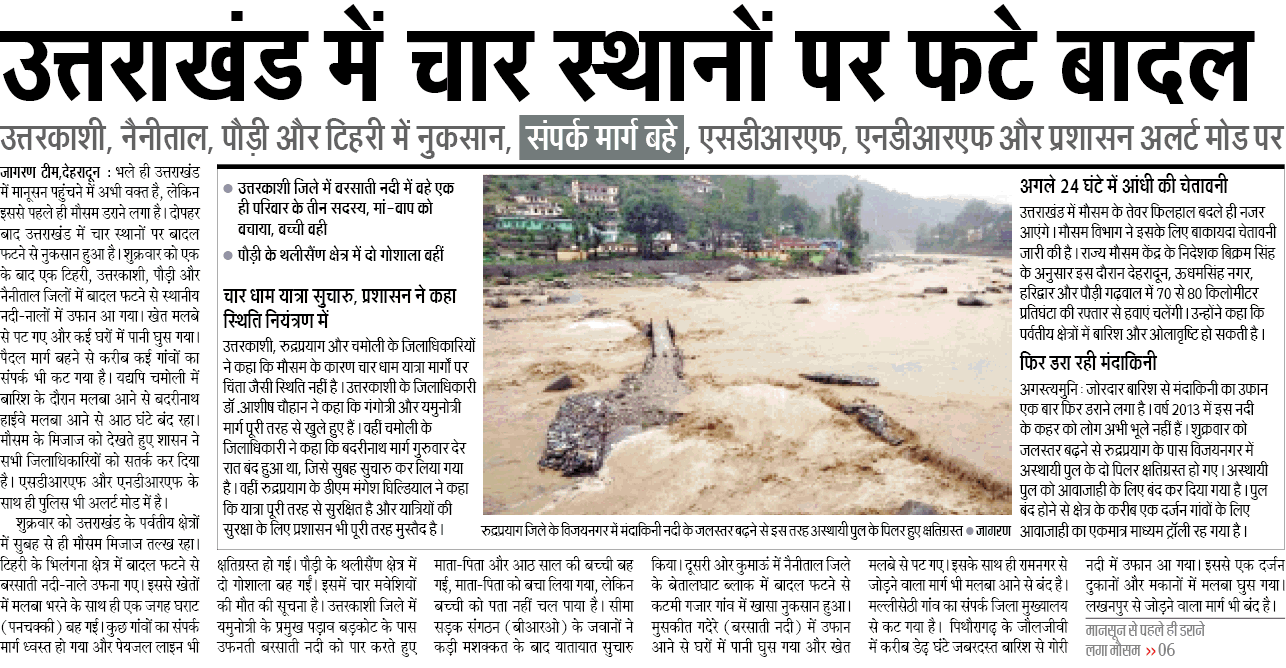

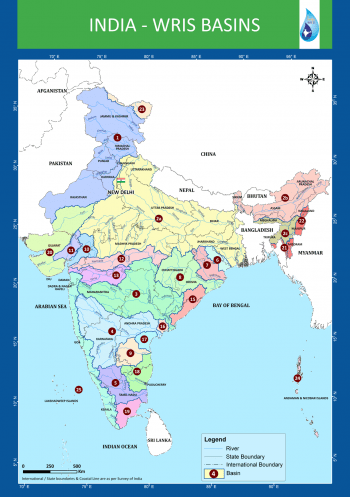
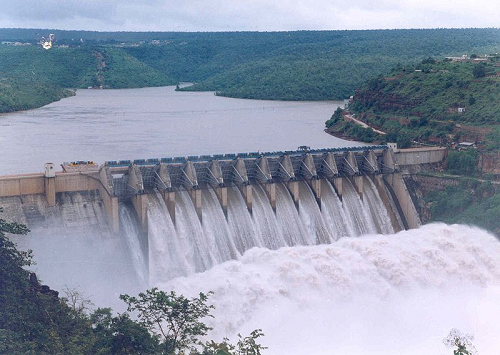
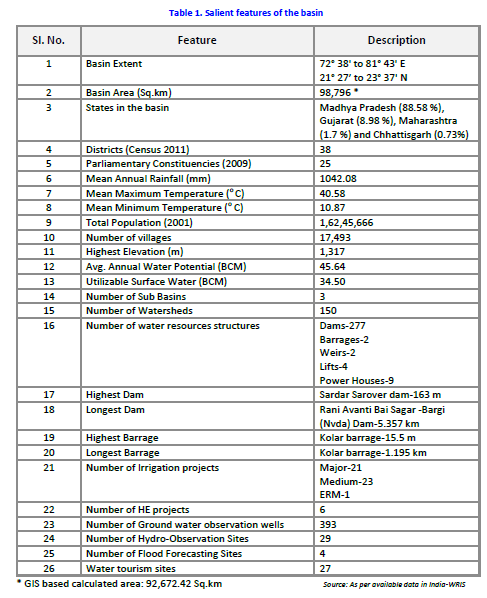
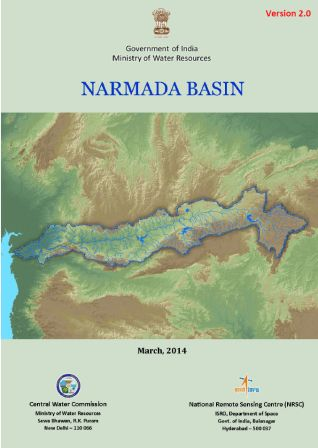
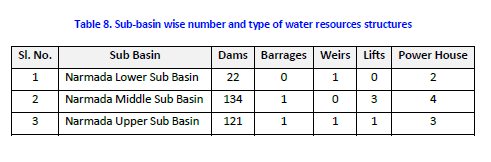

