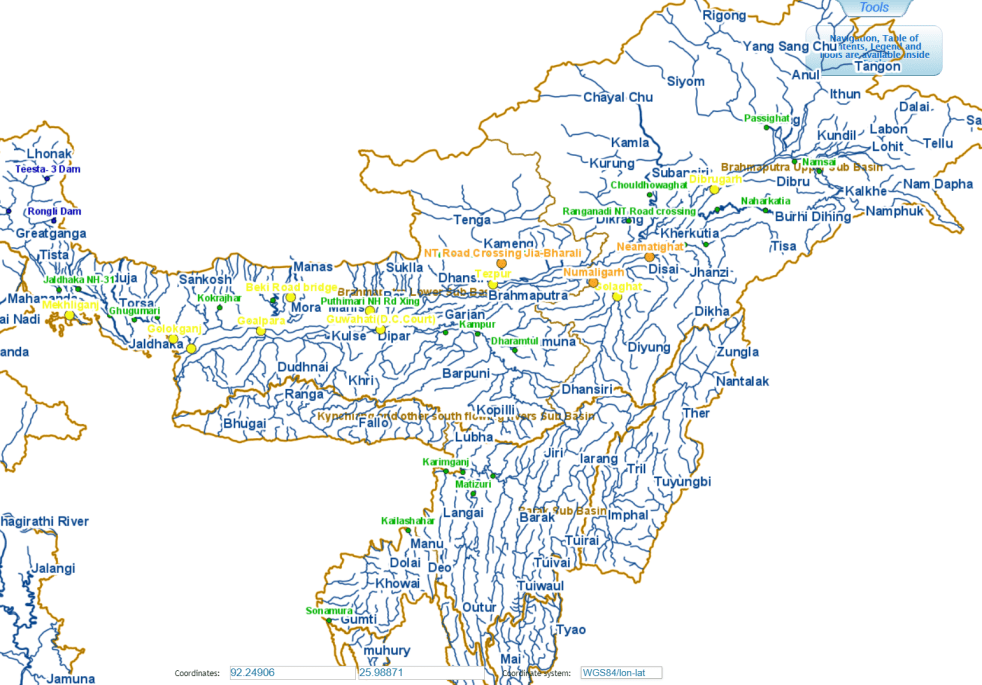
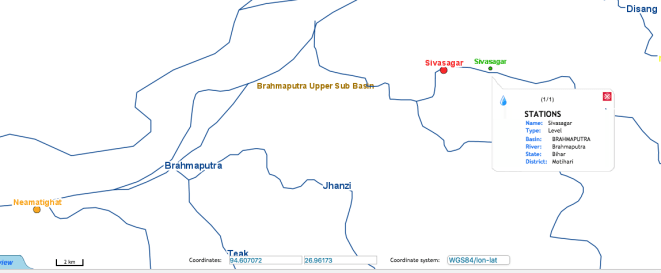
Central Water Commission (CWC) measures and monitors water level at 700 hundred Flood Forecasting site in the country. It publishes this information on its Flood Forecast website[I]. The website has three ways to get this information: Data Flow Map, List Based Exploration, and Hydrograph view. The Hydrograph view provides information for past 72 hours, supposed to be updated every hour. This is in addition to the list of current forecasts.
As per the website the Data Flow Map has information about 226 Flood Forecast Sites in the country comprising of 166 Level Forecast Sites and 60 Inflow Forecast Sites. It also monitors 700 Flood sites, information made available through List Based Exploration and Hydrograph View.
In order to better understanding the CWC’s flood monitoring and forecasting work, in this article we have given state wise list of CWC’s Level Forecast, Inflow Forecast and level monitoring sites in North East India. For better understanding, we have also included part of West Bengal that is in Brahmaputra basin here, in addition to the 8 North Eastern states. Similar report has been published for North India[II] and we hope to publish reports covering other regions of India too.
ARUNACHAL PRADESH There are 2 Flood Forecasting sites and 9 Flood monitoring sites in Arunachal Pradesh. There is no Inflow Forecasting site. China Bridge Flood Monitoring site on Manas river in Tawang district is inactive.
List Level Forecasting Sites in Arunachal Pradesh
| SN | Site | River | Sub-Basin/ Basin | District | WL | DL | HFL, M | HFL Date |
| 1 | Passighat | Siang | Siang / Brahmaputra | East Siang | 152.96 | 153.96 | 157.54 | 11-06-2000 |
| 2 | Namsai | Lohit | Lohit/ Brahmaputra | Lohit | 140.6 | 141.1 | 144.46 | 07-10-1979 |
List of Flood Monitoring Sites in Arunachal Pradesh
| SN | Site | River | Sub-Basin/ Basin | District | HFL, M | HFL Date |
| 1 | Tuting | Siang | Siang / Brahmaputra | Upper Siang | 420.43 | 06-09-2010 |
| 2 | Lemeking | Subansiri | Subansiri / Brahmaputra | Upper Subansiri | 1107.16 | 27-07-2016 |
| 3 | Daporizo | Subansiri | Subansiri / Brahmaputra | Upper Subansiri | 213.9 | 15-10-1987 |
| 4 | Kibithu | Lohit | Lohit/ Brahmaputra | Anjaw | 1229.8 | 25-07-2016 |
| 5 | Tezu | Lohit | Lohit/ Brahmaputra | Lohit | 192.14 | 16-07-1996 |
| 6 | Seppa | Kameng | Kameng / Brahmaputra | East Kameng | 342.6 | 26-06-1998 |
| 7 | Bhalukpong | Kameng | Kameng / Brahmaputra | West Kameng | 141.79 | 16-06-1989 |
| 8 | China Bridge* | Tawang | Tawang / Brahmaputra | Tawang | NA | NA |
| 9 | Miao | Nao Dehing | Nao Dehing / Brahmaputra | Changlang | 241.57 | 09-07-2004 |
ASSAM Over all there are 62 sites comprising of 29 Level Forecasting and 33 Flood monitoring sites in Assam. The sites shown in Red colour are inactive and the sites shown in Green colour has no HFL data but the Hydrograph for these sites are active. No Inflow Forecasting site in Assam is listed on CWC FF website, however, CWC’s Standarad Operating Procedure for Flood Forecasting in 2018 lists one: Lower Subansiri site on Subansiri river in Dhemaji district. That site seems non functional.
List of Level Forecasting Sites in Assam
| SN | Site | River | Sub-Basin/ Basin | District | WL | DL | HFL, M | HFL Date |
| 1 | Dholabazar | Lohit | Lohit/ Brahmaputra | Tinsukia | 127.27 | 128.27 | 130.7 | 22-09-2012 |
| 2 | NAHARKATIA | Buridehing | Buridehing/ Brahmaputra | Dibrugarh | 119.4 | 120.4 | 122.69 | 17-06-1973 |
| 3 | Chenimari (Khowang) | Buridehing | Neodihing/ Upper Brahmaputra | Dibrugarh | 101.11 | 102.11 | 104.16 | 02-09-2015 |
| 4 | Dibrugarh | Brahmaputra | Upper Brahmaputra/ Brahmaputra | Dibrugarh | 104.7 | 105.7 | 106.48 | 03-09-1998 |
| 5 | Chouldhowaghat | Subansiri | Subansiri/ Brahmaputra | Lakhimpur | 99.43 | 100.43 | 101.31 | 27-07-1972 |
| 6 | Ranganadi NT Rd Xing | Ranganadi | Teesta/ Brahmaputra | Lakhimpur | 93.81 | 94.81 | 95.92 | 02-07-1979 |
| 7 | Naglamoraghat | Desang | Upper Brahmaputra/ Brahmaputra | Sibsagar | 93.46 | 94.46 | 96.49 | 06-09-1998 |
| 8 | Sivasagar | Dikhow | Dikhow/ Brahmaputra | Sibsagar | 91.4 | 92.4 | 94.19 | 25-06-1998 |
| 9 | Golaghat | Dhansiri (S) | Dhansiri/ Brahmaputra | Golaghat | 88.5 | 89.5 | 92. 45 | 11-10-1986 |
| 10 | Neamatighat | Brahmaputra | Upper Brahmaputra/ Brahmaputra | Jorhat | 84.04 | 85.04 | 87.37 | 11-07-1991 |
| 11 | Badatighat | Subansiri | Subansiri/ Brahmaputra | Lakhimpur | 81.53 | 82.53 | 86.21 | 28-07-1972 |
| 12 | Numaligarh | Dhansiri (S) | Dhansiri/ Brahmaputra | Golaghat | 76.42 | 77.42 | 79.87 | 24-09-1985 |
| 13 | NT Crossing Jia Bharali | Jiabharali | Kameng/ Brahmaputra | Sonitpur | 76.00 | 77.00 | 78.5 | 26-07-2007 |
| 14 | Tezpur | Brahmaputra | Lower Brahmaputra/ Brahmaputra | Sonitpur | 64.23 | 65.23 | 66.59 | 27-08-1988 |
| 15 | Kampur | Kopili | Lower Brahmaputra/ Brahmaputra | Nagaon | 59.5 | 60.5 | 61.79 | 20-07-2004 |
| 16 | Dharamtul[III] | Kopili | Lower Brahmaputra/ Brahmaputra | Marigaon | 55.0 | 56.0 | 58.9 | 21-07-2004 |
| 17 | Pagladiya NT Rd Xing | Pagladiya | Pagladiya/ Brahmaputra | Nailbari | 51.75 | 52.75 | 55.45 | 08-07-2004 |
| 18 | Puthimari NH Rd Xing | Puthimari | Puthimari/ Brahmaputra | Kamrup | 50.81 | 51.81 | 55.08 | 31-08-2008 |
| 19 | Guwahati (DC Court) | Brahmaputra | Dhansiri/ Brahmaputra | Kamrup | 48.68 | 49.68 | 51.46 | 21-07-2004 |
| 20 | Manas NH Crossing | Manas | Manas/ Brahmaputra | Barpeta | 47.81 | 48.42 | 50.08 | 15-09-1984 |
| 21 | Beki Road Bridge | Beki | Beki/ Brahmaputra | Barpeta | 44.1 | 45.1 | 46.2 | 04-08-2000 |
| 22 | Kokrajhar | Gaurang | Champabati/ Brahmaputra | Kokrajhar | 41.85 | 42.85 | 43.06 | 20-08-2015 |
| 23 | Gaolpara | Brahmaputra | Dhansiri South/ Brahmaputra | Gaolpara | 35.27 | 36.27 | 37.43 | 31-07-1954 |
| 24 | Golokgunj | Sankosh | Sankosh/ Brahmaputra | Dubri | 28.94 | 29.94 | 30.95 | 08-09-2007 |
| 25 | Dhubri | Brahmaputra | Lower Brahmaputra/ Brahmaputra | Dhubri | 27.62 | 28.62 | 30.36 | 01-08-1989 |
| 26 | Matizuri | Katakhal | Katakhal/ Barak | Hailakandi | 19.27 | 20.27 | 22.73 | 10-09-2007 |
| 27 | Annapurna ghat | Barak | Barak / Barak | Cachar | 18.83 | 19.83 | 21.84 | 02-09-1989 |
| 28 | Badarpurghat | Barak | Barak / Barak | Cachar | 15.85 | 16.85 | 18.48 | 11-09-2007 |
| 29 | Karimganj | Kushiyara | Barak/ Barak | Karimganj | 13.94 | 14.94 | 16.57 | 10-06-2010 |
List of Flood Monitoring Sites in Assam
| SN | Site | River | Sub-Basin/ Basin | District | HFL, M | HFL Date |
| 1 | Matunga | Kalanadi | Lower Brahmaputra/ B’putra | Nailbari | 168.18 | 19-07-1980 |
| 2 | DRF | Puthumari | Lower Brahmaputra/ B’putra | Nailbari | 144.3 | 28-08-1988 |
| 3 | Margherita | Buridehing | Neo dehing/ Brahmaputra | Tinsukia | 137.51 | 26-08-1988 |
| 4 | Bokajan | Dhansiri South | Lower Brahmaputra/ B’putra | Karbi Anglong | 135.13 | 09-10-1986 |
| 5 | Dillighat | Desang | Upper Brahmaputra/ B’putra | Dibrugarh | 129.65 | 28-08-1977 |
| 6 | Desangpani | Desang | Upper Brahmaputra/ B’putra | Sibsagar | 106. 26 | 24-04-2016 |
| 7 | Bihubar | Dikhow | Upper Brahmaputra/ B’putra | Sibsagar | 104.77 | 24-06-1998 |
| 8 | Mathanguri | Manas | Manas/ Brahmaputra | Barpeta | 102.28 | 30-10-1973 |
| 9 | Gelabil | Doyang | Dhansiri/ Brahmaputra | Golaghat | 101. 5 | 18-06-1985 |
| 10 | Suklai | Siklai | Dhansiri/ Brahmaputra | Kamrup | 76.18 | 12-09-1983 |
| 11 | Kheronighat | Kopili | Lower Brahmaputra/ B’putra | Karbi Analong | 74.07 | 19-07-2004 |
| 12 | Bhomoraguri | Brahmaputra | Lower Brahmaputra/ B’putra | Sonitpur | 67.18 | 13-08-2017 |
| 13 | PANBARI | Manas | Manas/ Brahmaputra | Barpeta | 55.96 | 28-08-1980 |
| 14 | PANCHARATNA | Manas | Manas/ Brahmaputra | Goalpara | NA | NA |
| 15 | AIE NH XING | Aie | Beki/ Brahmaputra | Barpeta | 53.26 | 21-08-2015 |
| 16 | Pandu | Brahmaputra | Lower Brahmaputra/ B’putra | Kamrup | 49.88 | 06-09-1998 |
| 17 | Gharmura | Dhaleswari | Dolasor[IV]/ Barak | Hailakandi | 36.3 | 31-07-1989 |
| 18 | BAHALPUR | Champamati | Champabati/ Brahmaputra | Barpeta | 35.8 | 15-06-1995 |
| 19 | DUDHNAI | Dudhnai | Lower Brahmaputra/ B’putra | Goalpara | NA | NA |
| 20 | KULSI | Kulsi | Dhansiri/ Brahmaputra | Kamrup | NA | NA |
| 21 | SONAPUR | Digaru | Dhansiri/ Brahmaputra | Kamrup | NA | NA |
| 22 | Monierkhal | Sonai | Barak/ Barak | Cachar | 32.18 | 01-08-1989 |
| 23 | DHOLAI | Rukni | Barak/ Barak | Cachar | 28.24 | 22-07-1993 |
| 24 | Kulichera | Rukni | Barak/ Barak | Cachar | NA | NA |
| 25 | Amraghat | Barak | Barak/ Barak | Cachar | 29.99 | 31-07-1989 |
| 26 | Lakhipur | Barak | Barak/ Barak | Cachar | 26.96 | 31-07-1989 |
| 27 | Fulertal | Barak | Barak/ Barak | Cachar | 26.39 | 21-07-2004 |
| 28 | TULARGRAM | Sonai | Barak/ Barak | Cachar | 24.73 | 01-08-1989 |
| 29 | Kashithal | Sonai | Barak/ Barak | Cachar | NA | NA |
| 30 | AP Ghat | Barak | Barak/ Barak | Cachar | 21.763 | 11-09-2007 |
| 31 | FAKIRABAZAR | Barak | Barak/ Barak | Karimpur | 18.575 | 12-05-1991 |
| 32 | B.P.Ghat | Barak | Barak/ Barak | Karimpur | 18.48 | 12-09-2007 |
| 33 | GUMRA | Kushiyara | Barak/ Barak | Cachar | 18.35 | 25-06-1988 |
MEGHALAYA Meghalaya has 7 Level Monitoring sites only. Out of these 7 sites 2 shown with Red colour are inactive.
List of Flood Monitoring Sites in Meghalaya
| SN | Site | River | Sub-Basin/ Basin | District | HFL, M | HFL Date |
| 1 | Dawki | Umngot | Kynchiang and other south flowing rivers/ | East Khasi Hills | 73.47 | 28-05-2006 |
| 2 | THERRIAGHAT | Umnohryngkew | Kynchiang and other south flowing rivers/ | East Khasi Hills | 20.62 | 15-06-1995 |
| 3 | Kharkhana | Myntudu | Kynchiang and other south flowing rivers/ | East Khasi Hills | 47.0 | 23-04-1995 |
| 4 | Myndu Stage II, Dam Site | Brahmaputra | Kynchiang and other south flowing rivers/ | Jaintia Hills | NA | Na |
| 5 | Myntdu Stage-II power house | Barak | Kynchiang and other south flowing rivers/ | Jaintia Hills | NA | NA |
| 6 | Dimapara | Bugi | Kynchiang and other south flowing rivers/ | South Garo Hills | 29.75 | 27-07-2007 |
| 7 | SIBBARI | Dareng | Kynchiang and other south flowing rivers/ | South Garo Hills | 20.34 | 12-08-2017 |
MANIPUR Manipur state has only 1 Flood monitoring site. There is no Level and Inflow Forecasting site in the state.
List of Flood Monitoring Sites in Manipur
| SN | Site | River | Sub-Basin/ Basin | District | HFL, M | HFL Date |
| 1 | Chotebekra | Barak | Barak / Barak | Imphal East | 32.1 | 31-07-1989 |
TRIPURA Tripura State has 2 Level Forecasting and 10 Flood Monitoring Sites. The Sonamura site on Gumti river is mentioned 3 times in the CWC website. There is no Inflow Forecasting site in Tripura.
List of Level Forecasting Sites in Tripura
| SN | Site | River | Sub-Basin/ Basin | District | WL | DL | HFL, M | HFL Date |
| 1 | Kailashahar | Manu | Naochchara and others | North Tripura | 24.34 | 25.34 | 25.79 | 07-06-1993 |
| 2 | Sonamura | Gumti | Naochchara and others | West Tripura | 11.5 | 12.5 | 14.43 | 23-07-1993 |
List of Flood Monitoring Sites in Tripura
| SN | Site | River | Sub-Basin/ Basin | District | HFL, M | HFL Date |
| 1 | Kamalpur GDS Sit | Dhalai | Naochchara and others | Dhalai | 33.85 | 15-05-1984 |
| 2 | Kumarghat GD | Manu | Naochchara and others | North Tripura | 32.97 | 07-06-1993 |
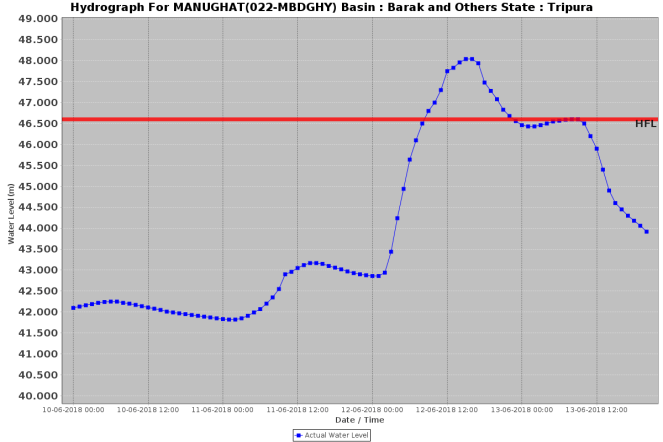
| 3 | Manughat | Manu | Naochchara and others | North Tripura | 46.6 | 05-06-2001 |
| 4 | Kailashahar GDSQ | Manu | Naochchara and others | Unakoti | 25.795 | 07-06-1993 |
| 5 | Nutan Bazar GD | Juri | Naochchara and others | North Tripura | 20.435 | 15-05-1984 |
| 6 | Amarpur | Barak | Barak / Barak | South Tripura | 32.74 | 22-07-1993 |
| 7 | Belonia | Muhuri | Barak / Barak | South Tripura | 16.98 | 04-08-1983 |
| 8 | GAJARAIA | Burima | Kynchiang and other south flowing rivers sub-basin | West Tripura | 11.15 | 24-06-2004 |
| 9 | HAORA | Haora | Naochchara and others | West Tripura | 12.14 | 24-06-2004 |
| 10 | KHOWAI | Khowai | Naochchara and others | West Tripura | 28.005 | 24-06-2004 |


MIZORAM There are 7 Flood Monitoring sites in Mizoram. Out of these, 5 sites shown in Red colour are inactive. The CWC web site shows active hydrograph for Sairang site on Dhaleswari river though the list based exploration sheet lacks HFL data about the site. There are not level or inflow forecasting sites in Mizoram.
List of Flood Monitoring Sites in Mizoram
| SN | Site | River | Sub-Basin/ Basin | District | HFL, M | HFL Date |
| 1 | Sairang | Dhaleswari | Barak/ Barak | Aizawl | NA | NA |
| 2 | Turial | Barak | Barak/ Barak | Aizawl | 149.0 | 17-06-1995 |
| 3 | Bailley Bridge Tuipui | Barak | Barak/ Barak | Champhai | NA | NA |
| 4 | Sihthangpui | Kolodyne[V] | Kolodyne/ Barak | Lawngtlai | NA | NA |
| 5 | Keitum | Tlawng[VI] | Barak/ Barak | Lunglei | NA | NA |
| 6 | Tuichang | Tuichang | Barak/ Barak | Lunglei | NA | NA |
| 7 | Tuichawng | Tuichang | Barak/ Barak | Lunglei | NA | NA |
SIKKIM CWC’s FF web site lists no Level Forecasting sites in Sikkim, though the CWC’s Standard Operating Procedure for Flood Forecasting in 2018 lists three Sikkim sites among its Level Forecasting sites: Malli Bazar (South Sikkim Dist), Jorethang (South Sikkim Dist) and Singtam (East Sikkim Dist). All three are thus non functional. The state has 18 Flood Monitoring sites out that 14 sites which are shown in red colour are not active. Similarly, the CWC FF website lists 4 Inflow Forecasting sites in Sikkim but only one site is active. Even the one site that is active is not fully functional as it does now show outflow on the hydrograph. Moreover, CWC’s SOP document lists a fifth site under inflow forecasting, namely Teesta V HEP Dam at Singtam in East Sikkim district. This again is not working.
List of Flood Monitoring Sites in Sikkim
| SN | Site | River | Sub-Basin/ Basin | District | HFL, M | HFL Date |
| 1 | Sankalan | Teesta | Teesta/ Brahmaputra | North | 762.3 | 16-06-1973 |
| 2 | Rangpo | Teesta | Teesta/ Brahmaputra | South | 304.6 | 26-07-1972 |
| 3 | KHANITAR | Teesta | Teesta/ Brahmaputra | East | 297.7 | 18-09-1974 |
| 4 | Majitar | Teesta | Teesta/ Brahmaputra | South | 279.29 | 17-10-1985 |
| 5 | Chujachen
(Rongli Chu) |
Teesta | Teesta/ Brahmaputra | East | NA | NA |
| 6 | Rorathang | Teesta | Teesta/ Brahmaputra | East | NA | NA |
| 7 | Singtham | Teesta | Teesta/ Brahmaputra | East | NA | NA |
| 8 | Bakcha chu | Teesta | Teesta/ Brahmaputra | North | NA | NA |
| 9 | Chungthang (Lachen Chu) RR | Teesta | Teesta/ Brahmaputra | North | NA | NA |
| 10 | Dickchu | Teesta | Teesta/ Brahmaputra | North | NA | NA |
| 11 | Lachen | Teesta | Teesta/ Brahmaputra | North | NA | NA |
| 12 | Sankalang | Teesta | Teesta/ Brahmaputra | North | NA | NA |
| 13 | Melli | Teesta | Teesta/ Brahmaputra | South | NA | NA |
| 14 | Kalez Khola (Toyum) | Teesta | Teesta/ Brahmaputra | West | NA | NA |
| 15 | Rothak (Jorethang) | Rangit | Teesta/ Brahmaputra | West | NA | NA |
| 16 | Sagbari | Rangit | Teesta/ Brahmaputra | West | NA | NA |
| 17 | Upper Rimbi | Rangit | Teesta/ Brahmaputra | West | NA | NA |
| 18 | Cungthang Bop | Lachung Chu | Teesta/ Brahmaputra | North | NA | NA |
List of inflow forecasting sites in Sikkim
| SN | Sites | River | Sub-Basin/ Basin | District | FRL | MWL |
| 1 | Rangit 3 Dam | Rangit | Teesta/ Brahmaputra | West | NA | NA |
| 2 | Rangpo Dam | Rangpochu | Teesta/ Brahmaputra | East | NA | NA |
| 3 | Rongli Dam | Rangpochu | Teesta/ Brahmaputra | East | NA | NA |
| 4 | Teesta 3 Dam | Lachung Chu | Teesta/ Brahmaputra | North | NA | NA |
WEST BENGAL (BRAHMAPUTRA BASIN) There are 6 Level Forecasting and 15 Flood monitoring Sites in Sub-Himalayan zone of Brahmaputra Basin in West Bengal. There is no Inflow Forecasting sites in Brahmaputra Basin in West Bengal.
List of Level Forecasting Sites in West Bengal (Brahmaputra Basin)
| SN | Site | River | Sub-Basin/ Basin | District | WL | DL | HFL, M | HFL Date |
| 1 | DOMOHANI | Teesta | Teesta/ L Brahmaputra | Jalpaiguri | 85.65 | 85.95 | 89.3 | 04-10-1968 |
| 2 | Mekhliganj | Teesta | Teesta/ L Brahmaputra | Koch Bihar | 65.45 | 65.95 | 66.45 | 13-07-1996 |
| 3 | Jaldhaka NH 31 | Jaldhaka | Jaldhaka/ Lower Brahmaputra | Jalpaiguri | 80.0 | 80.9 | 81.33 | 28-08-1972 |
| 4 | Mathabhanga | Jaldhaka | Jaldhaka/ Lower Brahmaputra | Koch Bihar | 47.7 | 48.2 | 49.85 | 07-09-2007 |
| 5 | Ghugumari | Torsa | Torsa/ Lower Brahmaputra | Koch Bihar | 39.8 | 40.41 | 41.46 | 03-08-2000 |
| 6 | Tufanganj | Raidak-1 | Torsa/ Lower Brahmaputra | Koch Bihar | 34.22 | 35.3 | 36.5 | 12-08-2017 |
List of Flood Monitoring Sites in W Bengal (Brahmaputra Basin)
| SN | Site | River | Sub-Basin/ Basin | District | HFL, M | HFL Date |
| 1 | Singlabazar | Teesta | Teesta/ B’putra | Darjiling | 311.0 | 05-09-1980 |
| 2 | TEESTA BAZAR | Teesta | Teesta/ B’putra | Darjiling | 217.0 | 13-10-1973 |
| 3 | GHISH | Teesta | Teesta/ B’putra | Jalpaiguri | 164.8 | 27-07-1972 |
| 4 | CHEL | Teesta | Teesta/ B’putra | Jalpaiguri | 160.8 | 10-07-1971 |
| 5 | CORONATION | Teesta | Teesta/ B’putra | Darjiling | 156.0 | 12-10-1973 |
| 6 | SEVOKE | Teesta | Teesta/ B’putra | Darjiling | 147.3 | 12-10-1973 |
| 7 | NEORA | Teesta | Teesta/ B’putra | Jalpaiguri | 116.7 | 24-07-1970 |
| 8 | Gazoldoba | Teesta | Teesta/ B’putra | Jalpaiguri | 111.4 | 19-07-1990 |
| 9 | DIANA | Jaldhaka | Jaldhaka/ Lower B’putra | Jalpaiguri | 196.55 | 19-07-1980 |
| 10 | Nagrakata | Jaldhaka | Jaldhaka/ Lower B’putra | Jalpaiguri | 160.8 | 13-10-1978 |
| 11 | MURTI | Jaldhaka | Jaldhaka/ Lower B’putra | Jalpaiguri | 141.45 | 28-07-2007 |
| 12 | Barabisha | Sankosh | Sankosh/ Lower B’putra | Jalpaiguri | 50.1 | 13-10-1973 |
| 13 | SANKOSH LRP | Sankosh | Sankosh/ Lower B’putra | Koch Bihar | 49.25 | 09-07-2017 |
| 14 | Hasimara | Torsa | Torsa/ Lower B’putra | Jalpaiguri | 118.5 | 13-07-1996 |
| 15 | Chepan | Raidak-1 | Torsa/ Lower B’putra | Jalpaiguri | 49.15 | 13-10-1973 |
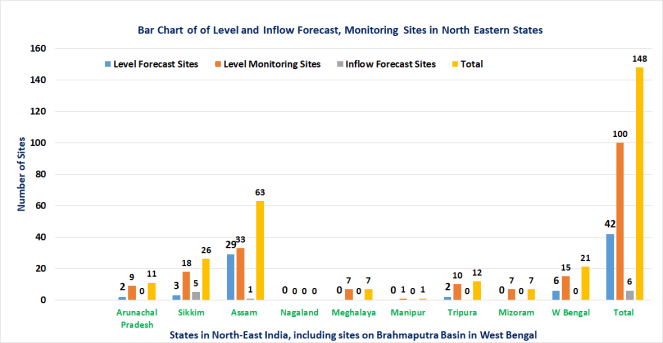
Summary The tables here shows that there are 148 Level and Inflow Forecasting and flood monitoring sites in North East India comprising of 42 Level Forecasting, 100 Flood monitoring and 6 Inflow Forecast sites. The data also reveals that out of 148 sites, 32 sites comprising of 3 Level Forecast, 24 Level monitoring and 5 Inflow Forecast Sites are inactive.

About 75 per cent of these sites are in 3 states namely Assam (63 sites), Sikkim (26) and West Bengal (Brahmaputra) 22 sites. It is also seen that there is no site in Nagaland, only 1 site in Manipur state and 7 (each) in the states of Meghalaya and Mizoram. It is also shocking that out of 26 sites in Sikkim 21 (81 per cent) sites are inactive.
Summary Table of Level and Inflow Forecast, Monitoring Sites in North Eastern States
| States | Level Forecast
Sites |
Flood Monitoring Sites | Inflow Forecast
Sites |
Total | |||
| Active | Inactive | Active | Inactive | Active | Inactive | ||
| Arunachal Pradesh | 2 | 0 | 8 | 1 | 0 | 0 | 11 |
| Sikkim | 0 | 3 | 4 | 14 | 1 | 4 | 26 |
| Assam | 29 | 0 | 31 | 2 | 0 | 1 | 63 |
| Nagaland | 0 | 0 | 0 | 0 | 0 | 0 | 0 |
| Meghalaya | 0 | 0 | 5 | 2 | 0 | 0 | 7 |
| Manipur | 0 | 0 | 1 | 0 | 0 | 0 | 1 |
| Tripura | 2 | 0 | 10 | 0 | 0 | 0 | 12 |
| Mizoram | 0 | 0 | 2 | 5 | 0 | 0 | 7 |
| W Bengal | 6 | 0 | 15 | 0 | 0 | 0 | 21 |
| NE India | 39 | 3 | 76 | 24 | 1 | 5 | 148 |
MAJOR GAPS Besides the large number of non functional sites and information gaps, there are other major gaps in CWC’s flood forecasting, some of them are listed below.
- North East being highly flood prone, CWC needs to do much more to ensure that its flood forecasts reach the people who are in flood prone areas.
- CWC has no flood forecasting sites in four full states: Manipur, Nagaland, Meghalaya and Mizoram. In the fifth, Sikkim, none of its flood forecasting sites are working. How can there be any justification for this?
- In whole of flood prone Manipur, CWC has just one monitoring site. No level or inflow forecasting sites. This is clearly hugely inadequate.
- Most of the Mizoram’s flood monitoring sites are not showing anything, this needs urgent attention. CWC also needs to add some key sites from Mizoram among its flood forecasting sites.
- CWC needs to add more sites in Tripura, considering the large number of rivers in both states
- In Arunachal Pradesh, CWC has no sites in a number of important rivers, including Dibang, Ranganadi, among others. In the huge and important Siang basin, it certainly needs many more sites than the two that CWC has.
- For all the sites, the available information should be archived for at least five years and permanently for the HFL year.
In addition, there are many other issues with respect to the actual flood forecasting and monitoring by CWC, which are not dealt here.
A SANDRP analysis (ht.sandrp@gmail.com)
To see similar zone wise overviews of CWC’s Flood Forecasting Sites, kindly explore following links:-
Overview of CWC Flood Forecasting Sites 2018: North India
Overview of CWC Flood Forecasting Sites 2018: East India
Overview of CWC Flood Forecasting Sites 2018: West India
Overview of CWC Flood Forecasting Sites 2018: South India
Overview of CWC Flood Forecasting Sites 2018: India
END NOTES:
- The sites shown with RED colour are inactive and the sites which have no WL, DL, HFL data but have active Hydro Graph are listed with GREEN color.
- Abbreviations List:
Warning Level – WL
Danger Level – DL
Full Reservoir Level – FRL
Maximum Water Level – MWL
High Flood Level – HFL
Meters – M
[I] http://india-water.gov.in/ffs/
[II] https://sandrp.in/2018/08/03/overview-of-cwc-flood-forecasting-sites-north-india/
[III] Site with same name repeated on Brahmaputra river.
[IV] Dolasar river enters in Bangladesh from there.
[V] Kolodyne river flows to Myanmar.
[VI] The site Tlawng river, which is tributary of Barak.

One thought on “Overview of CWC’s Flood Forecasting Sites 2018: North East India”