Indian media never seems to report this, but IMD (India Meteorological Department) also provides river basin wise rainfall figures for South West Monsoon, also for other seasons. As in the previous years, here is an overview of the river basin wise rainfall during just concluded SW Monsoon 2019 (June-Sept 2019, though the monsoon started withdrawing only on Oct 9 and has not yet fully withdrawn from across India as I write this on Oct 15 2019), like the way we have been doing for the last three years[i]. Our earlier monsoon 2019 articles provided monsoon over view[ii], state wise rainfall figures[iii] and Marathwada specific situation[iv].
It’s not clear why Indian media does not report river basin wise rainfall figures, since that is arguably, the most appropriate way to look at the rainfall figures, since river basins are the hydrological units and the run off from the rainfall ends up in the rivers, and creates floods many times, as happened during 2019 monsoon. There could be issues of quality of the river basin wise rainfall figures, but that is true for all IMD’s rainfall figures at some level or other.
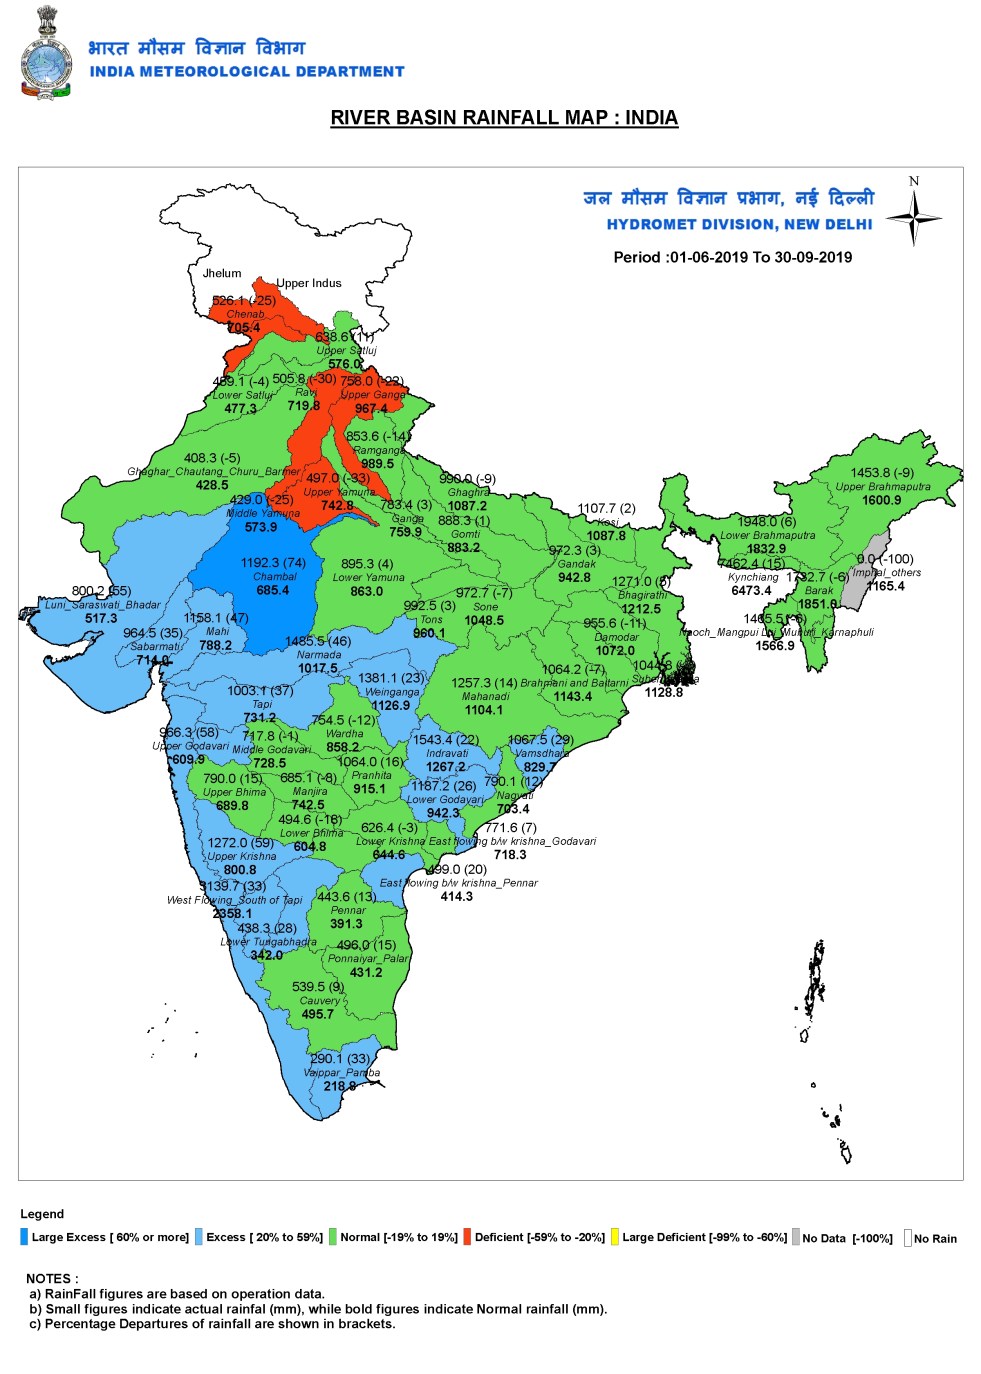
River Basin Wise Rainfall Figures These figures, in fact are more useful in understanding the hydrological implications of rainfall. For anyone working on water issues, these should be much more useful figures. Only source of the river basin wise rainfall figure is the map that IMD provides, there are several gaps here as we can see.
 IMD also provides another map, called “Spatial Rainfall Analysis”, where the map has been divided river basin wise and rainfall is given by colour code in terms of actual rainfall.

In Tables below we are reporting the sub basin wise rainfall figures for 2019 monsoon for each basin, along with normal rainfall and departure from normal. We are also key interesting highlights.
Ganga Basin IMD map divides Ganga basin into three sections (Upper Ganga Valley, Yamuna Valley and Lower Ganga Valley) and 15 sub basins.
| BASIN | Sub Basin | 2019 Monsoon Rainfall, mm | Normal Rainfall, mm | % departure of actual rainfall |
| UPPER GANGA Valley SUB BASIN | Upper Ganga | 758 | 967.4 | -9 |
| Ramganga | 853.6 | 989.5 | -14 | |
| Ghaghra | 990 | 1087.2 | -9 | |
| Gomti | 888.3 | 883.2 | 1 | |
| Ganga | 783.4 | 759.9 | 3 | |
| YAMUNA SUB BASIN | Upper Yamuna | 497 | 742.8 | -33 |
| Middle Yamuna | 429 | 573.9 | -25 | |
| Lower Yamuna | 895.3 | 863 | 4 | |
| Chambal | 1192.3 | 685.4 | 74 | |
| LOWER GANGA SUB BASIN | Sone | 972.7 | 1048.5 | -7 |
| Tons | 992.5 | 960.1 | 3 | |
| Gandak | 972.3 | 942.8 | 3 | |
| Kosi | 1107.7 | 1087.8 | 2 | |
| Damodar | 955.6 | 1072 | -11 | |
| Bhagirathi | 1271 | 1212.5 | 5 |
Two of the 15 sub basins here are categorised to have deficit rainfall: Upper Yamuna and Middle Yamuna and one sub basin is categorised as Large Surplus: Chambal basin, which saw several flood events. The worst was a national crisis due to overtopping of Gandhi Sagar Dam[v]. The lowest rainfall was in Middle Yamuna sub basin (429 mm) and the highest (1271 mm) in Bhagirathi basin, in W Bengal. Kosi (1107.7) was the third basin with over 1000 mm rainfall.
Indus Basin IMD divides Indus basin into eight sub basins, but strangely for three of the sub basins, namely Beas, Jhelum and Upper Indus, it reports no rainfall figures ever! Same situation has prevailed for several years. This is very strange and IMD need to answer as to why it does not report rainfall in these two sub basins. Moreover, there is no mention of BEAS river basin in the map. Where has IMD accounted the Beas basin rainfall?
| BASIN | Sub Basin | 2019 Monsoon Rainfall, mm | Normal Monsoon Rainfall, mm | % departure of actual rainfall |
| INDUS | Upper Sutlej | 638.6 | 576 | 11 |
| Lower Sutlej | 469.1 | 477.3 | -2 | |
| Ravi | 505.8 | 719.8 | -30 | |
| Ghaghar, Chautang, Churu, Barmer | 408.3 | 428.5 | -5 | |
| Chenab | 526.1 | 705.4 | -25 | |
| Beas | NO INFORMATION | |||
| Jhelum | NO INFORMATION | |||
| Upper Indus | NO INFORMATION | |||
Among the five sub basins for which IMD has reported rainfall figure, two sub basins were in red (Ravi, with deficit of 30% and Chenab with deficit of 25%) and none in surplus category. Lowest rainfall in absolute terms, at 408.3 mm was reported in Ghaghar basin, this basin had the lowest rainfall last year too. Upper Sutlej basin had the highest rainfall, 638.6 mm, with 11% surplus rainfall, it had surplus rainfall last two years.
North East India IMD divides North East India into six sub basins, shockingly, in one of them, “Imphal, others”, IMD reports zero rainfall. This is clearly untrue as is apparent if we see the district wise rainfall in Manipur where this sub basin in situated. Why IMD has reported ZERO rainfall for this sub basin is a mystery. In all the remaining sub basins, the rainfall in SW Monsoon 2019 has been higher than that last year.
| BASIN | Sub Basin | 2019 Monsoon Rainfall, mm | Normal Monsoon Rainfall, mm | % departure of actual rainfall |
| Brahmaputra, Barak and rest of NE India | Upper Brahmaputra | 1453.8 | 1600.9 | -9 |
| Lower Brahmaputra | 1948.0 | 1832.9 | 6 | |
| Kynichiang | 7462.4 | 6473.4 | 15 | |
| Barak | 1732.7 | 1851.0 | -6 | |
| Imphal, others | 0 | 1165.4 | -100 | |
| Naoch, Manpui Lui, Muhuli, Karnaphuli | 1465.5 | 1566.9 | -6 |
Kynichiang is the sub basin that has reported the HIGHEST rainfall of all sub basins in SW Monsoon 2019, at huge 7462.4 mm
Godavari Basin IMD map divides this basin into eight sub basins with normal rainfall varying from the lowest of 609.9 mm in Upper Godavari basin (Rain shadow area) to over double that amount in Indravati sub basin, east facing Eastern Ghats area. Indravati basin also had the highest rainfall in SW Monsoon 2019 among all the eight sub basins here.
| BASIN | Sub Basin | 2019 Monsoon Rainfall, mm | Normal Monsoon Rainfall, mm | % departure of actual rainfall |
| GODAVARI | Upper Godavari | 966.3 | 609.9 | 58 |
| Middle Godavari | 717.8 | 728.5 | -1 | |
| Wardha | 754.5 | 858.2 | -12 | |
| Manjira | 685.1 | 742.5 | -8 | |
| Pranhita | 1064 | 915.1 | 16 | |
| Wainganga | 1381.1 | 1126.9 | 23 | |
| Indravati | 1543.4 | 1267.2 | 22 | |
| Lower Godavari | 1187.2 | 942.3 | 26 |
As an be seen above, in five of the sub basins, there was above LPA rainfall this year, highest surplus of 58% in Upper Godavari sub basin. Only two sub basins had lower rainfall this year compared to last year: Wardha and Lower Godavari sub basins.
Krishna Basin IMD divides the basin into six sub basins, for the Upper Tungabhadra sub basin, the IMD river basin wise rainfall map provides no information. Lower Tungabhadra sub basin, at 342 mm, has the lowest normal rainfall not only of the Krishna basin, but also one of the lowest among all the sub basins of entire India.
| BASIN | Sub Basin | 2019 Monsoon Rainfall, mm | Normal Monsoon Rainfall, mm | % departure of actual rainfall |
| KRISHNA | Upper Bhima | 790 | 689.8 | 15 |
| Upper Krishna | 1272 | 800.8 | 59 | |
| Lower Bhima | 494.6 | 604.8 | -16 | |
| Lower Tungabhadra | 438.3 | 342 | 28 | |
| Lower Krishna | 626.4 | 644.6 | -3 | |
| Upper Tungabhadra | NO INFORMATION | |||
In 2019 monsoon, all sub basins here had higher rainfall than 2018 monsoon. The Lower Tungabhadra basin had the lowest rainfall of 438.3 mm. Upper Krishna basin, which faced massive floods in August, had the highest rainfall (1272 mm) and the highest surplus (59%) among all the sub basins here. Lower Bhima basin had the highest deficit at 16%.
West Flowing Rivers There are six rivers here, as given below, four of them are individual rivers (Sabarmati, Mahi, Narmada and Tapi) and two are composite basins (Luni-Saraswati-Bhadar and west flowing rivers south of Tapi) comprising of large number of basins. In fact to club all the west flowing rivers south of Tapi into one sub basin is clearly inappropriate and thoughtless. This must be divided into at least ten sub basins, including one for rivers of Gujarat Maharashtra, Goa, Karnataka and Kerala. Among rivers of Kerala, Periyar, Pamba and Chalakudy needs to be listed as separate sub basins. Similarly the Kali and Nethravathi sub basin of Karnataka needs to be listed as separate sub basins.
| BASIN | Sub Basin | 2019 Monsoon Rainfall, mm | Normal Monsoon Rainfall, mm | % departure of actual rainfall |
| WEST FLOWING RIVERS | Luni, Saraswati, Bhadar | 800.2 | 517.3 | 55 |
| Sabarmati | 964.5 | 714 | 35 | |
| Mahi | 1158.1 | 788.2 | 47 | |
| Narmada | 1485.5 | 1017.5 | 46 | |
| Tapi | 1003.1 | 731.2 | 37 | |
| W Flowing South of Tapi | 3139.7 | 2358.1 | 33 |
It’s amazing to see the unique situation where ALL the six sub basins here are in Surplus category. The highest surplus (55%), but lowest rainfall (800.2 mm) is from Luni-Saraswati-Bhadar sub basin of Kutch-Saurashtra and the lowest surplus (33%) and highest rainfall (3139.7 mm) in another composite basin: W Flowing rivers South of Tapi.
East Flowing Rivers The IMD map shows eleven sub basins under this composite basin, as can be seen below.
| BASIN | Sub Basin | 2019 Monsoon Rainfall, mm | Normal Monsoon Rainfall, mm | % departure of actual rainfall |
| EAST FLOWING RIVERS | Subarnarekha | 1044.8 | 1128.8 | -7 |
| Brahmani & Baitarni | 1064.2 | 1143.4 | -7 | |
| Mahanadi | 1257.3 | 1104.1 | 14 | |
| Vamsadhara | 1067.5 | 829.7 | 29 | |
| Nagvali | 790.1 | 703.4 | 12 | |
| E flowing between Krishna Godavari | 771.6 | 718.3 | 7 | |
| E flowing Between Krishna Pennar | 499 | 414.3 | 20 | |
| Pennar | 443.6 | 391.3 | 13 | |
| Ponnaiyar Palar | 496 | 431.2 | 15 | |
| Cauvery | 539.5 | 495.7 | 9 | |
| Vaippar Pamba | 290.1 | 218.9 | 33 |
Majority of sub basins here have seen higher rainfall this year compared to last year, except Subarnarekha and Brahmani-Baitarni. These are the only sub basins with below LPA rainfall. Three sub basins were in fact surplus category: Vamsadhara, E flowing rivers between Krishna and Penna and Vaippar-Pamba su basin, the last one has the lowest normal rainfall of all the sub basins. It also has the lowest actual rainfall among all sub basins, if we put Imphal-others aside.
Summary Following table provides summary situation of categories of sub basins for each of the basins as per IMD categorization of Large Deficit (over 59% deficit compared to Long Period Average (LPA)), Deficit (deficit between 19 and 59% of LPA), Normal (19% above LPA to 19% below LPA), Surplus (19 to 59% above LPA) and Large Surplus (over 59% above LPA) and ND (NO DATA).
| River Basins | Number of sub basins in category | ||||||
| LD | D | N | S | LS | ND | Total | |
| Ganga | 0 | 2 | 12 | 0 | 1 | 0 | 15 |
| Indus | 0 | 2 | 3 | 0 | 0 | 3 | 8 |
| NE India | 1 | 0 | 5 | 0 | 0 | 0 | 6 |
| Godavari | 0 | 0 | 4 | 3 | 1 | 0 | 8 |
| Krishna | 0 | 0 | 3 | 1 | 1 | 1 | 6 |
| WFR | 0 | 0 | 0 | 6 | 0 | 0 | 6 |
| EFR | 0 | 0 | 8 | 3 | 0 | 0 | 11 |
| TOTAL | 1 | 4 | 35 | 13 | 3 | 4 | 60 |
In Conclusion The reporting of river basin wise rainfall figures is surely useful, but IMD possibly needs to be a bit more serious about this. One hopes that IMD will develop this further and break the larger river basins into smaller sub basins, so that the figures are more useful for all kind of hydrological assessments and even disaster management and preparedness. We also hope media will start using these figures, rather than reporting only state and sub division figures.
Unfortunately, map is the only source of figures for River wise rainfall and some of the figures on the map are not readable. IMD should possibly provide the figures also in tabular form. It should also provide the area for each of the sub basin that it has taken into calculation so that if someone wants to calculate the rainfall for say Ganga Basin as a whole, it can be done. Currently it is not possible and IMD also does not provide these figures for larger basins.
SANDRP (ht.sandrp@gmail.com)
END NOTES:
[i] https://sandrp.in/2016/10/13/welcome-development-river-basin-wise-rainfall-maps-from-imd/, https://sandrp.in/2017/10/18/river-wise-rainfall-in-monsoon-2017/,
https://sandrp.in/2018/10/20/river-wise-rainfall-in-monsoon-2018/
[ii] https://sandrp.in/2019/10/01/surplus-2019-monsoon-in-india-proves-imd-and-skymet-wrong/
[iii] https://sandrp.in/2019/10/04/monsoon-2019-state-wise-rainfall/
[iv] https://sandrp.in/2019/10/07/marathwada-in-times-of-2019-surplus-sw-monsoon/
[v] https://sandrp.in/2019/09/24/man-made-national-crisis-that-gandhi-sagar-dam-faced-in-sept-2019/
