Feature image probably shows flooded human habitation along Cheyyeru river after Annamayya project failure on Nov. 19. However, caption of image published in Deccan Herald report does not mention it.
India has been witnessing unusual monsoon rains in 2021. First the delay in South West Monsoon[i] withdrawal till third week of October 2021 brought heavy rainfalls in several states of North India in the first half of October 2021. Then the extreme rainfall spells during North East Monsoon[ii] have caused floods in several parts of south India in quick succession in November 2021.
In October 2021, the all India rainfall has been 33% above normal while November rainfall being record breaking 86% above normal. The formation and interactions between low depressions and western disturbances largely contributed in record breaking rainfall events during this period including the onset of La Nina phenomena.
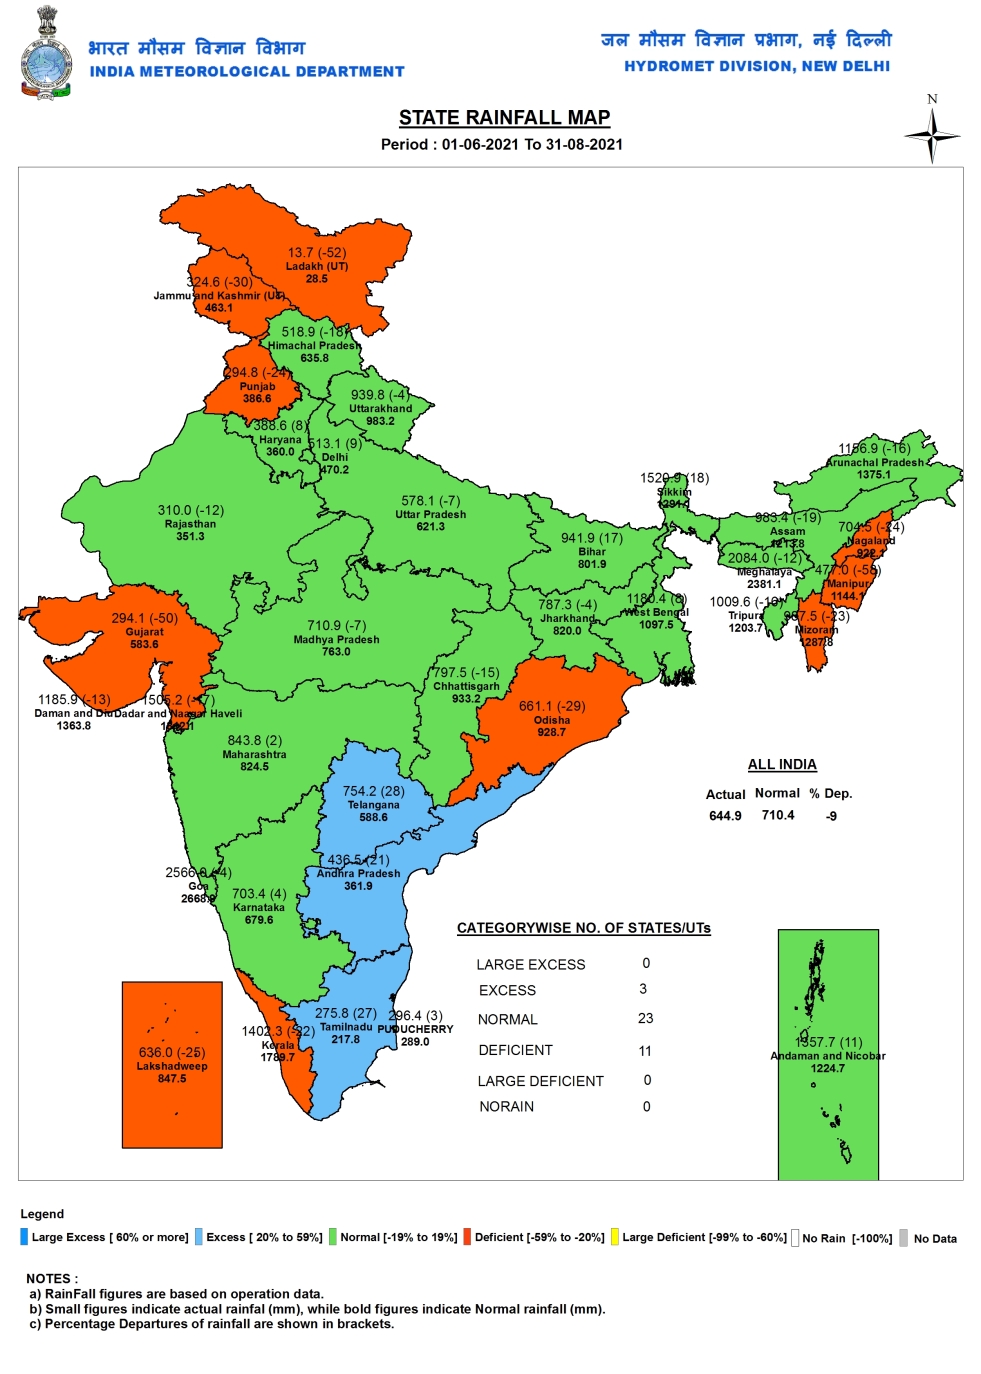
In the just concluded month of August 2021, the rainfall in India was a massive 24.13% below normal. Actual rainfall was 195.9 mm, compared to normal rainfall of 258.2 mm, as per figures from India Meteorological Department (IMD). Contrast this with the rainfall in August last year, at 327 mm, was 26.6% above normal, ,and 44 year high. Even in July 2021, the rainfall was much higher at 266.1 mm, 6.73% below normal. In June 2021, the rainfall was 182.9 mm (10.96% above normal), not much below the August 2021 rainfall, when August is supposed to have much higher rainfall than June.
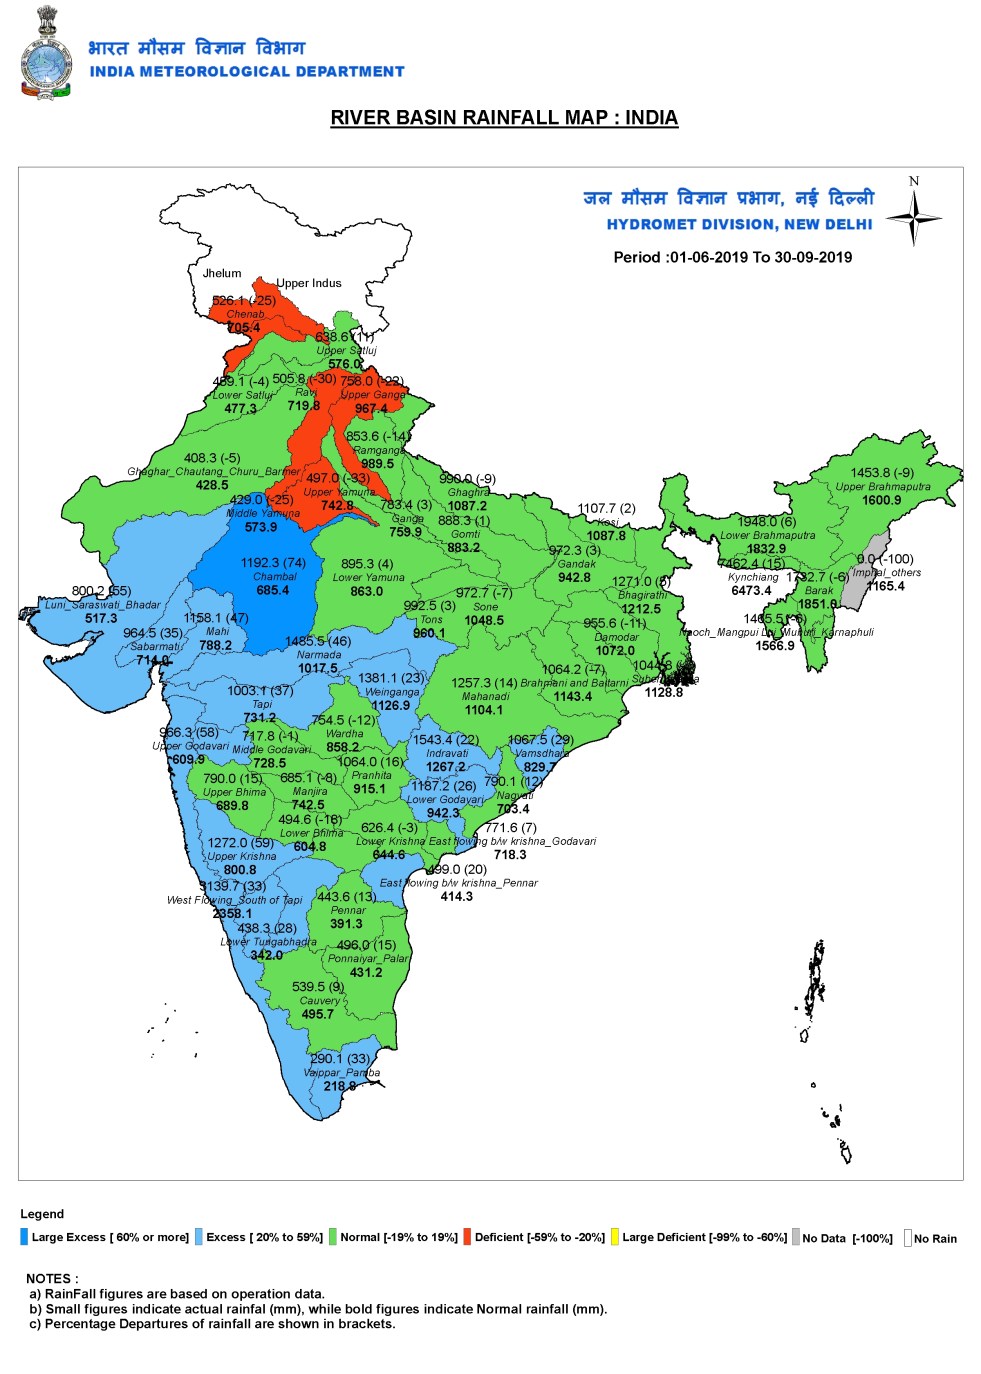
Indian media never seems to report this, but IMD (India Meteorological Department) also provides river basin wise rainfall figures for South West Monsoon, also for other seasons. As in the previous years, here is an overview of the river basin wise rainfall during just concluded SW Monsoon 2019 (June-Sept 2019, though the monsoon started withdrawing only on Oct 9 and has not yet fully withdrawn from across India as I write this on Oct 15 2019), like the way we have been doing for the last three years[i]. Our earlier monsoon 2019 articles provided monsoon over view[ii], state wise rainfall figures[iii] and Marathwada specific situation[iv].
It’s not clear why Indian media does not report river basin wise rainfall figures, since that is arguably, the most appropriate way to look at the rainfall figures, since river basins are the hydrological units and the run off from the rainfall ends up in the rivers, and creates floods many times, as happened during 2019 monsoon. There could be issues of quality of the river basin wise rainfall figures, but that is true for all IMD’s rainfall figures at some level or other. Continue reading “River Wise Rainfall in Monsoon 2019”→
Two interesting orders from National Green Tribunal (NGT) marked important developments on water-environment issues this week. NGT asking for PERFORMANCE AUDIT of pollution Control Mechanism is indeed long overdue necessity, considering the complete, abject failure of the pollution control mechanism in India. The hopes of effective action, like in the past, however, were dashed since CPCB, which is PART OF THE PROBLEM has been asked to do the audit. An independent audit, in addition to one possibly by CAG may have helped. https://www.thehindu.com/news/cities/Delhi/ngt-slams-state-pollution-bodies/article26008687.ece (17 Jan. 2019)
Whatever positive signs were available by this order were further dashed by another NGT order in which it declared that EIAs (Environmental Impact Assessment) reports are already taking climate change into account, while the tribunal dismissed a petition asking that all development activities be screened/ regulated keeping climate change in mind.
This is totally WRONG contention. Just to illustrate, SANDRP has been pointing out to the EAC, MoEF and the developers how the EIAs of dams and hydropower projects are ignoring the climate change related issues and impacts. In response the consultants and developers have responded, approved by the silent or spoken nods by the EAC and MoEF that these were not even part of their TORs! One only wishes NGT was most discerning before making such claims and would have gone through a few EIAs to see if at all EIAs are dealing with these issues with any rigour or credibility. https://www.business-standard.com/article/pti-stories/climate-change-already-covered-under-environment-impact-assessment-ngt-119011600897_1.html (16 Jan. 2019)
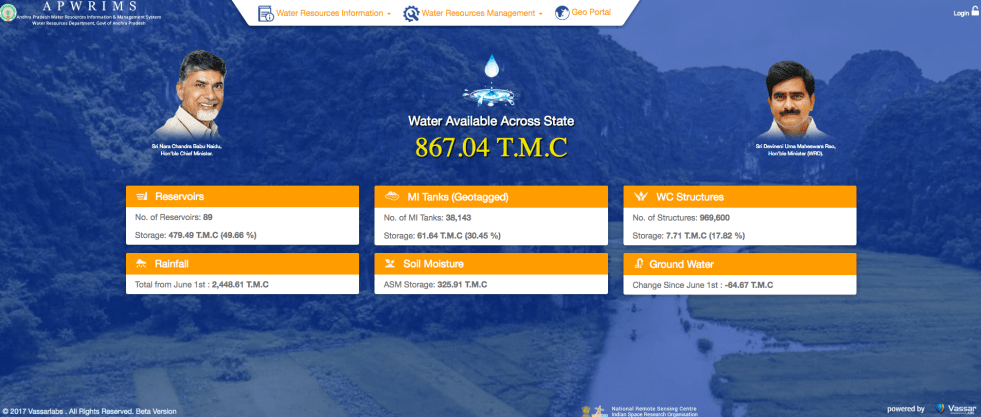
Andhra Pradesh Water Resources Information and Management System[i] is truly impressive water information system, possibly not available in any other state or even at national level, at any time in India. The comprehensiveness of the water information system is striking, as it not only includes reservoir water storages of Major and Medium Projects, but also storages in minor projects, minor tanks, water conservation structures (check dams, percolation tanks) but also groundwater and most importantly, soil moisture. These are collected in real time from diverse information sources including on ground measurements, satellite based assessments and also sent via mobile apps from diverse sources. And the information is put out in real time, along with number of analysis. The data are collated and analysed using tools from Vassar Labs, like Machine learning, Artificial Intelligence and big data. Continue reading “APWRIMS: Impressive Water Information System of Andhra Pradesh”→
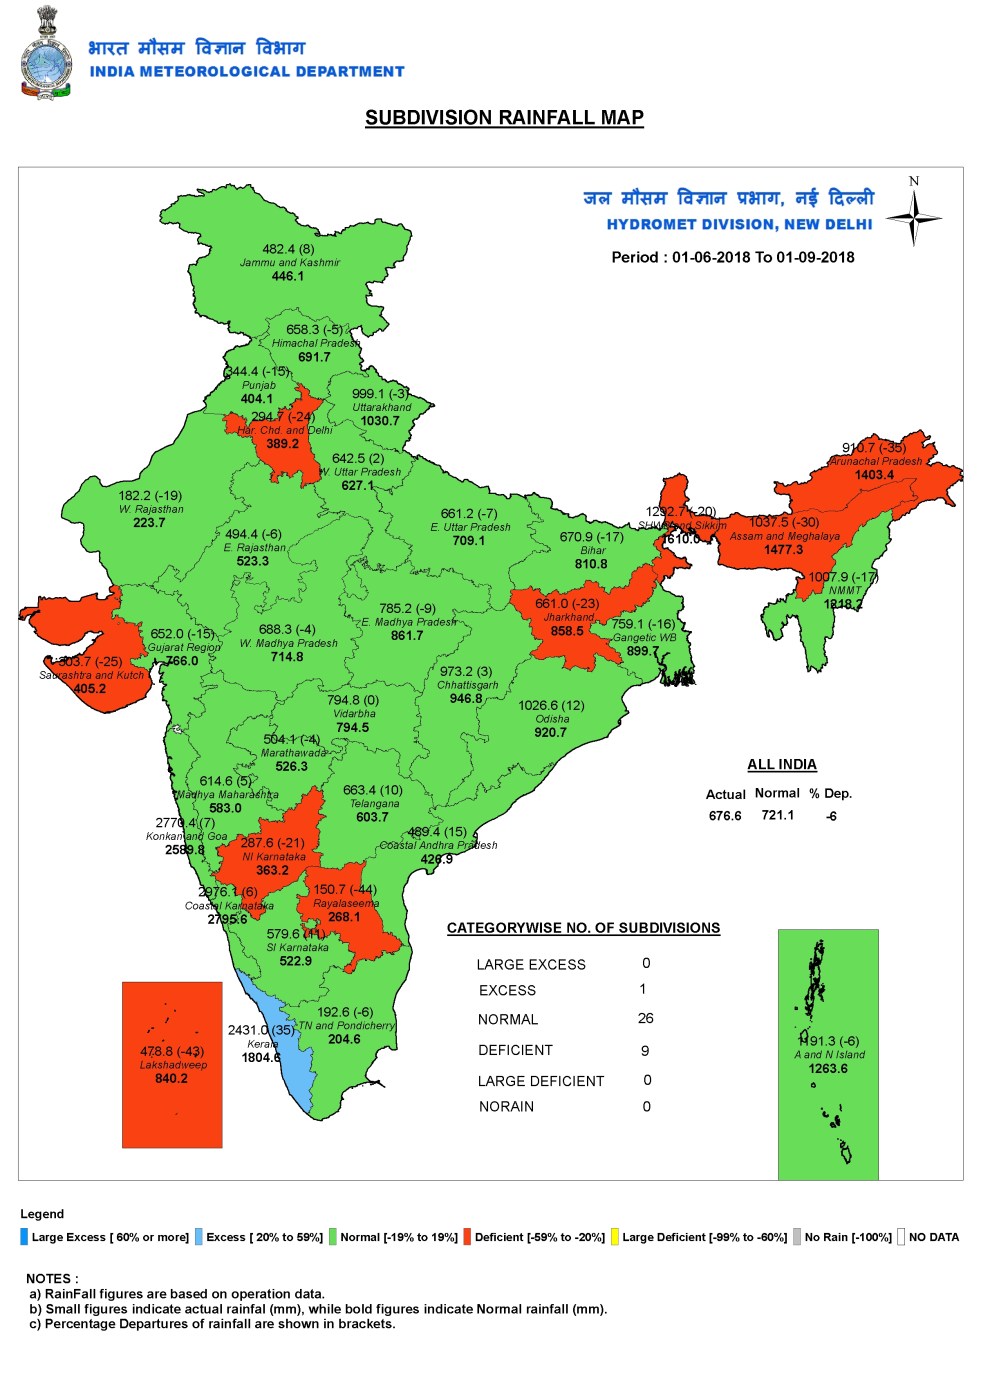
According to IMD, India is having normal monsoon this year, so far, as per rainfall till date (Sept 1, 2018). Against normal rainfall of 721.1 mm, India has received 676.6 mm rainfall, which is 6.2% below normal, considered within normal rainfall definition as per IMD. So India is having normal monsoon rainfall, says IMD. Let us check this against some ground realities.
However, East and North East India, one of the four regions for which IMD provides rainfall data, has so far had 27% below normal rainfall, while South India had 9% surplus rainfall. Thus, while at all India level, what seems all normal, is average of different, though serious departures from normal rainfall. Let us say this is first level of mirage of normal rainfall. Continue reading “The mirage of normal monsoon”→
Central Water Commission is the only agency doing flood forecasting in India. As per CWC’s Flood Forecasting website[i] the Data Flow Map has information about 226 Flood Forecast Sites in the country comprising of 166 Level Forecast Sites and 60 Inflow Forecast Sites. It also monitors 700 Flood sites, information made available through List Based Exploration and Hydrograph View, but no flood forecasting is done for these sites.
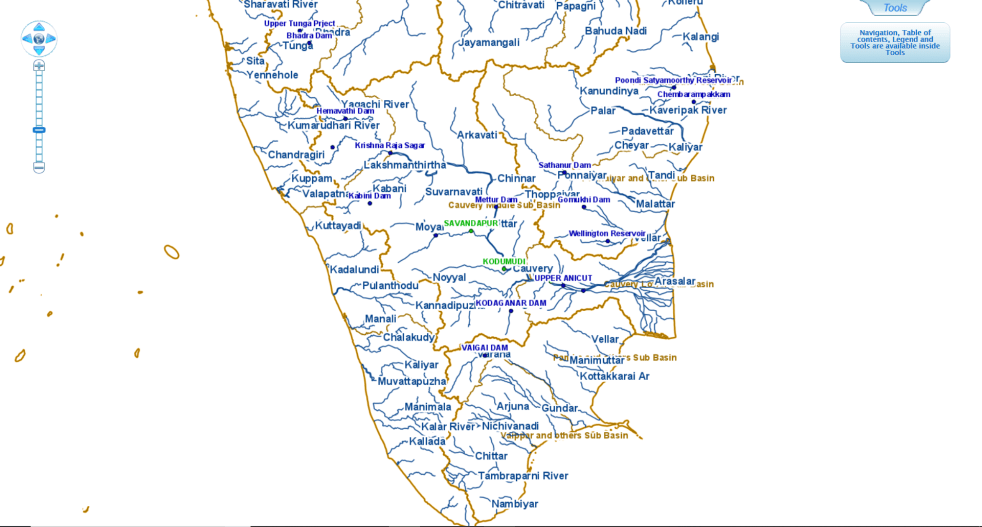
In order to better understand the CWC’s flood monitoring and forecasting work, in this article, we have given an overview of CWC’s flood forecasting and monitoring sites in South India. It includes state wise list of CWC’s Level Forecast, Inflow Forecast and level monitoring sites in South India. Similar report has been published for North India[ii] and North East India[iii] andEast India[iv].
Tamil Nadu There are 3 Level Forecasting, 48 Level Monitoring and 14 Inflow Forecasting sites in Tamil Nadu State. Out of total 65 sites, 19 Level Monitoring and 2 Inflow Forecasting sites are inactive. MWL information is given only for 1 Inflow Forecasting site out of 14. IRRUKKANKUDI, Sathanur and Gomukhi sites are repeated with incomplete information. Out of 48, HFL figure and date is not provided for 25 Level Monitoring sites.
Reliable data and information that is both correct and validated on ground, is a pre requisite to understand any feature or activity. And for a river, a constantly evolving and truly complex entity, it becomes even more crucial. The wellness quotient of rivers, their present health status, all these and more can only be understood, once we have the rudimentary knowledge of the river and the basins that they form.
A step in this direction has been taken up by the India WRIS (Water Resources Information System) project (A joint venture between Central Water Commission and Indian Space Research Organisation), that aims “to provide a ‘Single Window Solution’ for water resources data & information in a standardized national GIS framework”[i]. This project has generated 20 basin level reports that share important information on the salient features of the basin, their division into sub basins, the river systems that flow through it and the water resource structures, such as irrigation & hydro electric projects in the basin. Another crucial inclusion is the length of major rivers in each basin, which have been GIS calculated (Geographic information system)[ii] and in a few reports the place of origin of the rivers too is mentioned. (Ganga Basin Report). This is an improvement over the earlier documented river lengths that included the canal length along with the river lengths, in earlier CWC documents (e.g. water and related statistics)!
The Basin reports include basin level maps which also show the proposed inter basin transfer links and the major water resource structures & projects. Individual maps at the sub basin level mark the rivers & their watersheds. The report gives details on the topography, climate, the land use / land cover area , and also the information on hydro meteorological stations like groundwater observation cells, flood forecasting sites and even water tourism sites.
These reports can be downloaded from the WRIS site.[iii]
The reports are an attempt to document the water resources data & information for a better and more integrated planning, at the basin level. A table below tabulates some important parameters from the 20 basin reports.
Missing Dams! It can be seen from table on next page that total number of dams in all the 20 basins come to 4572. Assuming that this includes all the completed large dams in India by Dec 2013 (WRIS report is dated March 2014), if we look at the number of large dams in India as in Dec 2013 in the National Register of Large Dams (NRLD), the figure is 4845. This leaves a difference of 273 large dams, which are missing from the WRIS list! This seems like a big descripancy. Unfortunately, since NRLD gives only statewise list and does not provide river basin wise list and since WRIS list provides only river basin wise list and does not provide the names of districts and states, it is not possible to check which are the missing dams, but WRIS need to answer that.
Sub Basins These 20 basins have been further delineated into a number of sub basins. The sub basins details include the geographical extent of the sub basin, the rivers flowing in it, the states that they travel through, number and size range of watersheds and also the details of dams, weirs, barrages, anicuts, lifts & power houses, accompanied by maps at this level. The irrigation and hydro electric projects in the area are detailed and mapped for greater convenience. The sub basin list is given here to get a detailed picure.
Indus Basin Sub-basins:
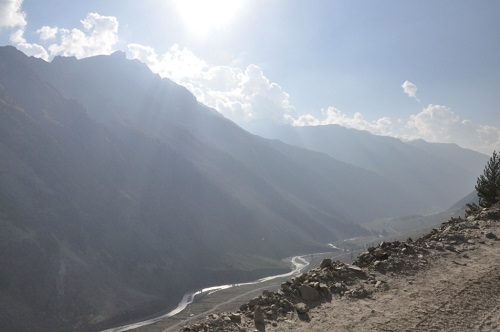
River Dras in Indus Basin in Jammu and Kashmir (Photo by Sabita Kaushal)
Beas Sub Basin
Chenab Sub Basin
Ghaghar and others Sub Basin
Gilgit Sub Basin
Jhelum Sub Basin
Lower Indus Sub Basin
Ravi Sub Basin
Shyok Sub Basin
Satluj Lower Sub Basin
Satluj Upper Sub Basin
Upper Indus Sub Basin
S. No
River Basin
Major river
No. of sub basins
No. of watersheds
No. of water resource structures
No. of water resource projects
Irrigation
Hydro Electric
Dams
Barrages
Weirs
Anicuts
Lifts
Power Houses
Major
Medium
ERM*
1
Indus (Upto border)
Indus (India)
11
497
39
13
18
0
45
59
30
40
21
55
2a
Ganga
Ganga
19
980
784
66
92
1
45
56
144
334
63
39
b
Brahmaputra
Brahmaputra (India)
2
180
16
17
5
0
4
21
9
13
3
17
c
Barak & others basin
Barak
3
77
4
3
0
0
0
3
0
6
3
3
3
Godavari
Godavari
8
466
921
28
18
1
62
16
70
216
6
14
4
Krishna
Krishna
7
391
660
12
58
6
119
35
76
135
10
30
5
Cauvery
Cauvery
3
132
96
10
16
9
24
16
42
3
15
6
Subernarekha
Subernarekha & Burhabalang
1
45
38
4
12
0
0
3
5
34
0
1
7
Brahmani & Baitarni
Brahmani & Baitarni
2
79
61
5
4
1
0
1
8
35
4
1
8
Mahanadi
Mahanadi
3
227
253
14
13
0
1
6
24
50
16
5
9
Pennar
Pennar
2
90
58
0
1
2
0
1
7
14
0
1
10
Mahi
Mahi
2
63
134
0
4
0
0
3
10
29
3
2
11
Sabarmati
Sabarmati
2
51
50
2
10
0
0
0
9
11
4
–
12
Narmada
Narmada
3
150
277
2
2
0
4
9
21
23
1
6
13
Tapi
Tapi
3
100
356
8
11
0
13
2
13
68
2
1
14
WFR Tapi to Tadri
Many independent rivers flowing
2
96
219
0
3
0
1
18
13
15
1
12
15
WFR Tadri to Kanyakumari
3
92
69
6
6
4
0
29
19
12
7
21
16
EFR Mahanadi_ Pennar
4
132
64
5
12
12
0
0
12
46
10
0
17
EFR Pennar _ Kanyakumari
4
165
61
2
2
11
0
6
13
33
4
5
18
WFR Kutch _ Saurashtra
Luni
6
268
408
1
10
0
0
0
8
100
4
15
19
Area of inland drainage in Rajasthan
Many independent rivers flowing
–
–
1
0
0
0
48
0
11
1
1
0
20
Minor rivers draining into Myanmar(Burma) & Bangladesh
Many independent rivers flowing
4
54
3
5
0
0
3
–
3
4
1
–
Total
94
4335
4572
203
335
* Extension, Renovation and Modernization ** Data has been accumulated from the individual Basin Reports from India WRIS[iv]
Ganga Basin
Yamuna Lower
Yamuna Middle
Yamuna Upper
Chambal Upper
Chambal Lower
Tons
Kosi
Sone
Ramganga
Gomti
Ghaghara
Ghaghara confluence to Gomti confluence
Gandak & others
Damodar
Above Ramganaga Confluence
Banas
Bhagirathi & others ( Ganga Lower)
Upstream of Gomti confluence to Muzaffarnagar
Kali Sindh and others up to Confluence with Parbati
Brahmaputra Basin It is strange to see that the profile divides this huge basin into just two sub basins, when it could have easily divided into many others like: Lohit, Kameng, Siang, Subansiri, Tawang, Pare, Teesta, Manas, Sankosh, among others.
Brahmaputra Lower
Brahmaputra Upper
Barak & Others Basin
Barak and Others
Kynchiang & Other south flowing rivers
Naochchara & Others
Godavri Basin
Wardha
Weinganga
Godavari Lower
Godavari Middle
Godavari Upper
Indravati
Manjra
Pranhita and others
Krishna Basin
Bhima Lower Sub-basin
Bhima Upper Sub-basin
Krishna Lower Sub-basin
Krishna Middle Sub-basin
Krishna Upper Sub-basin
Tungabhadra Lower Sub-basin
Tungabhadra upper Sub-basin
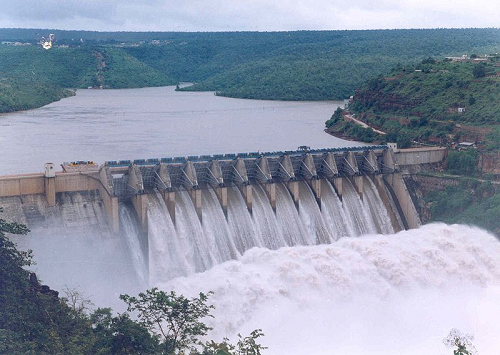
Srisailam Dam on Krishna River (Source: Wikipedia)
Cauvery Basin
Cauvery upper
Cauvery middle
Cauvery lower
Subernarekha Basin No sub-basins.
Brahmani & Baitarani Basin
Brahmani
Baitarani
Mahanadi Basin
Mahanadi Upper Sub- basin
Mahanadi Middle Sub- basin
Mahanadi Lower Sub- basin
Pennar Basin
Pennar Upper Sub-basin
Pennar Lower Sub-basin
Mahi Basin
Mahi Upper Sub-basin
Mahi Lower Sub-basin
Sabarmati Basin
Sabarmati Upper Sub- basin
Sabarmati Lower Sub-basin
Narmada Basin
Narmada Upper Sub-basin
Narmada Middle Sub-basin
Narmada Lower Sub-basin
Tapi Basin
Upper Tapi Sub- Basin
Middle Tapi Sub- Basin
Lower Tapi Sub- Basin
West flowing rivers from Tapi to Tadri Basin
Bhastol & other Sub- basin
Vasisthi & other Sub- basin
West flowing rivers from Tadri to Kanyakumari Basin
Netravati and others Sub- basin
Varrar and others Sub- basin
Periyar and others Sub- basin
East flowing rivers between Mahanadi & Pennar Basin
Vamsadhara & other Sub- basin
Nagvati & other Sub- basin
East Flowing River between Godavari and Krishna Sub- basin
East flowing River between Krishna and Pennar Sub- basin
East flowing rivers between Pennar and Kanyakumari Basin
Palar and other Sub-basin
Ponnaiyar and other Sub-basin
Vaippar and other Sub-basin
Pamba and other Sub-basin
West Flowing Rivers of Kutch and Saurashtra including Luni Basin
Luni Upper Sub-basin
Luni Lower Sub-basin
Saraswati Sub-basin
Drainage of Rann Sub-basin
Bhadar and other West Flowing Rivers
Shetrunji and other East Flowing Rivers Sub-basin
Area of inland drainage in Rajasthan Due to very flat terrain and non-existence of permanent drainage network, this basin has not been further sub divided.
Minor rivers draining into Myanmar and Bangladesh
Imphal and Others sub basin
Karnaphuli and Others sub basin
Mangpui Lui and Others sub basin
Muhury and Others sub basin
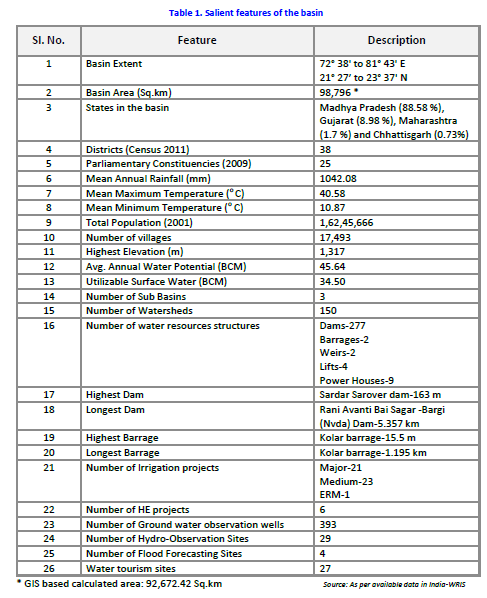
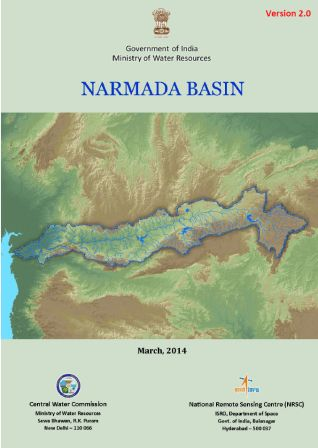
Narmada Basin: Some details To understand the compiled information at the basin level, we take a look at the one of the basin level reports, the Narmada Basin Report[v] (dated March 2014) as an illustrative example. An overview of the basin area right at the beginning, gives its geographical location, shape, size, topography, climate & population. This basic relevant information is tabulated in a concise table for easy access, as given below:
Salient Features of Narmada Basin from WRIS Basin Report
River information The major river flowing in the basin, the Narmada River (also called Rewa) that flows through the 3 states of Madhya Pradesh, Maharashtra & Gujarat, its length (1333 km) and the length of its 19 major tributaries out of a total of 41 is given, based on GIS calculations. There is also a clear river network map of the Narmada basin that demarcates the 3 sub basins along with the watersheds, and shows the dams / weirs /barrages and the rivers in the basin.
Narmada Basin Report Cover Page (Source: WRIS)
Narmada Upper Sub-Basin, with 16 watersheds
Narmada Middle Sub-Basin, having 63 watersheds
Narmada Lower Sub-Basin, with 71 watersheds
The surface water bodies details include the size (less than 25 ha to more than 2500 ha) and type (Tanks, lakes, reservoirs, abandoned quarries or ponds) of existing bodies. Nearly 91.8% of these are tanks.
Irrigation Projects The water resource projects in the basin are as follows:
21 Major Irrigation Projects
23 Medium Irrigation Projects
1 ERM Project
6 Hydro-Electric Projects
Interestingly description is only of the major and medium irrigation projects, information on minor projects is completely absent. An attempt to include the details of minor irrigation projects would have made the report more useful. The reports seem to not understand the significance of the smaller projects and their importance for the people and in the conext of the River Basin too.
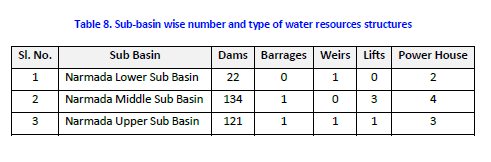
Water resource structures The number and type of big manmade structures in the basin is given. These are a total of 277 dams, 2 barrages, 2 weirs and 4 lifts, of which again the major structures are marked on a map, and details given as in table below. Dams are classified on the basis of storage and purpose they are used for, and the dam numbers are available at sub basin level.
Narmada Sub Basin details from WRIS Basin Report
The report gives tabulated data for each of the dams, which is supposed to have name of the river, height, length, purpose, year of commissioning, etc. Since GIS is the strength of ISRO, they could have easily given latitude and longitudes of each dam, but they have not. Shockingly, in case of 186 of the dams, name of the river on which it is built is given as ‘Local Nallah’, and in case of 10 they have left the column blank. This means for nearly 71% (196 out of 277) of the dams they do not even know the name of the river they are build on. This is actually an improvement over the performance of CWC. The CWC’s National Register of Large Dams[vi], we just checked, mentions Narmada only 13 times (for 12 dams of Gujarat and 1 dam of Madhya Pradesh).[vii]
It is well known that Narmada Basin is the theatre of India’s longest and most famous anti dam movement, Narmada Bachao Andolan. The movement involves opposition to Sardar Sarovar, Indira Sagar, Omkareshwar, Maheshwar, Jobat dams, among others. Such social aspects should also form part of any river basin report.
Surface water quality There are 19 surface water quality observation sites in the basin, that collect water data and the report spells out , “As compared to the other rivers, the quality of Narmada water is quite good. Even near the point of origin, the quality of river water was in class ‘C’ in the year 2001 while it was in class ‘B’ in earlier years. As was observed for most other rivers, in case of Narmada also, BOD and Total Coliform are critical parameters.” This shows that even in Narmada Basin, water quality is deteriorating. The statement also remains vague in absence of specifics.
Inter basin transfer links Details of the Par-Tapi-Narmada Link, which is a 401 km long gravity canal and its proposal to transfer 1,350 MCM (Million Cubic metre) of water from ‘surplus rivers’ to ‘water deficit’ areas is given, along with a map. How has the conclusion of surplus or deficit been reached? Does the assessment exhaust all the options including rainwater harvesting, watershed development, groundwater recharge, better cropping patterns and methods, demand side management, optimising use of existing infrastructure, etc? Is this is the least cost option? Does the water balance include groundwater? Who all will be affected by this or even how much land area will be affected by this proposal, there is absolutely no talk of this? No answers in the report.
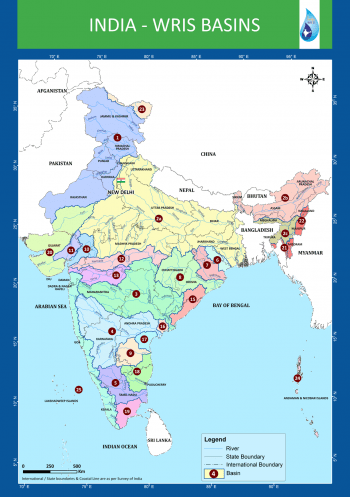
India River Basins Map (Source – WRIS)
There’s more to a river There is no information in basin reports on the regulating or statutory bodies that have a say in the basin in the report. However, some information on the existing organisations and inter-state agreements at the various basin level is given at another WRIS location.[viii]
The Basin reports for 20 basins are clearly an asset for understanding and analysing water resource situation. However, there is no mention of the numerous ecological, social and environmental services these rivers provide us with. The demographic details of the basin are available, but there is no information on the flora and fauna, who also need and thrive on the river waters. A good navigation tool for water resource information and river management projects at basin level, nevertheless, for a broader and more comprehensive outlook these reports should have included the following essential aspects too:
River status: The present water quality & pollution level of the major rivers as well as their tributaries
River governance: The local committees, civil bodies and institutions that play a role in river basin development
River safety measures: Effect of the existing and planned river management projects on the state of the river, people and society.
River ecology: Status of biodiversity, and other ecological aspects of the rivers