
Though South West Monsoon has not even started withdrawing from India, the IMD (India Meteorological Department) Press Release on Sept 30, 2019[i] has rather bureaucratically declared: “The 2019 southwest monsoon season comes to end with above normal seasonal (June to September) rainfall.” Why should the monsoon shop be closed even as the monsoon has refused to start withdrawing? May be the IMD was not happy that the SW Monsoon 2019 proved it so wrong, again!
IMD had repeatedly, no less than three times (on April 15, May 31 and Aug 1) predicted that June-Sept Rainfall will be 96% of Long Period Average (LPA) rainfall of 880.6 mm, but the actual rainfall was 968.3 mm or 110% of LPA, way ahead of the error margins. The rainfall has been the highest since 1994, when it was 1001.6 mm. Monsoon rainfall has this year been higher than IMD forecast for the first time since 2013. The private forecaster, Skymet, was in fact even more wrong as it had predicted that rainfall at all India level will be 93% of LPA.[ii]
Even regional rainfall distribution has proved IMD forecasts wrong in most cases, except for North East and North West India where the actual rainfall was within error margin of the forecast rainfall. Similarly, IMD’s forecast for July rainfall, August Rainfall and Aug-Sept rainfall, were all proved wrong by the actual rainfall.
Nature of 2019 monsoon Indian Express on Oct 5, 2019 reported, quoting IMD Sources that number of extreme rainfall events during 2019 monsoon were:
| 2015 | 2016 | 2017 | 2018 | 2019 | |
| June | 70 | 28 | 36 | 64 | 52 |
| July | 110 | 93 | 106 | 117 | 161 |
| Aug | 57 | 76 | 90 | 96 | 282 |
| Sept | 20 | 29 | 29 | 41 | 68 |
| TOTAL | 257 | 226 | 261 | 318 | 563 |
The report says there is no standard definition of Extreme Rainfall events. Above table shows that the 2019 monsoon had huge number of such events.
IMD defines very heavy (over 12 cm in 24 hours) and extremely heavy (over 25 cm in 24 hours) rainfall events. The report says the number of incidents of very heavy rainfall events, including extremely heavy rainfall events in 2010 monsoon were over 2600 compared to 2181 in 2018 and fewer earlier.
“Climate change will not manifest as a slow and smooth change in temperature or rainfall but rather in the form of an increase in the number and intensity of extreme events. And these increases are not likely to be smooth and incremental. These would be erratic, and that is what we seem to be witnessing,” said Govindasamy Bala, professor at the Centre for Atmospheric and Oceanic Sciences at Indian Institute of Science in Bengaluru.
“There was a cooling of the eastern equatorial Indian Ocean, below Sumatra, and that could have some role to play in the kind of rainfall that we have seen this year,” J Srinivasan, distinguished scientist at the Divecha Centre for Climate Change at IISc in Bengaluru said. One of the poles of the Indian Ocean Diploe is located in the Arabian Sea while the other is in the Indian Ocean, south of Indonesia. The Indian Ocean Dipole is said to be positive when the western pole is warmer than the eastern one, and negative when it is cooler.
Many scientists like to describe the monsoon in terms of the movement of the Intertropical Convergence Zone, or ITCZ, a region near the Equator where the trade winds of the northern and southern hemispheres come together. During the monsoon season, this ITCZ is located over the Indian subcontinent. By September, as the temperature begins to go down, the ITCZ starts moving southwards of the Indian landmass, towards the equator, and further into the southern hemisphere. (https://indianexpress.com/article/explained/india-monsoon-rainfall-bihar-patna-floods-6054167/)
But let us come back to the core purpose of this article: Take stock of the June-Sept 2019 rainfall, all based on IMD figures. We hope to provide state wise rainfall figures in SW Monsoon 2019 in the next article and river basin wise rainfall in the third one.
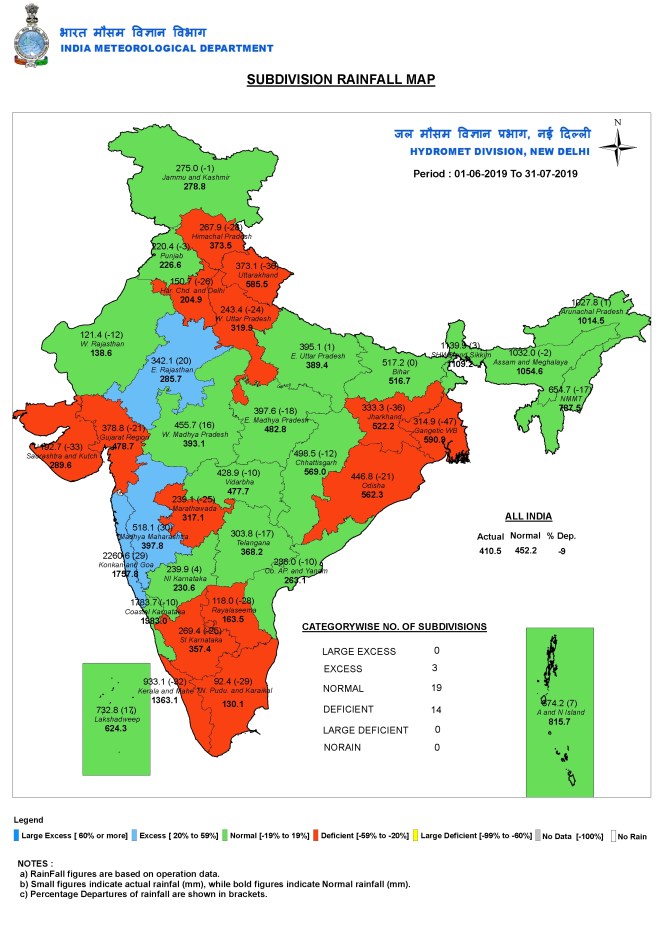
Month wise rainfall The first month of the SW monsoon 2019 saw huge deficit of 33%. The map below shows that in case of 30 of the 36 IMD subdivisions, the rainfall was in deficit or large deficit.
 July saw 5% above normal monsoon, but that was not good enough and the cumulative rainfall even at the end of July was 9% below normal. As can be seen from map below, on July 31, 14 of the 36 sub divisions were still in red.
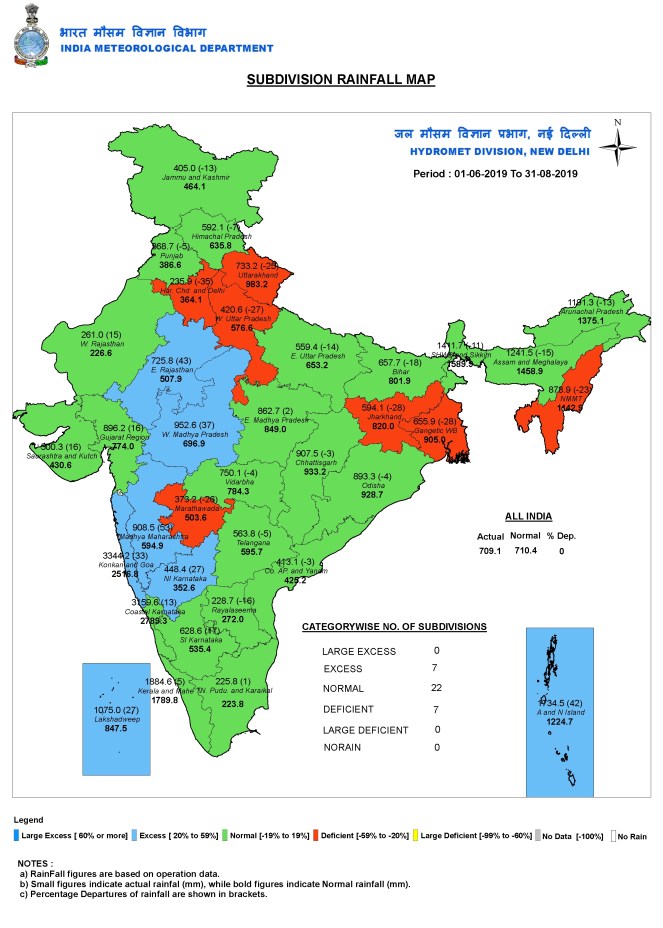
August rainfall was 15% above normal, the cumulative rainfall as on 31st Aug, 2019 was still 1.3 mm below normal. The IMD map still have seven subdivisions in red on Aug 31, 2019. This is the highest August Rainfall since 1996, when it was 19% above normal.
It was September rainfall, 102 year high (in 1917 it was 65% above normal, it was a La Nina year, unlike this year where there is no La Nina) at 53% above normal (second highest recorded Sept rainfall) rain that pushed the cumulative monsoon rainfall 10 above normal. Since 1931, as per IMD, it has never happened that when June ends up with above 30% rainfall deficit and monsoon rainfall is not below normal.
State wise rainfall As we can see from map below, out of 36 states and Union Territories (UT) of India, one (Dadar and Nagar Haveli got 68% above LPA)) received Large Excess (more than 59% above LPA) rainfall, 11 received Excess (20-59% above LPA) rainfall, 20 received normal (Between 19% above to 19% below LPA) rainfall and four received deficit (20-59% below LPA) rainfall. The four deficit rainfall states were: Manipur (56% below normal), Haryana (42%), Delhi (35%) and Jammu & Kashmir (21%).

Out of 20 states that have normal rainfall, 13 have received below LPA rainfall and for nine of them the deficit is 10% or more: W Bengal, Jharkhand, Uttarakhand, Himachal Pradesh, Chandigarh, Assam, Arunachal Pradesh, Nagaland, Mizoram, all in North, East and NE India.
Among the 11 excess rainfall states, some states with high excess include: Madhya Pradesh (44% above LPA), Rajasthan (40%), Gujarat (43) and Andaman and Nicobar Islands (41%).
Some of the states with the highest rainfall included: Goa (3917.6 mm), Dadar-Nagar Haveli (3622.8 mm), Meghalaya (2431.8 mm) and Andaman & Nicobar (2331.3 mm). Some of the states with the lowest rainfall included: Haryana (255.2 mm), Delhi (378.1 mm), Tamil Nadu (401.6 mm), Punjab (444.3 mm) and Jammu & Kashmir (445.8 mm).
Sub Division wise rainfall IMD divides the country into 36 meteorological sub divisions and provides a map showing the rainfall in each sub division, along with normal rain and % departure from normal rains. As we can see from the map below, two sub divisions (Saurashtra and Kutch-66% above LPA & West Madhya Pradesh-61% above LPA) had large excess rain, ten sub divisions had Excess rain, 19 sub divisions had normal rain and five sub divisions had deficit rain.

All five deficit sub divisions are either from North India (Jammu & Kashmir, Haryana-Chandigarh-&-Delhi (42% below normal) and West Uttar Pradesh (27%)), East India (Gangetic W Bengal (20% below normal) or North East India (Nagaland-Manipur-Mizoram-Tripura or NMMT 22% below normal). IMD PR of Sept 30, 2019 said about these: “The 5 sub divisions accounted about 15% of total area of the country. On an average, about 20% of area of the country receives deficient or scanty rainfall during the monsoon season.”
Among the ten regions with excess rainfall, three had rather high excess: Madhya Maharashtra (55%), Konkan & Goa (53%) and East Rajasthan (53%).
Among the 19 sub divisions with normal rainfall, six had deficit 10% or more: Jharkhand, Uttarakhand, Himachal Pradesh, Arunachal Pradesh, Assam & Meghalaya (12%) & the only one from peninsular India: Marathwada (12%). So even in this season where every one of the rest of the sub divisions in Peninsular and South India had excess rainfall, Marathwada still had 12% deficit rainfall.
Among the 36 sub divisions, four had above 2000 mm rainfall: Kerala & Mahe (2310.2 mm), Andaman & Nicobar Islands (2331.3 mm), Coastal Karnataka (3796.5 mm) and Konkan & Goa (4385.8 mm). Five regions have below 500 mm rainfall this monsoon: Haryana-Chandigarh-& Delhi (258.6 mm), West Rajasthan (315 mm), Tamil Nadu-Puducherry-&-Karaikal (401.9 mm), Jammu & Kashmir (445.8 mm) and Rayalseema (459.9 mm).
River Basin Wise Rainfall IMD also reports river basin wise rainfall, though the accuracy of the figures sometimes sounds more doubtful then rest of IMD figures. We will report about the river basin wise rainfall in greater detail in a separate blog, as we have been doing last two years, here we are just giving the map and couple of highlights.

Chambal basin is the only basin across India that has received large excess (74% above normal) rainfall during 2019 SW Monsoon in India. There are at least five basins that have received deficit rainfall: Chenab (-25%), Ravi (-30%), Upper Ganga (-22%), Upper Yamuna (-33%) & Middle Yamuna (-25%). Shockingly, IMD has no rainfall figures for Jhelum, Indus and Imphal-&-Others Basins.
CUMULATIVE RAINFALL BAR CHART – All India The bar chart below, also from IMD, provides the daily cumulative All India rainfall throughout the SW monsoon from June 1 to Sept 30, 2019, along with the normal cumulative rainfall for the respective dates. As we can see, the cumulative rainfall was below normal till around Aug 9, 2019, and starts becoming normal and above normal thereafter.
 North West India The bar chart shows that almost throughout the monsoon, the actual rainfall was always below the normal rainfall.
 East & North East India The chart in case for East & North East India shows that the gap between Normal and Actual rainfall has been even greater than that in case of NW India.

IMD notes: “During 18 of the last 19 years (2001-2019), North-East India has received seasonal rainfall less than LPA with an exception of 2007 (110% of LPA). This indicates that the seasonal rainfall over North-East India is passing through a below normal epoch like it was during early 1950s to mid-1980s.” IMD sees this as part of 30 year cycle.
Central India For Central India, the bar chart shows that the actual rainfall started becoming higher than normal from around Aug 3 onwards.
 South India The actual rainfall in case of South India went above the Normal Rainfall from Aug 10 and remained higher for the rest of the monsoon season.
 In Conclusion Jatin Singh, founder and Managing Director of Skymet explained Skymet’s failure: “Skymet has been using the Climate Forecasting System (CFS V2) global model… The El Niño this time was expected to last through the season, albeit on a weakening note. But it started collapsing after June. At the same time, the Indian Ocean Dipole (IOD) factor seems to have played a dominant role this season. IOD, by itself, is usually not considered a strong driver of the monsoon, particularly during El Niño years. Most models, including Skymet’s, underestimated its role. The IOD, right from the beginning, kept growing stronger (positive). In combination with the Madden-Julian Oscillation, as and when it visited the Indian Ocean, this enhanced the overall rainfall.” (https://indianexpress.com/article/india/bountiful-surprise-why-modis-best-monsoon-defied-all-forecasters-6049623/)
IMD could come up with the maps and figures of the SW Monsoon once the SW monsoon officially withdraws from India. IMD has forecast that the withdrawal is likely to start from Oct 10, and that will be a new record as the record so far is Oct 1. The monsoon is clearly breaking a lot of records this year. This is the new reality and we must prepared to deal with these new realities rather than just push it under the carpet of Climate Change, and say how difficult it is to forecast. The live storage capacities of the 113 reservoirs monitored by CWC is 87% filled up as per the Sept 26, 2019 CWC bulletin. Let us see how the government handles the double bounty.
SANDRP (ht.sandrp@gmail.com)
POST SCRIPT: Oct 10 2019
END NOTES:
[i] http://www.imd.gov.in/pages/press_release_view.php?ff=20190930_pr_637
[ii] https://timesofindia.indiatimes.com/india/india-gets-first-excess-monsoon-in-25-years/articleshow/71383581.cms

One thought on “Surplus 2019 monsoon in India proves IMD and Skymet Wrong”