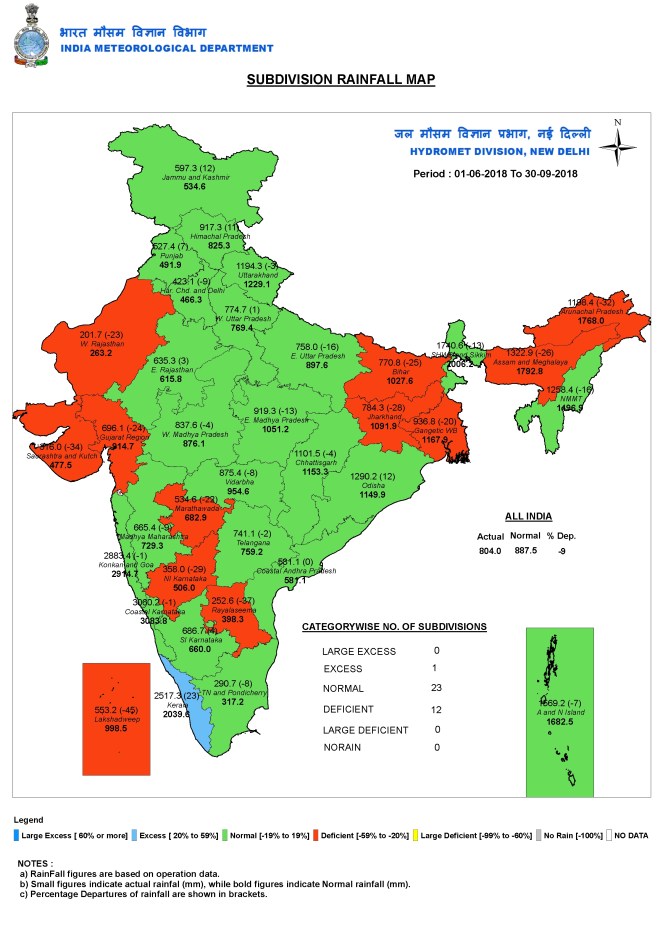
India’s most important season from water point of view, the June-Sept South West Monsoon has just ended officially on Sept 30, 2018. India Meteorological Department (IMD) reported that India received 804 mm rainfall in these four months of monsoon 2018, compared to normal rainfall of 887.5 mm. So Monsoon 2018 rainfall was 9.4% below normal, also proving IMD forecast wrong.
The standard dominating reporting of monsoon rainfall figures in India is either state wise or sub division wise[i]. Accordingly, IMD reported that 23 sub divisions reported normal rainfall, 1 sub divisions[ii] reported excess rainfall and 12 sub divisions[iii] reported deficit rainfall, as can be seen from accompanying IMD sub division wise map of 2018 monsoon rainfall figures.
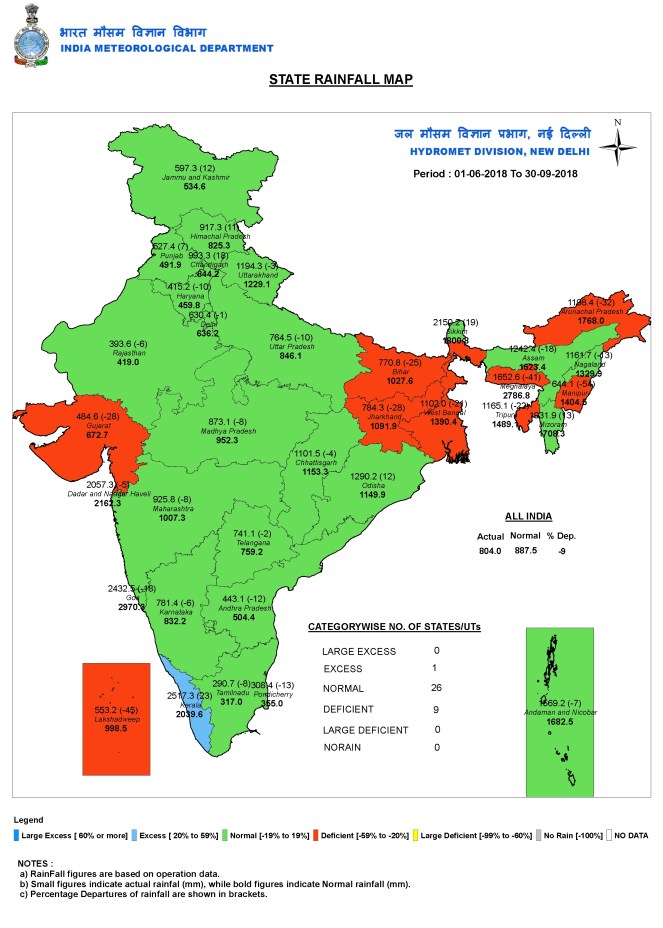
IMD also reports state wise figures of rainfall and as can be seen from accompanying map for state wise figures. Here one can see that One state (Kerala: 23.4% surplus) is in blue zone (surplus over 20%) and Nine states are in Red Zone (deficit over 20%): Manipur (-54%), Meghalaya (-41%), Arunachal Pradesh (-32%), Tripura (-22%), Gujarat (-28%), Jharkhand (-28%), Bihar (-25%), W Bengal (-21%) and Lakshadweep (-45%). Manipur had huge Deficit of 33% in last year too.
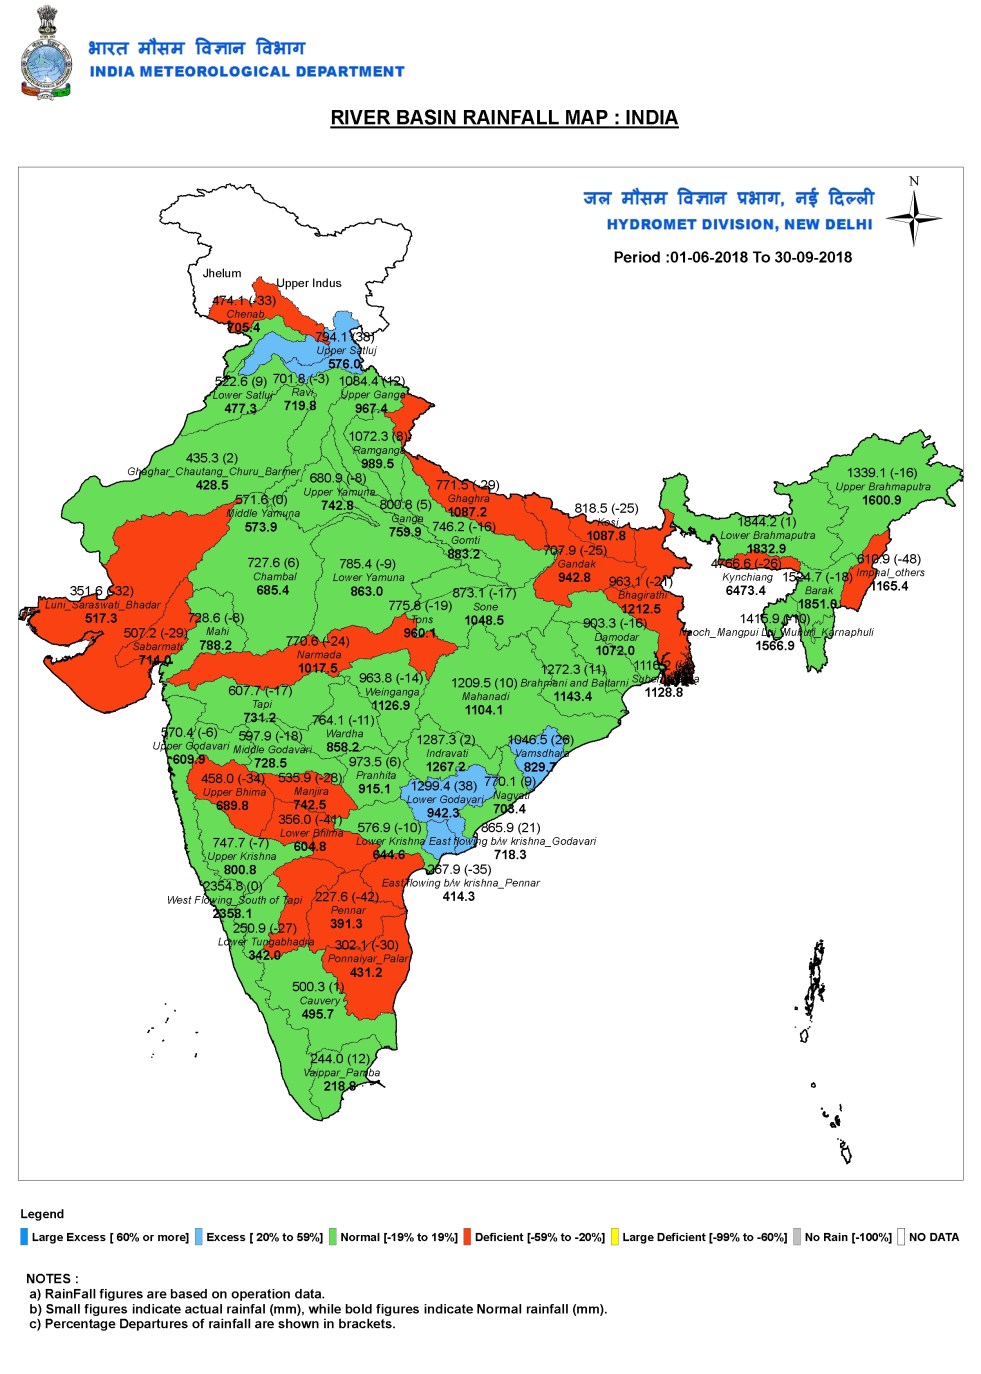
River Basin Wise Rainfall Figures IMD also reports river basin wise rainfall figures on its website on daily basis during monsoon. These figures, in fact are more useful in understanding the hydrological implications of rainfall. Unfortunately, the media does not report these figures at all. For anyone working on water issues, these are much more useful figures.
In Tables below we are reporting the sub basin wise rainfall figures for 2018 monsoon for each basin, along with normal rainfall and departure from normal. We are also highlighting some interesting aspects that are immediately discernible from these tables.
Ganga Basin IMD map divides Ganga basin into 15 sub basins and in table below we have given these figures, diving the Ganga Basin into three sections: Upper Ganga Valley, Yamuna Basin and Lower Ganga Valley Sub Basins.
| BASIN | Sub Basin | 2018 Monsoon Rainfall, mm | Normal Rainfall, mm | % departure of actual rainfall |
| UPPER GANGA Valley SUB BASIN | Upper Ganga | 1084.4 | 967.4 | 12 |
| Ramganga | 1072.3 | 989.5 | 8 | |
| Ghaghra | 771.5 | 1087.2 | -29 | |
| Gomti | 746.2 | 883.2 | -16 | |
| Ganga | 800.8 | 759.9 | 5 | |
| YAMUNA SUB BASIN | Upper Yamuna | 680.9 | 742.8 | -8 |
| Middle Yamuna | 571.6 | 573.9 | 0 | |
| Lower Yamuna | 785.4 | 863 | -9 | |
| Chambal | 727.6 | 685.4 | 6 | |
| LOWER GANGA SUB BASIN | Sone | 873.1 | 1048.5 | -17 |
| Tons | 775.8 | 960.1 | -19 | |
| Gandak | 707.9 | 942.8 | -25 | |
| Kosi | 818.5 | 1087.8 | -25 | |
| Damodar | 903.3 | 1072 | -16 | |
| Bhagirathi | 963.1 | 1212.5 | -21 |
Ghaghra basin had identical rainfall deficit last year too, the rainfall this year is 2 mm below last year’s rainfall. Sone basin too had almost identical rainfall as last year, with same 17% deficit. Almost all the sub basins in Ganga basin had better rainfall except these four, all of Lower Ganga Sub Basin: Gandak, Kosi, Bhagirathi (all three in red zone with deficits over 20%) and Damodar. Tons basin had better rainfall this year than last, thanks largely to very high rainfall on one day: On Sept 7, 2018, there was 33.3 mm rainfall in Tons valley, which was 248% above normal rainfall, previous day the Tons valley had 164% above normal rainfall and the following day had 49% above normal rainfall[iv].
Indus Basin IMD divides this basin into seven sub basins, but strangely for two of the sub basins, namely Jhelum and Upper Indus, it reports no rainfall figures ever! This is very strange and IMD need to answer as to why it does not report rainfall in these two sub basins.
| BASIN | Sub Basin | 2018 Monsoon Rainfall, mm | Normal Monsoon Rainfall, mm | % departure of actual rainfall |
| INDUS | Upper Sutlej | 794.1 | 576 | 38 |
| Lower Sutlej | 522.6 | 477.3 | 9 | |
| Ravi | 701.8 | 719.8 | -3 | |
| Ghaghar, Chautang, Churu, Barmer | 435.3 | 428.5 | 2 | |
| Chenab | 474.1 | 705.4 | -33 | |
| Jhelum | NO INFORMATION | |||
| Upper Indus | NO INFORMATION | |||
It is clear from the table above that among the five sub basins for which IMD has reported rainfall figure, one sub basin each were in red (Chenab, with deficit over 20%) and blue (Upper Sutlej, with surplus over 20%). Lowest rainfall in absolute terms, at 435.3 mm was reported in Ghaghar basin. Upper Sutlej basin had the highest rainfall, 794.1 mm, with 38% surplus rainfall, it was the only one to report surplus (14%) rainfall last year too. Chenab basin is the only one to have recorded lower rainfall than that in last monsoon, that too a drop of massive 187 mm.
North East India IMD divides this basin into six sub basins, four of them were in normal zone, and two in red zone with deficit over 20%. “Imphal and others” sub basin again had highest deficit among all the sub basins of India, of 48%, on back of even higher deficit of 56% last year. In both years, this sub basin experienced the highest deficit among all sub basins of India!
| BASIN | Sub Basin | 2018 Monsoon Rainfall, mm | Normal Monsoon Rainfall, mm | % departure of actual rainfall |
| Brahmaputra, Barak and rest of NE India | Upper Brahmaputra | 1339.1 | 1600.9 | -16 |
| Lower Brahmaputra | 1844.2 | 1832.9 | 1 | |
| Kynichiang | 4766.6 | 6473.4 | -25 | |
| Barak | 1524.7 | 1851.0 | -18 | |
| Imphal, others | 610.9 | 1165.4 | -48 | |
| Naoch, Manpui Lui, Muhuli, Karnaphuli | 1415.9 | 1566.9 | -10 |
Kynichiang is the other sub basin in red zone this year, of Meghalaya, experiencing 26% deficit, even with 4766.6 mm rainfall, easily the highest rainfall among all sub basins of India. This basin has seen a drop of 2500 mm rainfall compared to last year!
Godavari Basin IMD map divides this basin into eight sub basins with normal rainfall varying from the lowest of 609.9 mm in Upper Godavari basin (Rain shadow area) to over double that amount in Indravati sub basin, east facing Eastern Ghats area.
| BASIN | Sub Basin | 2018 Monsoon Rainfall, mm | Normal Monsoon Rainfall, mm | % departure of actual rainfall |
| GODAVARI | Upper Godavari | 570.4 | 609.9 | -6 |
| Middle Godavari | 597.9 | 728.5 | -18 | |
| Wardha | 764.1 | 858.2 | -11 | |
| Manjira | 535.9 | 742.5 | -28 | |
| Pranhita | 973.5 | 915.1 | 6 | |
| Wainganga | 963.8 | 1126.9 | -14 | |
| Indravati | 1287.3 | 1267.2 | 2 | |
| Lower Godavari | 1299.4 | 942.3 | 38 |
As an be seen above, in five of the sub basins, there was deficit rainfall this year, highest deficit of 28% in Manjira sub basin. Lower Godavari basin had both highest rainfall among all sub basins here and the highest surplus.
Krishna Basin IMD divides the basin into five sub basins, though it should be six, the Upper Tungabhadra figures are missing in the IMD map, again this year. Lower Tungabhadra sub basin, at 342 mm, has the lowest normal rainfall not only of the Krishna basin, but also one of the lowest among all the sub basins of entire India.
| BASIN | Sub Basin | 2018 Monsoon Rainfall, mm | Normal Monsoon Rainfall, mm | % departure of actual rainfall |
| KRISHNA | Upper Bhima | 458 | 689.8 | -34 |
| Upper Krishna | 747.7 | 800.8 | -7 | |
| Lower Bhima | 356 | 604.8 | -41 | |
| Lower Tungabhadra | 250.9 | 342 | -27 | |
| Lower Krishna | 576.9 | 644.6 | -10 |
In 2018 monsoon, all sub basins here had deficit rainfall, but the Lower Tungabhadra basin with lowest normal rainfall of 250.9 mm, with a deficit of 27%, while two other sub basins (Upper and Lower Bhima) also in red, had even higher deficits. Upper and Lower Krishna basin were in green zone, the saving grace in Krishna basin.
West Flowing Rivers There are six rivers here, as given below, four of them are individual rivers (Sabarmati, Mahi, Narmada and Tapi) and two are composite basins (Luni-Saraswati-Bhadar and west flowing rivers south of Tapi). The two composite basins have the lowest (517.3 mm for Luni-Saraswati Bhadar composite basin) and highest (2358.1 mm for West flowing rivers south of Tapi) normal rainfall among all the sub basins here.
| BASIN | Sub Basin | 2018 Monsoon Rainfall, mm | Normal Monsoon Rainfall, mm | % departure of actual rainfall |
| WEST FLOWING RIVERS | Luni, Saraswati, Bhadar | 351.6 | 517.3 | -32 |
| Sabarmati | 507.2 | 714 | -29 | |
| Mahi | 728.6 | 788.2 | -8 | |
| Narmada | 770.6 | 1017.5 | -24 | |
| Tapi | 607.7 | 731.2 | -17 | |
| W Flowing South of Tapi | 2354.8 | 2358.1 | 0 |
Luni-Saraswati-Bhadar Composite sub Basin received the lowest (351.6 mm) rainfall in this Basin this year, with the highest deficit of 32%, this composite basin faced 51% surplus and floods last year and is now facing drought, with even Narmada canals not helping, even though the Narmada dam was justified in their name. Narmada basin had deficit of 24%, on top of 21% deficit last year. Tapi basin too had 17% deficit this year, higher than 10% last year. Both Narmada and Tapi basins are supposedly surplus basin, but the dams in both basins had one of the lowest storage at the end of monsoon this year. West flowing composite basin south of Tapi had the highest rainfall of 2354.8 mm this year among all the sub basins here, and also among all the sub basins outside North East India.
Here one would like to suggest to IMD that the composite basin “West flowing rivers south of Tapi” can easily broken into four parts: 1. West flowing rivers South of Tapi in Gujarat, 2. Konkan and Goa, 3. Coastal Karnataka rivers 4. Kerala’s west flowing rivers. This is because the last three sections are already reported by IMD in Sub division rainfall figures, and only slight changes will be required to use those figures for the river basin rainfall map. In fact, we need separate figures of rainfall for many sub basins like Periyar and Chalakudy and Pamba here, considering the unprecedented floods that Kerala experienced this year.
East Flowing Rivers IMD map shows eleven sub basins under this composite basin, as can be seen below. Except three northern most sub basins (Subarnarekha, Brahmani-Baitarni & Mahanadi), all the other eight sub basins had surplus rainfall.
| BASIN | Sub Basin | 2018 Monsoon Rainfall, mm | Normal Monsoon Rainfall, mm | % departure of actual rainfall |
| EAST FLOWING RIVERS | Subarnarekha | 1116.2 | 1128.8 | -1 |
| Brahmani & Baitarni | 1272.3 | 1143.4 | 11 | |
| Mahanadi | 1209.5 | 1104.1 | 10 | |
| Vamsadhara | 1046.5 | 829.7 | 26 | |
| Nagvali | 770.1 | 703.4 | 9 | |
| E flowing between Krishna Godavari | 865.9 | 718.3 | 21 | |
| E flowing Between Krishna Pennar | 267.9 | 414.3 | -35 | |
| Pennar | 227.6 | 391.3 | -42 | |
| Ponnaiyar Palar | 302.1 | 431.2 | -30 | |
| Cauvery | 500.3 | 495.7 | 1 | |
| Vaippar Pamba | 244 | 218.9 | 12 |
The most striking part here is the continuous red patch south of Krishna basin, till Ponnaiyar-Palar basin. These basins receive some of the lowest rains among all sub basins, moreover, they all have 30-42% deficit even from these low normals. Only hope now is that these sub basins receive rainfall during the ensuring North East Monsoon. The sub basins to the north and south of this red patch received normal or above normal rains.
In Conclusion The reporting of river basin wise rainfall figures is surely most welcome development. We hope media will start using these figures, rather than reporting only state and sub division figures. We also hope IMD will develop this further and break the larger river basins into smaller sub basins, so that the figures are more useful for all kind of hydrological assessments and even disaster management and preparedness.
SANDRP (ht.sandrp@gmail.com)
END NOTES:
[i] IMD has divided India into 36 sub divisions. There is no clear logic in forming these sub divisions, since the boundaries of the sub division are not based on hydrology or geo-climate or administrative boundaries.
[ii] Excess rainfall was reported in Kerala, with actual rainfall of 2517.3 mm, compared to normal rainfall of 2039.6 mm, actual rainfall being 23.4% above normal.
[iii] The Red Zone on IMD map showing deficit rainfall include three regions each from west and South-Central India, five from East & North East and one island region: Lakshdweep (-45%), Rayalseema (-37%), North Interior Karnataka (-29%), Marathwada (-22%), Saurashtra and Kutch (-34%), Gujarat region (-24%), West Rajasthan (-23%), Arunachal Pradesh (-32%), Assam & Meghalaya (-26%), Jharkhand (-28%), Bihar (-25%), Gangetic West Bengal (-20%). Interestingly, NONE of these regions were in red last year.
[iv] This created disaster like situation with Bansagar Dam getting filled to the brim. Fortunately, there was very little rain next few days in Tons basin, giving a respite from what looked like a certain disaster, see: https://sandrp.in/2018/09/10/tale-of-a-disaster-foretold-bansagar-dam-ready-to-create-another-flood-disaster-along-sone-and-ganga/
