Central Water Commission (CWC) is the only agency in India doing flood forecasting, it becomes very important to understand what CWC does in this regard. The CWC flood forecasting website[i] is the main media through which CWC provides the flood forecasting. CWC has also published on its website, the document giving Standard Operating Procedure (SOP) for flood forecasting in 2018[ii]. The Home page of the CWC’s flood forecasting site says that CWC provides Level forecasting for 166 sites and Inflow forecasting for 60 sites. SOP document, however, gives these figures in Table 1, but in Table 2 (as also the full list given in Annexure 1.1 of SOP document), it gives state wise break up for 182 Level forecasting and 93 Inflow forecasting sites. So we can see anomalies in these two sources even about the number of forecasting sites.
Similarly, there are anomalies in basic figures like Warning Level, Danger Level, Highest Flood Level for large number of Level Forecasting sites and also ALL the Inflow forecasting sites, as given in this article for each zone, state and site. This further shows how pathetic is CWC’s flood forecasting. In what follows, first we have given the Zone wise, State wise site wise anomalies for Level Forecasting sites, followed by those for Inflow forecasting sties.
ANOMALIES FOR LEVEL FORECASTING SITES
NORTH INDIA
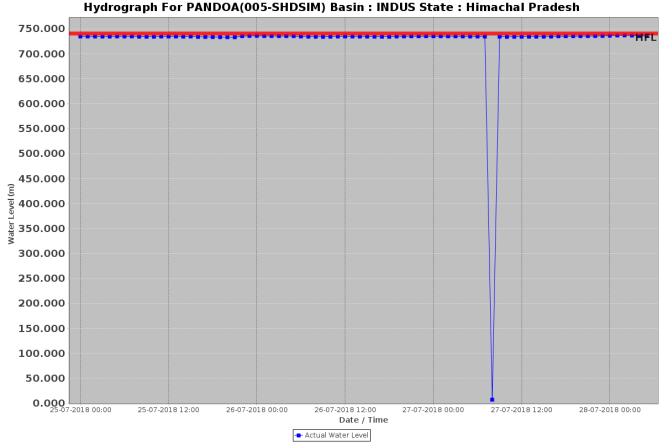
Pandoa Hydrograph showing sudden fall and rise of about 700 meter which is not possible.
 Hydrograph for Kailashahar site, Tripura showing two different level for the site on same day.
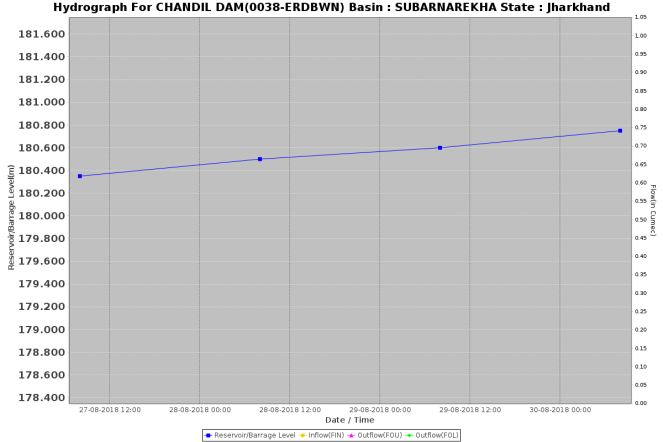
Incomplete Hydrograph for Chandil Dam. Hydrographs for most of the inflow monitoring sites are incomplete. (Image, 30 Aug. 2018)

Inactive hydrograph of Rajghat Dam site.
North India there are 21 sites which has different HFL, HFL date, WL and DL information. The information of many sites is incomplete. The Safapora site in J&K, the Ganga Nagar site in Uttarakhand and the Mohana site in Uttar Pradesh are listed under different district in CWC’s FF website and CWC SOP.
| States | SN | Site | River | District | CWC FF Website | CWC SOP | ||||||
| WL | DL | HFL, M | HFL Date | WL | DL | HFL, M | Date | |||||
| Jammu & Kashmir | 1 | Sangam | Jhelum | Anantnag | 1590.3 | 1591.2 | 1595.7 | 09-06-2014 | NA | NA | NA | NA |
| 2 | Safapora | Jhelum | Baramula
Bandipora |
1580.0 | 1580.5 | 1581.05 | 26-06-2015 | NA | NA | NA | NA | |
| Himachal Pradesh | 1 | Paonta Sahib | Yamuna | Sirmaur | 383.5 | 384.5 | 384.6 | 05-09-1995 | NA | NA | DO | DO |
| Uttrakhand | 1 | Haridwar | Ganga | Haridwar | 293.0 | 294.0 | 296.3 | 17-06-2013 | DO | DO | DO | 19-9-2010 |
| 2 | Ganga Nagar | Mandakani | Chamoli
Rudraprayag |
803.0 | 804.0 | 808.0 | 16-06-2013 | NA | NA | NA | NA | |
| Haryana | 1 | Karnal | Yamuna | Karnal | 248.8 M | 249.5 M | 250.07 | 17-06-2013 | NA | NA | 250.1 | 19-9-2010 |
| Uttar Pradesh | 1 | Mawi | Yamuna | Muzzafar Nagar | 230.0 | 230.85 | 232.75 | 18-06-2013 | DO | DO | 232.45 | 26.9.1988 |
| 2 | Mathura (Prayag Ghat) | Yamuna | Mathura | 165.2 | 166.0 | 169.73 | 08-09-1978 | 164.2 | 165.2 | DO | DO | |
| 3 | SHAHIJINA | Yamuna
Betwa |
Hamirpur | 103.54 | 104.54 | 108.67 | NA | DO | DO | DO | 12.9.1983 | |
| 4 | NAINI | Yamuna | Allahabad | 83.74 | 84.73 | 87.99 | 08-09-1978 | DO | 84.74 | DO | DO | |
| 5 | MOHANA | Betwa | Jalaun
Jhansi |
121.66 | 122.66 | 133.35 | 11-09-1983 | DO | DO | 133.69 | DO | |
| 6 | Kanpur | Ganga | Kanpur (Urban) | 112.0 | 114.0 | 114.08 | 29-09-2010 | 113.0 | DO | DO | DO | |
| 7 | GHAZIPUR | Ganga | Ghazipur | 62.105 | 63.102 | 65.22 | 09-09-1978 | 62.11 | 63.11 | 65.22 | DO | |
| 8 | BALLIA | Ganga | Ballia | 56.615 | 57.615 | 60.39 | 25-08-2016 | 56.62 | 57.62 | DO | DO | |
| 9 | Lucknow (Hanuman Setu) | Gomti | Lucknow | 108.5 | 109.5 | 110.85 | 11-09-1971 | DO | DO | DO | 10-9-1971 | |
| 10 | JAUNPUR | Gomti | Jaunpur | 73.066 | 74.066 | 77.738 | 22-09-1971 | 73.07 | 74.07 | 77.74 | DO | |
| 11 | Elginbridge | Ghagra | Bara Banki | 105.07 | 106.07 | 107.616 | 16-08-2014 | DO | DO | 107.56 | 10.10.2009 | |
| 12 | Balrampur | Rapti | Balrampur | 103.62 | 104.62 | 105.54 | 15-08-2017 | DO | DO | 105.51 | 16.8.2014 | |
| 13 | Bansi | Rapti | Sidharthnagar | 83.9 | 84.9 | 85.88 | 20-08-2017 | DO | DO | 85.82 | 21.8.1998 | |
| 14 | Bareilly | Ramganga | Bareilly | 162.07 | 163.07 | 162.881 | 06-08-1978 | 162.7 | 163.7 | DO | DO | |
| 15 | Allahabad | Ganga | Allahabad | NA | NA | NA | NA | 83.73 | 84.73 | 88.03 | 8-9-1978 | |
NORTH EAST INDIA
11 Sites in three North Eastern states namely Arunachal Pradesh, Assam and Tripura are having different information of HFL, HFL date, WL and DL. The spelling of many sites in both sources are mismatching. For example the Annapurna Ghat on CWC website is mentioned as AP Ghat in SOP document.
| States | SN | Site | River | District | CWC Website | CWC SOP | ||||||
| WL | DL | HFL, M | HFL Date | WL | DL | HFL, M | HFL Date | |||||
| Arunachal Pradesh | 1 | Namsai | Lohit | Lohit | 140.6 | 141.1 | 144.46 | 07-10-1979 | DO | DO | 145.03 | 31.8.1974 |
| Assam | 1 | Dibrugarh | Brahmaputra | Dibrugarh | 104.7 | 105.7 | 106.48 | 03-09-1998 | 103.24 | 104.24 | DO | DO |
| 2 | Cholddhowaghat | Subansiri | Lakhimpur | 99.43 | 100.43 | 101.31 | 27-07-1972 | 99.02 | 100.02 | DO | DO | |
| 3 | Ranganadi NT Rd Xing | Ranganadi | Lakhimpur | 93.81 | 94.81 | 95.92 | 02-07-1979 | DO | DO | 94.96 | 13.08.2009 | |
| 4 | Shivsagar | Dikhow | Sibsagar | 91.4 | 92.4 | 94.19 | 25-06-1998 | DO | DO | 95.62 | 08.07.1974 | |
| 5 | Golaghat | Dhansiri (S) | Golaghat | 88.5 | 89.5 | 92. 45 | 11-10-1986 | DO | DO | 91.3 | DO | |
| 6 | Badatighat | Subansiri | Lakhimpur | 81.53 | 82.53 | 86.21 | 28-07-1972 | DO | DO | 86.84 | 28.06.1972 | |
| 7 | Kampur | Kopili | Nagaon | 59.5 | 60.5 | 61.79 | 20-07-2004 | DO | DO | 61.86 | 16.06.1973 | |
| 8 | Dhubri | Brahmaputra | Dhubri | 27.62 | 28.62 | 30.36 | 01-08-1989 | DO | DO | DO | 28.08.1988 | |
| 9 | Annapurna ghat
AP Ghat |
Barak | Cachar | 18.83 | 19.83 | 21.84 | 02-09-1989 | DO | DO | DO | 01.08.1989 | |
| Tripura | 1 | Sonamura | Gumti | West Tripura | 11.5 | 12.5 | 14.43 | 23-07-1993 | DO | DO | 14.42 | DO |
EAST INDIA
There are 15 sites in East India including Bihar, Jharkhand, Odisha, West Bengal States carrying mismatching information on HFL, HFL date, WL and DL. The Chatia site of Bihar is mentioned in Motihari district in website but the SOP mentions it in West Champaran district. Similarly the Chhapra site is mentioned in Saran district in website and in Chhapara in SOP. Lalbeghiaghat site is mentioned Purba Champaran district in Website but in Motihari district in SOP.
| States | SN | Sites | River | District | CWC Website | CWC SOP | ||||||
| WL | DL | HFL, M | HFL Date | WL | DL | HFL, M | HFL Date | |||||
| Bihar | 1 | Buxar | Ganga | Buxar | 59.32 | 60.32 | 62.09 | 01-08-1948 | DO | DO | DO | 1948 |
| 2 | Patna Gandhighat | Ganga | Patna | 47.6 | 48.6 | 50.52 | 21-08-2016 | DO | DO | DO | 20.08.2016 | |
| 3 | Dumariaghat | Gandak | Gopalganj | 61.22 | 62.22 | 64.1 | 17-08-2017 | DO | DO | 63.6 | 18-8-2014 | |
| 4 | Hazipur | Gandak | Vaishali | 49.32 | 50.32 | 50.93 | 18-08-1948 | DO | DO | DO | 1948 | |
| 5 | Khagaria | Burhi Gandak | Khangaria | 35.58 | 36.58 | 39.22 | 16-08-1976 | DO | DO | DO | 1976 | |
| 6 | Basua | Kosi | Supaul * | 46.75 | 47.75 | 49.24 | 13-08-2017 | DO | DO | 49.17 | 25-8-2010 | |
| 7 | Dhengraghat | Mahananda | Purnia | 34.65 | 35.65 | 38.2 | 14-08-2017 | DO | DO | 38.09 | 1968 | |
| 8 | Jhawa | Mahananda | Katihar | 30.4 | 31.4 | 34.07 | 14-08-2017 | DO | DO | 33.51 | 14-8-1987 | |
| 9 | Ekmighat | Adhwara | Darbhanga | 45.94 | 46.94 | 49.52 | NA | DO | DO | DO | 12.07.2004 | |
| Jharkhand | 1 | Sahibganj | Ganga | Sahibganj | 26.25 | 27.25 | 30.91 | 20-08-1998 | DO | DO | DO | 1998 |
| Odisha | 1 | Rajghat | Subarnarekha | Balasore | 9.45 | 10.36 | 12.69 | 09-06-2008 | DO | DO | DO | 19-06-2008 |
| 2 | Govindpur
(NH5 Road Bridge) |
Burhabalang | Balasore | 7.21 | 8.13 | 9.5 | 08-10-1973 | DO | DO | DO | 12-10-1973 | |
| West Bengal | 1 | DOMOHANI | Teesta | Jalpaiguri | 85.65 | 85.95 | 89.3 | 04-10-1968 | DO | DO | DO | 14-10-1968 |
| 2 | Tufanganj | Raidak-I | Koch Bihar | 34.22 | 35.3 | 36.5 | 12-08-2017 | DO | DO | 36.36 | 21-7-1993 | |
| 3 | NH-31 | Brahmaputra | Jalpaiguri | 80.0 | 80.9 | 81.33 | 28-08-1972 | DO | DO | DO | 28-08-1972 | |
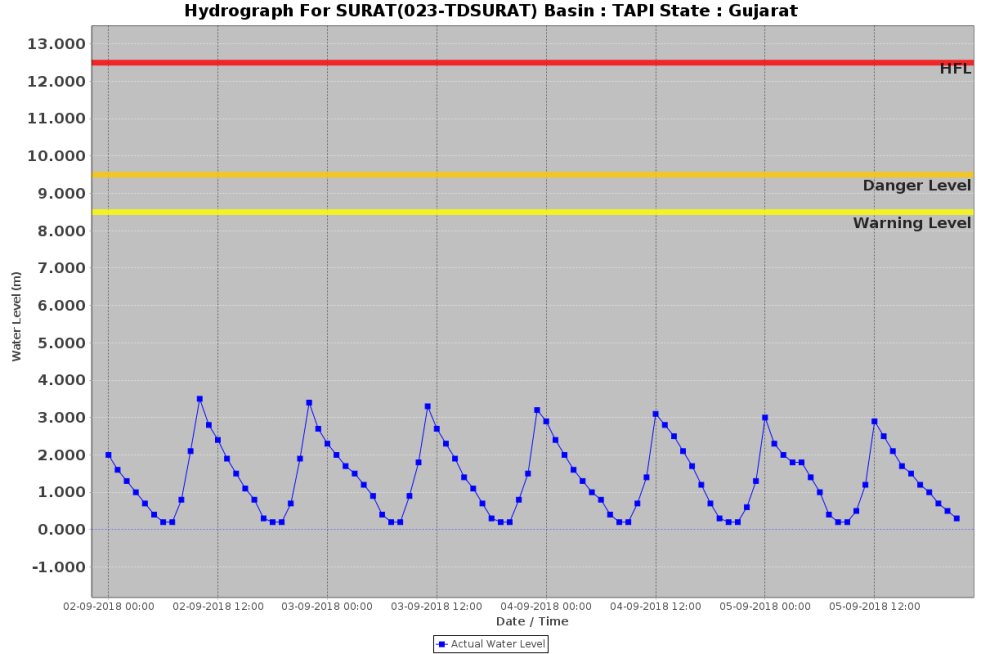
WEST INDIA
There are 10 sites in Gujarat, Madhya Pradesh, Maharashtra with different HFL, HFL date, WL and DL information as CWC website and CWC SOP document. Also Garudeshwar site is mentioned in Narmada district on CWC website but in SOP document it is mentioned in Bharuch district.
| States | SN | Site | River | District | CWC Website | CWC SOP | ||||||
| WL | DL | HFL, M | Date | WL | DL | HFL, M | Date | |||||
| Gujarat | 1 | Bharuch | Narmada | Bharuch | 6.705 | 7.315 | 12.65 | 06-09-1970 | 6.71 | 7.31 | DO | 07-9-1970 |
| 2 | Subhash Bridge
Ahmedabad |
Sabarmati | Ahmedabad | 44.09 | 45.34 | 47.45 | 20-08-2006 | DO | DO | DO | 19-8-2006 | |
| 3 | Wanakbori | Mahi | Kheda | 71.93 | 74.98 | 76.1 | 12-08-2006 | 71 | 72.54 | DO | DO | |
| 4 | Surat | Tapi | Surat | 8.5 | 9.5 | 12.5 | 06-08-2006 | DO | DO | DO | 09-08-2006 | |
| Madhya Pradesh | 1 | Mandla | Narmada | Mandla | 437.2 | 437.8 | 439.405 | 15-07-1974 | DO | DO | 439.41 | 18.08.1974 |
| 2 | Hoshangabad | Narmada | Hoshangabad | 292.8 | 293.8 | 301.33 | 27-08-1972 | 292.83 | 293.83 | 300.9 | 30.081973 | |
| Maharashtra | 1 | Kopergaon | Godavari | Ahmednagar | 490.9 | 493.68 | 499.17 | 01-08-1969 | DO | DO | DO | 1969 |
| 2 | Gangakhed W/L Station | Godavari | Parbhani | 374.0 | 375.0 | 377.57 | 01-08-1947 | DO | DO | DO | 1947 | |
| 3 | Pauni | Wainganga | Bhandra | 226.73 | 227.73 | 237.115 | 07-09-1994 | DO | DO | 232.35 | 07.09.1994 | |
| Rajasthan | 1 | Kota city | Chambal | NA | NA | NA | NA | NA | NA | NA | NA | |
SOUTH INDIA
In South India 11 sites carry mismatching information. Apart from this Kurnool Town is mentioned as Kurnool site in SOP. Also the Kodumudi, Musiri, Savandapur sites mentioned in website are not listed in SOP document. Instead of this, the SOP document has three different sites Srirangam, Erode and Bhavani which are not mentioned in website.
| States | SN | Site | River | District | CWC Website | SOP, Document | ||||||
| WL | DL | HFL, M | Date | WL | DL | HFL, M | Date | |||||
| Andhra
Pradesh |
1 | Atreyapuram | Godavari | East Godavari | 14.0 | 15.5 | NA | NA | NA | NA | NA | NA |
| 2 | Chinturu | Sabri | East Godavari | 41.5 | 43.0 | NA | NA | NA | NA | NA | NA | |
| 3 | Kurnool Town | Tungabhadra | Kurnool | 273.0 | 274.0 | 281.225 | 02-10-2009 | 276 | 278 | 285.23 | DO | |
| 4 | Nellore Anicut | Pennar | Nellore | 15.91 | 17.28 | 18.7 | NA | DO | DO | DO | 30.11.1882 | |
| Tamil Nadu | 1 | KODUMUDI | Cauvery | Erode | 125.325 | 126.325 | 127.83 | 25-10-2005 | ||||
| 2 | MUSIRI | Cauvery | Thiruchirapalli | 82.115 | 83.115 | 86.175 | 13-11-1977 | |||||
| 3 | SAVANDAPUR | Bhavani | Erode | 184.5 | 185.5 | 186.878 | 05-11-1978 | |||||
| 4 | Srirangam | Cauvery | Thiruchirapalli | NA | NA | NA | NA | NA | NA | NA | NA | |
| 5 | Erode | Cauvery | Erode | NA | NA | NA | NA | NA | NA | NA | NA | |
| 6 | Bhavani | Cauvery | Bhavani | NA | NA | NA | NA | NA | NA | NA | NA | |
| Telangana | 1 | Eturunagaram | Godavari | Warangal | 73.32 | 75.82 | 77.66 | 24-08-1990 | 73.29 | 75.79 | DO | DO |
Over all, out of 182 level forecasting sites, 68 (21 in North, 11 in North East, 15 in East, 10 in West and 11 in South India) sites in CWC SOP document have different information on HFL, HFL date, WL and DL information in comparison with CWC website. There is no explanation given for this either in the SOP document or on the website. Again shows how pathetic if CWC’s flood forecasting even on basic aspects.
ANOMALIES FOR INFLOW FORECASTING SITES
NORTH INDIA
Out of 6 Inflow Forecast sites in Uttar Pradesh (3), Uttrakhand (2) and Haryana (1), CWC website[iii] carries Full Reservoir Level (FRL), Maximum Water Level (MWL) information only for 2 sites Narora and Rihand dam both in Uttar Pradesh. Whereas the CWC SOP (Standard Operating Procedure) document[iv] has FRL information only for 1 site Hathini Kund Barrage in Haryana. The remaining 5 sites in SOP has neither FRL nor MWL information. The Kalagarh Dam site is not mentioned in CWC website but is listed in SOP document.
Pandoa Hydrograph showing sudden fall and rise of about 700 meter which is not possible
| States | SN | Site | River | Basin | District | CWC Website | CWC SOP | ||
| FRL | MWL | FRL | MWL | ||||||
| Uttar Pradesh | 1 | Dharamnagari Barrage | Ganga | Ganga | Bijnor | NA | NA | NA | NA |
| 2 | NARORA | Ganga | Ganga | Bulandshahr | 178.42 | 178.42 | NA | NA | |
| 3 | Rihand Dam | Rihand | Ganga | Sonbhadra | 268.22 | 268.75 | NA | NA | |
| Uttrakhand | 1 | Banbasa | Sarda | Ganga | Champawat | NA | NA | NA | NA |
| 2 | Kalagarh Dam | Ramganga | Ganga | Pouri Garhwal | NA | NA | NA | NA | |
| Haryana | 1 | Hathinikund Barrage | Yamuna | Upper Yamuna | Yamuna Nagar | NA | NA | 323.7 | NA |
NORTH EAST INDIA
Out of 8 states in North East, there are 6 Inflow Forecast sites mentioned in SOP document and none of the site has FRL and MWL detail. The Teesta V Dam site in not mentioned in CWC website.
| States | SN | Site | River | Basin | District | CWC Website | CWC SOP | ||
| FRL | MWL | FRL | MWL | ||||||
| Sikkim | 1 | Lower Subansiri | Subansiri | Brahmaputra | Dhimaji | NA | NA | NA | NA |
| 2 | Rangit 3 Dam | Rangit | Teesta | West | NA | NA | NA | NA | |
| 3 | Rangpo Dam | Rangpochu | Teesta | East | NA | NA | NA | NA | |
| 4 | Rongli Dam | Rangpochu | Teesta | East | NA | NA | NA | NA | |
| 5 | Teesta 3 Dam | Lachung Chu | Teesta | North | NA | NA | NA | NA | |
| 6 | Teesta V Dam Singtam | Teesta | Teesta | East | NA | NA | |||
EAST INDIA
In East India, there are 22 Inflow sites (Jharkhand 15, Odisha 3, West Bengal 4) mentioned in SOP document which either lack information or carry different FRL, MWL details from CWC Website. There is only 1 site has FRL information. The Amanat Barrage, Annaraj Dam, Batane Dam and Sikatia Barrage sites in SOP document are not mentioned in CWC website.
| States | SN | Site | River | Basin | District | CWC Website | CWC SOP | ||
| FRL | MWL | FRL | MWL | ||||||
| Jharkhand | 1 | SUNDAR DAM | Sundar | GANGA | Godda | NA | NA | NA | NA |
| 2 | Tenughat Dam | Damodar | GANGA | Bokaro | 268.834 | 268.83 | DO | NA | |
| 3 | Panchet Dam | Damodar | GANGA | Dhanbad | 132.59 | 132.59 | DO | NA | |
| 4 | BHAIRWA DAM | Damodar | GANGA | Hazaribag | NA | NA | NA | NA | |
| 5 | Konar Dam | Konark | GANGA | Hazaribag | NA | NA | NA | NA | |
| 6 | Tilaiya Dam | Barakar | GANGA | Hazaribag | NA | NA | NA | NA | |
| 7 | Maithon Dam | Barakar | GANGA | Dhanbad | 150.88 | 151.79 | DO | NA | |
| 8 | Massanjore Dam | Mayurakshi | GANGA | Santhal Pargahas | 121.31 | 121.31 | DO | NA | |
| 9 | GALUDIH BARRAGE | Dulang | SUBARNAREKHA | Saraikela | 94.5 | NA | NA | NA | |
| 10 | Chandil Dam | Subarnarekha | SUBARNAREKHA | Purba Singbhum | 192.0 | NA | NA | NA | |
| 11 | GETASLUT RESERVOIR | Subarnarekha | SUBARNAREKHA | Ranchi | 590.06 | NA | NA | NA | |
| 12 | Amanat Barrage | Baranadi | Dumka | NA | NA | NA | NA | ||
| 13 | Annaraj Dam | Khoranadi | Hazaribagh | NA | NA | NA | NA | ||
| 14 | Batane Dam, | Jamunia | Giridih | NA | NA | NA | NA | ||
| 15 | Sikatia Barrage | Ashranadi | Dumka | NA | NA | NA | NA | ||
| Odisha | 1 | Hirakud Dam | Mahanadi | MAHANADI | Sambalpur | 192.02 | NA | DO | NA |
| 2 | Rengali Dam U/S | Brahmni | BRAHMANI-BAITARNI | Angul | 123.5 | NA | NA | NA | |
| 3 | Salandi | Brahmni | BRAHMANI-BAITARNI | Keonjhar | NA | NA | NA | NA | |
| West Bengal | 1 | Kangsabati Dam | Kangsabati | GANGA | Mednipur | 134.11 | 134.71 | DO | NA |
| 2 | Durgapur Barrage | Damodar | GANGA | Bardhaman | 64.465 | NA | 64.47 | NA | |
| 3 | Tilpara Mihirlal Barrage | Mayurakshi | GANGA | Birbhum | 62.79 | NA | DO | NA | |
| 4 | Hinglow Dam | Hinglow | GANGA | Birbhum | NA | NA | NA | NA | |
WEST INDIA
There are 21 Inflow Forecast sites (Gujarat 6, MP 2, Maharashtra 3, Rajasthan 10) in CWC SOP document in West India which either has incomplete or different FRL, MWL information from CWC website. In SOP document only 6 sites carry FRL information and 2 sites MWL information.

Inactive hydrograph of Vapi town.
| States | SN | Site | River | Basin | District | CWC Website | CWC SOP | ||
| FRL | MWL | FRL | MWL | ||||||
| Gujarat | 1 | Dharoi Dam | Dharoi Dam | SABARMATI | Mahesana | 189.59 | 192.25 | 187.45 | DO |
| 2 | Dantiwada Dam | Mahi | INDUS | Banaskantha | 182.88 | 185.06 | DO | DO | |
| 3 | Kadana Dam | Mahi | MAHI | Mahisagar | 127.71 | 127.71 | 126.19 | DO | |
| 4 | Panam Dam | Panam | MAHI | Panchmahal | 121.41 | NA | NA | NA | |
| 5 | Ukai Dam | Tapi | TAPI | Surat | 105.156 | 105.539 | 102.41 | 105.16 | |
| 6 | Madhuban Dam | Daman Ganga | WFR South of Tapi | Valsad | 79.86 | 82.4 | DO | DO | |
| MP | 1 | Gandhisagar Dam | Chambal | GANGA | Mandsaur | 399.9 | 401.0 | DO | 399.9 |
| 2 | Bansagar Dam | Sone | GANGA | Shahdol | 341.65 | 341.64 | NA | NA | |
| Maharashtra | 1 | Jaikwadi Dam | Godavari | GODAVARI | Aurangabad | 463.91 | 465.5 | DO | NA |
| 2 | Gosikhurd Dam | Wainganga | GODAVARI | Bhandra | 245.5 | NA | NA | NA | |
| 3 | HATHNUR | Tapi | TAPI | Jalgaon | 214.0 | 214.01 | 212.02 | 214 | |
| Rajasthan | 1 | Panchana Dam | Chambal | GANGA | Karauli * | NA | NA | NA | NA |
| 2 | Bisalpur Dam | Banas | GANGA | Tonk | 315.5 | NA | NA | NA | |
| 3 | Gambhiri Dam | Gambhir | GANGA | Chittaurgarh | NA | NA | NA | NA | |
| 4 | Parwati Pick- up weir | Parwati | GANGA | Baran | NA | NA | NA | NA | |
| 5 | Kalisindh Dam | Kalisind | GANGA | Jhalawar | NA | NA | NA | NA | |
| 6 | Parwan pick-up Weir | Parwan | GANGA | Jhalawar | NA | NA | NA | NA | |
| 7 | Mahi Dam | Mahi | MAHI | Banswara | 281.5 | 281.5 | NA | NA | |
| 8 | Somkamla Amba Dam | Som | MAHI | Dungarpur | 212.5 | NA | NA | NA | |
| 9 | Gudha Dam | Mej | Bundi | NA | NA | ||||
| 10 | Kota Barrage | Chambal | Kota | NA | NA | ||||
SOUTH INDIA
There are 37 Inflow Forecast sites (Andhra Pradesh 10, Karnataka 9, Tamil Nadu 11, Telangana 7) in CWC SOP carrying incomplete or different information from the CWC website. None of the sited have MWL information. Similarly only 2 sites has FRL details.
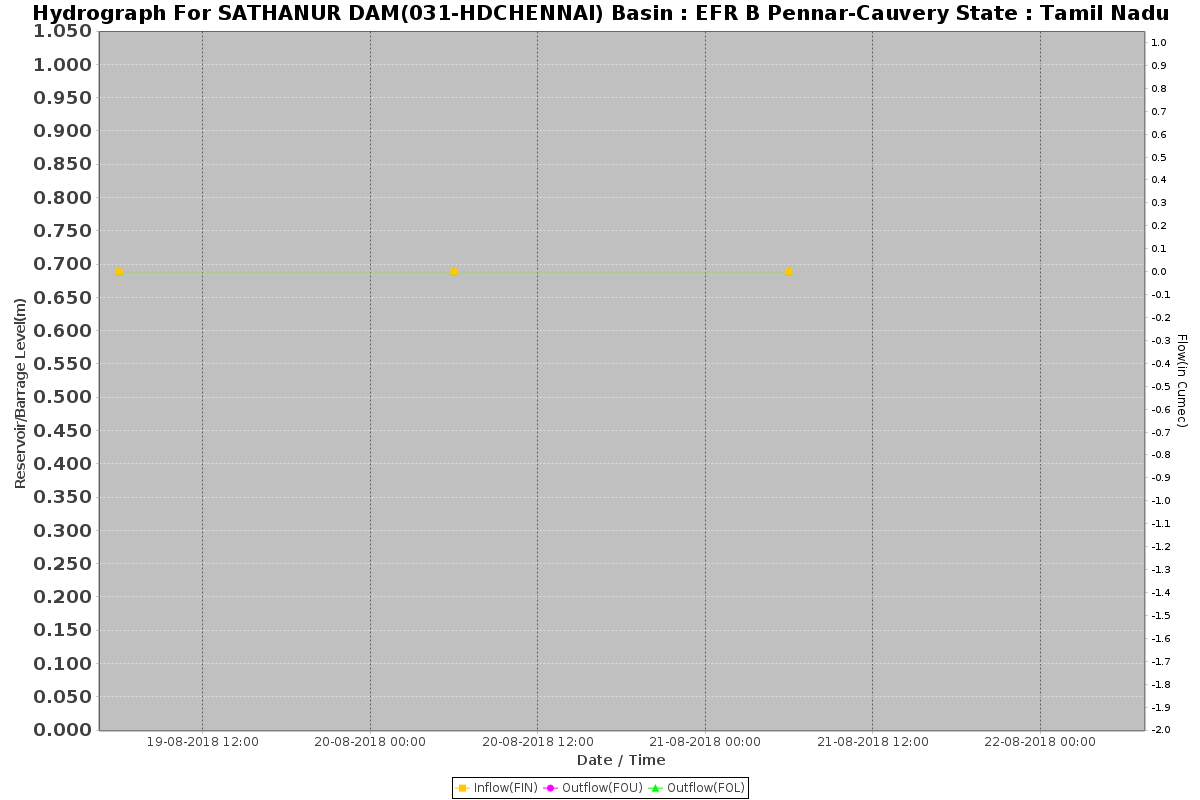
Incomplete hydrograph of Sathanur dam site in Tamil Nadu.
| States | SN | Site | River | Basin | District | CWC Website | CWC SOP | ||
| FRL | MWL | FRL | MWL | ||||||
| Andhra Pradesh | 1 | Indirasagar Project (Polavaram) | Godavari | GODAVARI | East Godavari | NA | NA | NA | NA |
| 2 | Srisailam | Krishna | KRISHNA | Kurnool | 269.75 | 269.75 | DO | NA | |
| 3 | DR KLRS Pulichintala Dam | Krishna | KRISHNA | Guntur | 53.34 | NA | NA | NA | |
| 4 | Sunkesula Barrage | Tungabhadra | KRISHNA | Kurnool | 292.0 | NA | NA | NA | |
| 5 | Prakasam Barrage | Lower Krishna | KRISHNA | Krishna | 17.37 | 18.3 | NA | NA | |
| 6 | MADDUVALASA | Nagavali | EFR B Mahanadi-Godavari | Vizianagaram | NA | NA | NA | NA | |
| 7 | Gotta Barrage | Vamsadhara | EFR B Mahanadi-Godavari | Srikakulam | NA | NA | 34.84 | NA | |
| 8 | Thottapalli R/s (APSDPS Data) | Nagavali | EFR B Mahanadi-Godavari | Vizianagaram | 105.0 | NA | NA | NA | |
| 9 | Somasila Dam | Pennar | PENNAR | Nellore | 100.58 | NA | NA | NA | |
| 10 | NARAYANPUR ANICUT | Vegavati | EFRBM&P | Srikakulam | 32.77 | NA | NA | NA | |
| Karnataka | 1 | Almatti Dam | Krishna | KRISHNA | Bijapur | 519.6 | 519.6 | DO | NA |
| 2 | Narayanpur Dam | Krishna | KRISHNA | Bijapur | 492.25 | 492.25 | DO | NA | |
| 3 | Bhadra Dam | Bhadra | KRISHNA | Chikmagalur | 657.75 | 657.75 | NA | NA | |
| 4 | Tungabhadra Dam | Tungabhadra | KRISHNA | Bellary | 497.74 | 497.74 | DO | NA | |
| 5 | Upper Tunga Project | Tunga | KRISHNA | Shimoga | 588.24 | 588.24 | NA | NA | |
| 6 | Hemavathi Dam | Hemavathi | CAUVERY | Hassan | 890.63 | NA | NA | NA | |
| 7 | Harangi Dam | Harangi | CAUVERY | Kodagu | 871.42 | NA | NA | NA | |
| 8 | Krishna Raja Sagar | Cauvery | CAUVERY | Mandya | 752.49 | NA | NA | NA | |
| 9 | Kabini Dam | Kabini | CAUVERY | Mysore | 696.16 | NA | NA | NA | |
| Tamil Nadu | 1 | Mettur Dam | Cauvery | CAUVERY | Salem | 240.79 | NA | NA | NA |
| 2 | Grand Anicut | Cauvery | CAUVERY | Thanjavur | NA | NA | NA | NA | |
| 3 | UPPER ANICUT | Cauvery | CAUVERY | Thiruchirapalli | NA | NA | NA | NA | |
| 4 | Bhavanisagar Dam | Bhavani | CAUVERY | Erode | 280.42 | NA | NA | NA | |
| 5 | KODAGANAR DAM | Kodaganar | CAUVERY | Dindigul | NA | NA | NA | NA | |
| 6 | Poondi Satyamoorthy Reservoir | Kosasthalaiyar | EFR B Pennar-Cauvery | Thiruvallur | 42.67 | NA | NA | NA | |
| 7 | Sathanur Dam | Ponnaiyar | EFR B Pennar-Cauvery | Thiruvannamalai | 222.2 | NA | NA | NA | |
| 8 | Wellington Reservoir | Vellar | EFR B Pennar-Cauvery | Cuddalore | 72.54 | NA | NA | NA | |
| 9 | Gomukhi Dam | Vellar | EFR B Pennar-Cauvery | Villupuram | 183.18 | NA | NA | NA | |
| 10 | VAIGAI DAM | Vaigai | EFR South of Cauvery | Theni | 279.2 | NA | NA | NA | |
| 11 | Chembarampakkam | Adyar | EFRBP&K | Kancheepuram | 26.03 | 26.03 | NA | NA | |
| Telangana | 1 | Sriram Sagar(State Gov. Site) | Godavari | GODAVARI | Nizamabad | 332.54 | 333.15 | DO | NA |
| 2 | Sripada Yellampalli Project | Godavari | GODAVARI | Karimnagar | 148.0 | NA | NA | NA | |
| 3 | PVN Rao Kantanapally Project | Godavari | GODAVARI | Warangal | NA | NA | NA | NA | |
| 4 | Singur Dam | Manjira | GODAVARI | Medak | 523.6 | 523.6 | DO | NA | |
| 5 | Nizam Sagar(Stat Govt. Site) | Manjira | GODAVARI | Nizamabad | 428.24 | 428.24 | DO | NA | |
| 6 | Kaddam Dam | Kaddam vagu | GODAVARI | Adilabad | 213.21 | NA | NA | NA | |
| 7 | P.D. Jurala
Priyadarshani Jurala |
Krishna | KRISHNA | Mahbubnagar | 318.52 | NA | DO | NA | |
ALL INDIA: So there are anomalies between CWC’s Flood Forecasting website and its SOP document for total of 95 Inflow forecasting sites[v], as listed above. ALL the inflow forecasting sites have anomalies. This shows how pathetic is CWC’s inflow forecasting. In addition, as noted in our zonal articles on CWC’s flood forecasting, the flood hydrograph for almost all the inflow forecasting sites carry incomplete information.
Also see:
INDIA: Overview of CWC Flood Monitoring Sites
WEST INDIA: Overview of CWC Flood Forecasting Sites
SOUTH INDIA Overview of CWC Flood Forecasting Sites
Overview of CWC Flood Forecasting Sites: East India
Overview of CWC Flood Forecasting Sites: North India
Overview of CWC Flood Forecasting Sites: North East India
A SANDRP analysis (ht.sandrp@gmail.com)
END NOTES:
[i] http://www.india-water.gov.in/ffs/
[ii] http://cwc.gov.in/main/downloads/SOP_Flood_Forecasting_April2018.pdf
[iii] http://www.india-water.gov.in/ffs/current-flood-forecast/
[iv] http://cwc.gov.in/main/downloads/SOP_Flood_Forecasting_April2018.pdf
[v] The SOP document lists 93 inflow forecasting sites. The FF website list include two additional sites that are not included in the SOP list, thus the total number comes to 95.

Thanks for elaborate info on the short comings of CWC hydrograph plots.
How may I generate a hydrograph for level monitoring station.
Eg: for Basin: Godavari & station: Bhadrachalam.
Or is this hydrograph service no more available for general Public?
LikeLike
I think it is still available on CWC website, but today it seems the CWC FF site is down. Hopefully it will be up again soon.
LikeLike
Correction:
The levels given in Hydrograph are in mean sea level and the level of 51.9 ft is gauge above ground level (GL)measured from Sate Government gauge. The GL at Bhadrachalam feet gauge is 107 feet and the gauge above mean sea level is 158.9 ft which when converted to m is 48.43
LikeLike