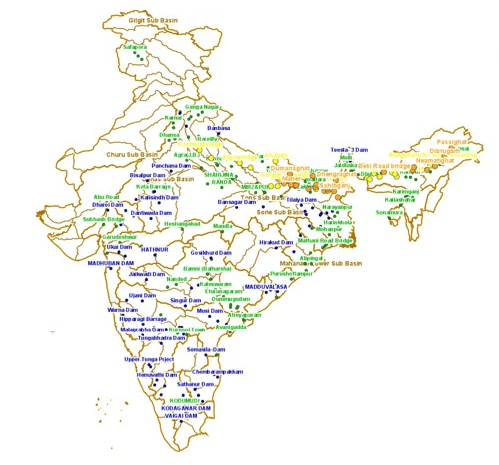
Central Water Commission is the only agency doing flood forecasting in India. As per CWC’s Flood Forecasting website[i] the Data Flow Map has information about 226 Flood Forecast Sites in the country comprising of 166 Level Forecast Sites and 60 Inflow Forecast Sites. It also monitors 700 Flood sites, information made available through List Based Exploration and Hydrograph View, but no flood forecasting is done for these sites.
In order to better understand the CWC’s flood monitoring and forecasting work, SANDRP has published report of CWC’s Level Forecast, Inflow Forecast and level monitoring sites in 5 zones of North India[ii], North East India[iii], East India[iv], South India[v] and West India[vi]. Through this report, we have presented all the data at one place with links to separate zone wise reports with detailed description.
NORTH EAST INDIA
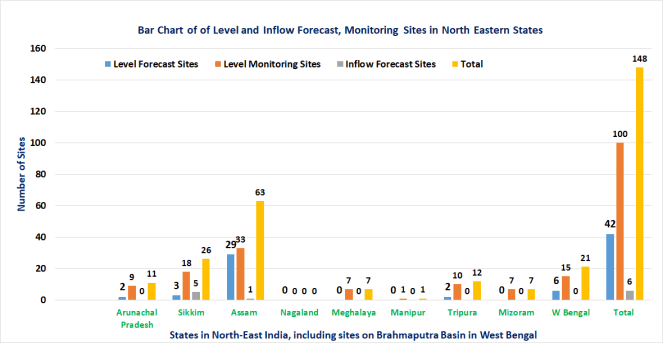
As per CWC website there are 148 Level and Inflow Forecasting and flood monitoring sites in North East India comprising of 42 Level Forecasting, 100 Flood monitoring and 6 Inflow Forecast sites. The data also reveals that out of 148 sites, 32 sites (21 percent) comprising of 3 Level Forecast, 24 Level monitoring and 5 Inflow Forecast Sites are inactive.
About 75 per cent of these sites are in 3 states namely Assam (63 sites), Sikkim (26) and West Bengal (Brahmaputra) 22 sites. It is also seen that there is no site in Nagaland, only 1 site in Manipur state and 7 (each) in the states of Meghalaya and Mizoram. It is also shocking that out of 26 sites in Sikkim 21 (81 per cent) sites are inactive.
Summary Table of Level and Inflow Forecast, Monitoring Sites in North Eastern States
| States | Level Forecast
Sites |
Level Monitoring Sites | Inflow Forecast
Sites |
Total | |||
| Active | Inactive | Active | Inactive | Active | Inactive | ||
| Arunachal Pradesh | 2 | 0 | 8 | 1 | 0 | 0 | 11 |
| Sikkim | 0 | 3 | 4 | 14 | 1 | 4 | 26 |
| Assam | 29 | 0 | 31 | 2 | 0 | 1 | 63 |
| Nagaland | 0 | 0 | 0 | 0 | 0 | 0 | 0 |
| Meghalaya | 0 | 0 | 5 | 2 | 0 | 0 | 7 |
| Manipur | 0 | 0 | 1 | 0 | 0 | 0 | 1 |
| Tripura | 2 | 0 | 10 | 0 | 0 | 0 | 12 |
| Mizoram | 0 | 0 | 2 | 5 | 0 | 0 | 7 |
| W Bengal | 6 | 0 | 15 | 0 | 0 | 0 | 21 |
| NE India | 39 | 3 | 76 | 24 | 1 | 5 | 148 |
| Total | 42 | 100 | 6 | ||||
For detailed report with state wise list of sites, kindly see; Overview of CWC Flood Forecasting Sites in North East.
NORTH INDIA
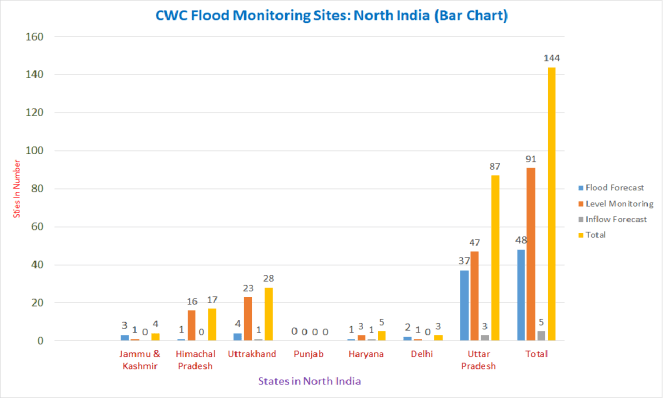
Overall there are 144 CWC sites in 7 states of North India comprising of 48 Level forecasting, 91 level monitoring and 6 inflow measuring sites. Out of 144 sites 13 sites are inactive including 11 level monitoring and 2 inflow monitoring. With 87, Uttar Pradesh state has highest number of sites followed by Uttrakhand (28) and Himachal Pradesh (17). There is no CWC station in Punjab whereas Delhi has 3, Jammu & Kashmir has 4 and Haryana state has 5 such sites. Of 11 inactive level monitoring sites 6 are in Himachal, 1 in Uttarakhand and 4 in Uttar Pradesh.
In case of most of the inflow forecast sites, the full information including level, inflow, outflow through canal, outflow through river is not given. It is also unclear at what stage the inflow forecast is triggered. Even the CWC’s Standard Operating Procedure of flood forecasting this year does not throw light on this, except vaguely stating that this is triggered by threshold values, not mentioning what are the threshold values for different cases.
Table of Level Forecasting, Level Monitoring and Inflow Forecast Sites in North Indian States
| States | Level Forecast
Sites |
Level Monitoring
Sites |
Inflow Forecast
Sites |
Total | |||
| Active | Inactive | Active | Inactive | Active | Inactive | ||
| Jammu & Kashmir | 3 | 0 | 1 | 0 | 0 | 0 | 4 |
| Himachal Pradesh | 1 | 0 | 10 | 6 | 0 | 0 | 17 |
| Uttrakhand | 4 | 0 | 22 | 1 | 1 | 0 | 28 |
| Punjab | 0 | 0 | 0 | 0 | 0 | 0 | 0 |
| Haryana | 1 | 0 | 3 | 0 | 1 | 0 | 5 |
| Delhi | 2 | 0 | 1 | 0 | 0 | 0 | 3 |
| Uttar Pradesh | 37 | 0 | 43 | 4 | 3 | 0 | 87 |
| Total | 48 | 0 | 80 | 11 | 5 | 0 | 144 |
| 48 | 91 | 5 | |||||
For detailed report with state wise list of sites, kindly see; Overview of CWC Flood Forecast Sites in North India
EAST INDIA
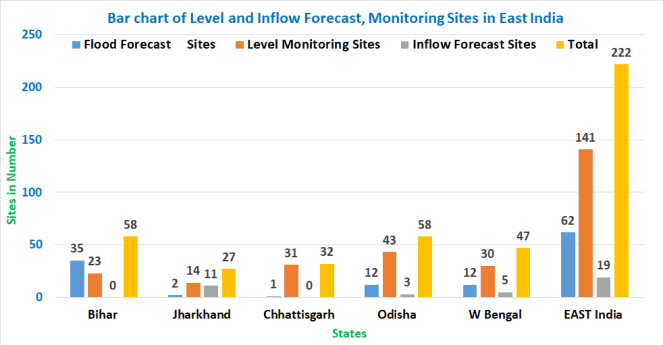
The 5 states of East India Bihar (58), Jharkhand (27), Chhattisgarh (32), Odisha (58), and West Bengal (47) have 222 sites. These comprise of 62 Flood Forecasting, 141 Level Monitoring and 19 Inflow Forecasting sites. 10 sites (4 per cent), which includes 1 Flood Forecasting, 5 Level Monitoring and 4 Inflow Forecasting are inactive. Jharkhand and Chhattisgarh states have only 2 and 1 Flood Forecasting Sites respectively whereas there is no Inflow Monitoring site in Bihar, Chhattisgarh states and only 2 in Odisha.
Summary Table of Level and Inflow Forecast, Monitoring Sites in East India
| States | Level Forecast Sites | Level Monitoring | Inflow Forecast Sites | Total | |||
| Active | Inactive | Active | Inactive | Active | Inactive | ||
| Bihar | 35 | 0 | 23 | 0 | 0 | 0 | 58 |
| Jharkhand | 2 | 0 | 14 | 0 | 9 | 2 | 27 |
| Chhattisgarh | 1 | 0 | 29 | 2 | 0 | 0 | 32 |
| Odisha | 11 | 1 | 42 | 1 | 2 | 1 | 58 |
| W Bengal | 12 | 0 | 28 | 2 | 4 | 1 | 47 |
| Total | 61 | 1 | 136 | 5 | 15 | 4 | 222 |
| 62 | 141 | 19 | |||||
For detailed report with state wise list of sites, kindly see; Overview of CWC Flood Forecast Sites in East India
SOUTH INDIA
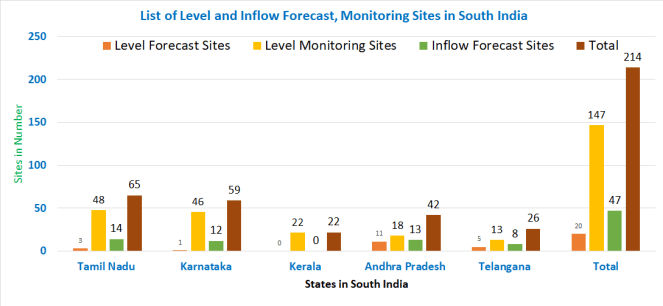
The 5 states of South India, namely Tamil Nadu (65), Karnataka (59), Kerala (22), Andhra Pradesh (42), Telangana (26) have 214 sites. These are comprised of 20 Level Forecasting, 147 Level Monitoring and 47 Inflow Forecasting sites. Out of 214 sites, 44 sites (20 per cent) including 3 Level Forecasting, 30 Level Monitoring and 11 Inflow Forecasting sites are inactive. Karnataka state has only 1 Level Forecasting Site. Kerala state does not have a single Level Forecasting and Inflow Forecasting site. HFL details and date is not provided for most of the sites in South India.
Summary Table of Level and Inflow Forecast, Monitoring Sites in South India
| States | Level Forecast Sites | Level Monitoring Sites | Inflow Forecast Sites | Total | |||
| Active | Inactive | Active | Inactive | Active | Inactive | ||
| Tamil Nadu | 3 | 0 | 29 | 19 | 12 | 2 | 65 |
| Karnataka | 1 | 0 | 37 | 9 | 12 | 0 | 59 |
| Kerala | 0 | 0 | 21 | 1 | 0 | 0 | 22 |
| Andhra Pradesh | 8 | 3 | 17 | 1 | 6 | 7 | 42 |
| Telangana | 5 | 0 | 13 | 0 | 6 | 2 | 26 |
| Total | 17 | 3 | 117 | 30 | 36 | 11 | 214 |
| 20 | 147 | 47 | |||||
For detailed report with state wise list of sites, kindly see; Overview of CWC Flood Forecast Sites in South India
WEST INDIA
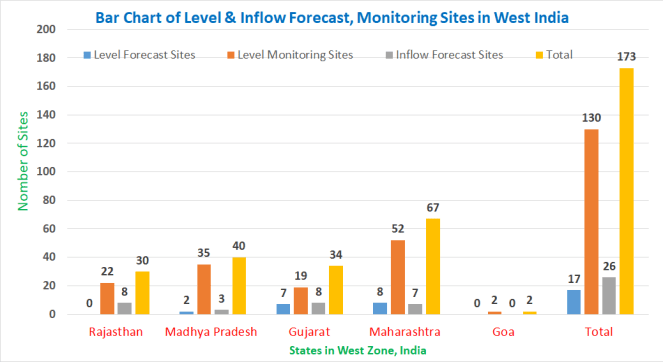
The 5 states of West, namely Rajasthan (30), Gujarat (34), Madhya Pradesh (40), Maharashtra (67), Goa (2) have 173 sites. These are comprised of 17 Level Forecasting, 130 Level Monitoring and 26 Inflow Forecasting sites. Out of 173 sites, 11 (6 per cent) sites including 2 Level Forecasting, 6 Level Monitoring and 3 Inflow Forecasting sites are inactive. Rajasthan state has no Level Forecasting Site. Goa state has not a single Level Forecasting and Inflow Forecasting site. HFL details and date is not provided for most of the sites in West India. Also the hydrographs for most of Inflow Forecasting sites are incomplete.
Summary Table of Level and Inflow Forecast, Monitoring Sites in West India
| States | Level Forecast Sites | Level Monitoring Sites | Inflow Forecast Sites | Total | |||
| Active | Inactive | Active | Inactive | Active | Inactive | ||
| Rajasthan | 0 | 0 | 21 | 1 | 8 | 0 | 30 |
| Madhya Pradesh | 2 | 0 | 32 | 3 | 3 | 0 | 40 |
| Gujarat | 6 | 1 | 19 | 0 | 5 | 3 | 34 |
| Maharashtra | 7 | 1 | 50 | 2 | 7 | 0 | 67 |
| Goa | 0 | 0 | 2 | 0 | 0 | 0 | 2 |
| Total | 15 | 2 | 124 | 6 | 23 | 3 | 173 |
| 17 | 130 | 26 | |||||
For detailed report with state wise list of sites, kindly see; Overview of CWC Flood Forecasting Sites in West India
UNION TERRITORIES
Out of 7 Union territories (UT), Delhi is included under North zone. 3 of the UTs Andman & Nicobar, Chandigarh and Laskhadweep has no sites. Daman & Diu has 1 Level Forecasting site and Dadar & Nagar Haveli has one Level Monitoring site. There are 3 Level Monitoring sites in Pondicherry. In all 6 UTs excluding Delhi have 5 sites comprising of 1 Level Forecasting and 4 Level Monitoring sites. There is no Inflow Forecasting site in any of the UTs.
DAMAN & DIU
List of Level Forecasting Sites in Daman & Diu
| SN | Site | River | Sub Basin | District | WL | DL | HFL, M | Date |
| 1 | Daman | Daman Ganga | WFR South of Tapi | Daman | 2.6 | 3.4 | 4.0 | 03-08-2004 |
DADAR & NAGAR HAVELI
List of Level Monitoring Sites in Dadra & Nagar Haveli
| SN | Site | River | Sub Basin | District | HFL, M | Date |
| 1 | SILVASSA | Daman Ganga | WFR South of Tapi | Dadra & Nagar Haveli | NA | NA |
PONDICHERRY
List of Level Monitoring Sites in Pondicherry
| SN | Site | River | Sub Basin | District | HFL, M | Date |
| 1 | Kumarapalayam | Varahanadhi | EFR B Pennar-Cauvery | Pondicherry | 13.12 | 31-12-2011 |
| 2 | Annavasal | Nattar | Cauvery | Karaikal | 5.985 | 24-11-1999 |
| 3 | Nallathur | Nandalar | Cauvery | Karaikal | 5.665 | 28-11-2008 |
Summary Table of Level and Inflow Forecast, Monitoring Sites in Union Territories
| Union Territories | Level Forecast Sites | Level Monitoring Sites | Inflow Forecast Sites | Total | |||
| Active | Inactive | Active | Inactive | Active | Inactive | ||
| Andman & Nicobar | 0 | 0 | 0 | 0 | 0 | 0 | 0 |
| Chandigarh | 0 | 0 | 0 | 0 | 0 | 0 | 0 |
| Daman & Diu | 1 | 0 | 0 | 0 | 0 | 0 | 1 |
| Dadar & Nagar Haveli | 0 | 0 | 1 | 0 | 0 | 0 | 1 |
| Lakshadweep | 0 | 0 | 0 | 0 | 0 | 0 | 0 |
| Pondicherry | 0 | 0 | 2 | 0 | 0 | 0 | 2 |
| Total | 1 | 0 | 3 | 0 | 0 | 0 | 4
|
| 1 | 3 | 0 | |||||
Summary of CWC Flood Monitoring Sites in India:
Based on the overview of the CWC Flood Forecast website. There are 885 sites in India comprising of 185 Level Forecast, 597 Level Monitoring and 103 Level Forecast Sites. Out of 885 sites 10 Level Forecast, 76 Level Monitoring and 23 Inflow Forecasting Sites are inactive.
Maximum number of sites among all regions are in East India with 222 sites, South India 214 sites and West India 173 sites. North India has 144 sites and North East India has 128 sites.
Out of 103 Inflow forecast sites, 23 sites which is almost 23 per cent are inactive. Most of the Inflow Monitoring sites have incomplete hydrographs. Similarly 15 per cent of Level Monitoring sites and 6 per cent of Level Forecast sites are inactive. In several states, names of sites and districts are repeated with slight change in spellings. Similarly the HFL data and date is mission for many sites.
Summary Table of Level and Inflow Forecast, Monitoring Sites in India
| Zones | Level Forecast Sites | Level Monitoring Sites | Inflow Forecast Sites | Total | |||
| Active | Inactive | Active | Inactive | Active | Inactive | ||
| North East | 33 | 4 | 61 | 24 | 1 | 5 | 128 |
| North | 48 | 0 | 80 | 11 | 5 | 0 | 144 |
| East | 61 | 1 | 136 | 5 | 15 | 4 | 222 |
| South | 17 | 3 | 117 | 30 | 36 | 11 | 214 |
| West | 15 | 2 | 124 | 6 | 23 | 3 | 173 |
| Union Territories | 1 | 0 | 3 | 0 | 0 | 0 | 4 |
| Total | 175 | 10 | 521 | 76 | 80 | 23 | 885 |
| 185 | 597 | 103 | |||||

A SANDRP analysis (ht.sandrp@gmail.com)
END NOTES:
- The sites shown with RED color are inactive and the sites which have no WL, DL, HFL data but have active Hydro Graph are listed with GREEN color.
- Abbreviations List: Warning Level – WL Danger Level – DL Full Reservoir Level – FRL Maximum Water Level – MWL High Flood Level – HFL Meters – M
[i] http://india-water.gov.in/ffs/
[ii] https://sandrp.in/2018/08/03/overview-of-cwc-flood-forecasting-sites-north-india/
[iii] https://sandrp.in/2018/08/05/overview-of-cwcs-flood-monitoring-forecasting-in-north-east-india/
[iv] https://sandrp.in/2018/08/30/overview-of-cwc-flood-forecasting-sites-east-india/
[v] https://sandrp.in/2018/08/31/south-india-overview-of-cwc-flood-forecasting-sites/
[vi] https://sandrp.in/2018/09/11/west-india-overview-of-cwc-flood-forecasting-sites/
To see similar zone wise overviews of CWC’s Flood Forecasting Sites, kindly explore following links:-
Overview of CWC Flood Forecasting Sites 2018: North India
Overview of CWC’s Flood Forecasting Sites 2018: North East India
Overview of CWC Flood Forecasting Sites 2018: East India
