
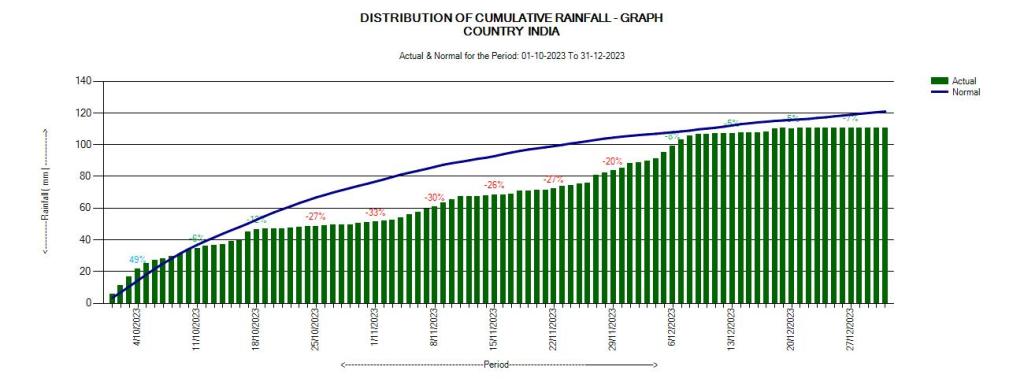
According to India Meteorological Department (IMD), during the just concluded Post Monsoon Rainfall for 2023, that included rainfall during the three Oct-Dec 2023 months, India received 110.7 mm rainfall, 9% below normal (144.1 mm, 19% above normal in Post Monsoon 2022[i] and 177.7 mm rainfall, 43.54% above normal in Post Monsoon 2021[ii]) rainfall of 121 mm. In the same period in 2020, India received 124.6 mm rainfall, 0.64% above the normal rainfall. As per IMD[iii] definition, the rainfall in Post Monsoon 2023 was in Normal Rainfall category.
This three-month period from Oct 1, to Dec 31 includes the North East Monsoon that mainly affects parts of South India including Tamil Nadu, Puducherry, Rayalseema, parts of Karnataka and Kerala. However, since the South West Monsoon had not yet withdrawn from the country by Sept 30, a significant proportion of the rainfall in October was contribution of the SW monsoon. This was similar situation in Post Monsoon 2019, 2020[iv], 2021 and 2022.
The period also includes the rainfall that most of North India gets from western disturbances, but that contribution has been relatively low so far this year. Prevailing conditions of El Nino has also made some contribution in decreasing the rainfall significantly. In contrast, it was La Nina that prevailed during Post Monsoon 2022 and 2021, but not in 2020.
In Post Monsoon season of 2019, India received 160 mm rainfall[v] in this season, 29% above normal, when 2019 was not a La Nina year.
Monthly rainfall The distribution of rainfall for the three months of Post Monsoon 2022 season as per IMD is as follows.
| Month | Actual Rainfall, mm | Normal Rainfall, mm | % Departure from Normal |
| Oct 2023 | 50.8 | 75.4 | -33 |
| Nov 2023 | 34.2 | 29.7 | +16 |
| Dec 2023 | 25.4 | 15.9 | +60 |
| Post Monsoon 2023 | 110.7 | 121 | -19 |
As can be seen from the table, it is the deficit in Oct 2023 that is leading to deficit in Post Monsoon 2023 rainfall. The surplus rainfall in Nov and Dec 2023 was partly due to Cyclones in South India including Severe Cyclonic Storm Michaung in early Dec 2023. The Bar chart giving daily cumulative Actual and Normal Rainfall figures for Post Monsoon 2023 is given below.
Major unknown One major unknown, here is that it is not clear if IMD’s these reported figures include the contribution from snowfall and if so, what is the contribution of snowfall. It is not even known looking at the IMD website if IMD even monitors the snowfall figures and if so, what are they. We cannot find any reporting of the snowfall figures in any case. This is worrying since snowfall is expected to make a significant contribution during winter months and we seem to be in total dark as to what is the quantum of snowfall in different districts, states, in different months & years.
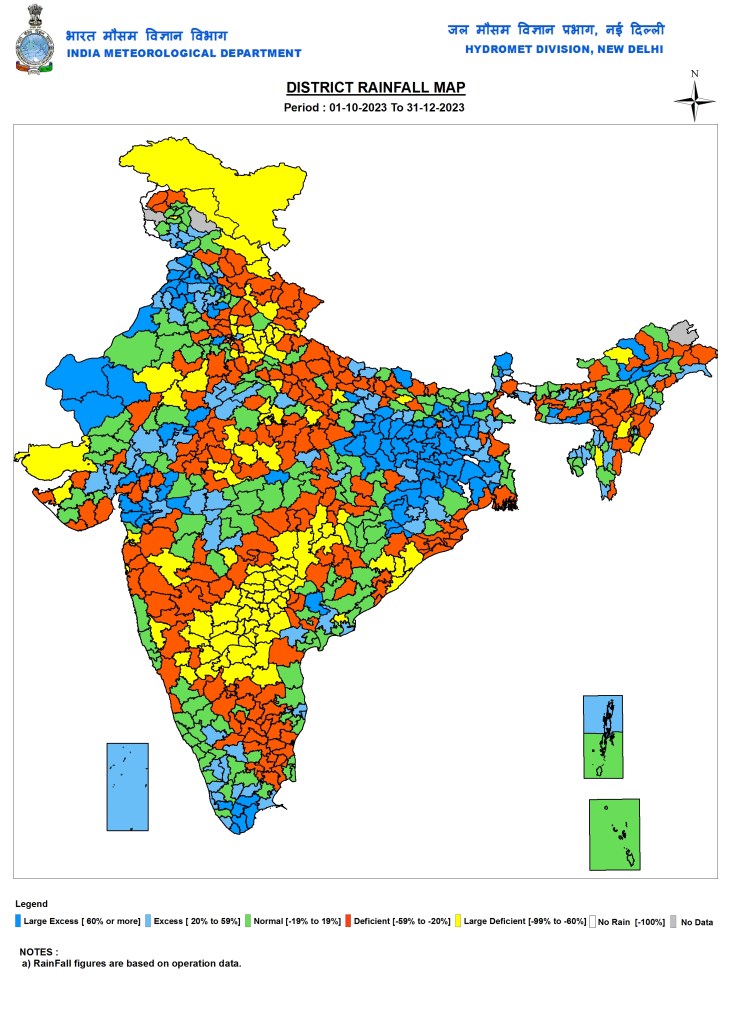
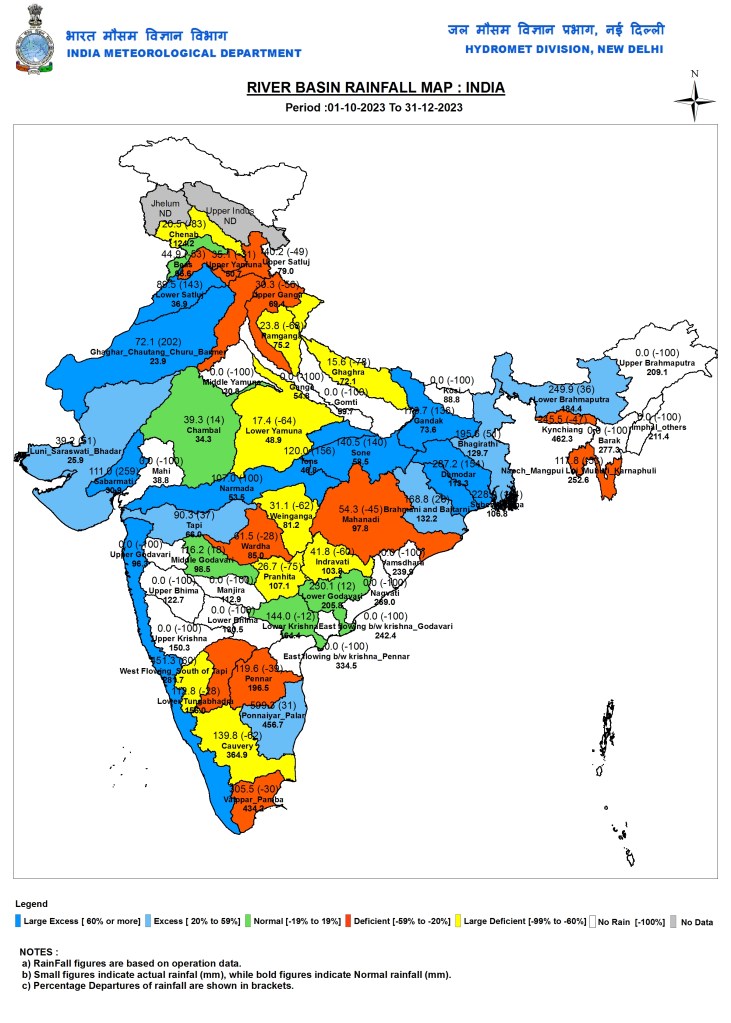
ALL INDIA: District wise rainfall map
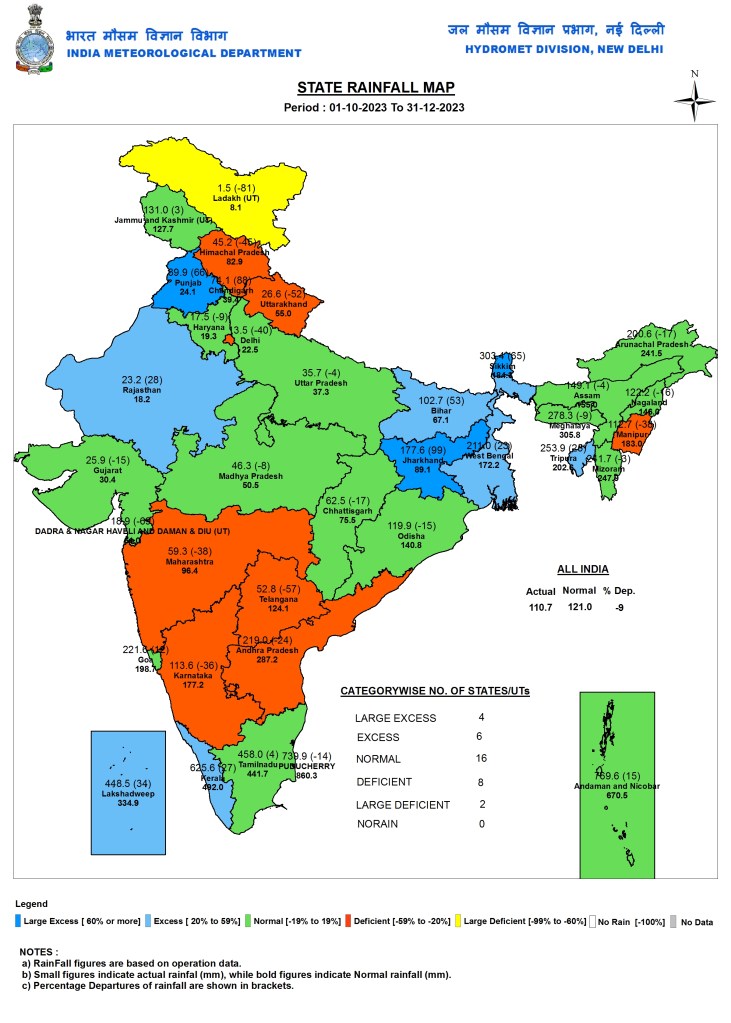
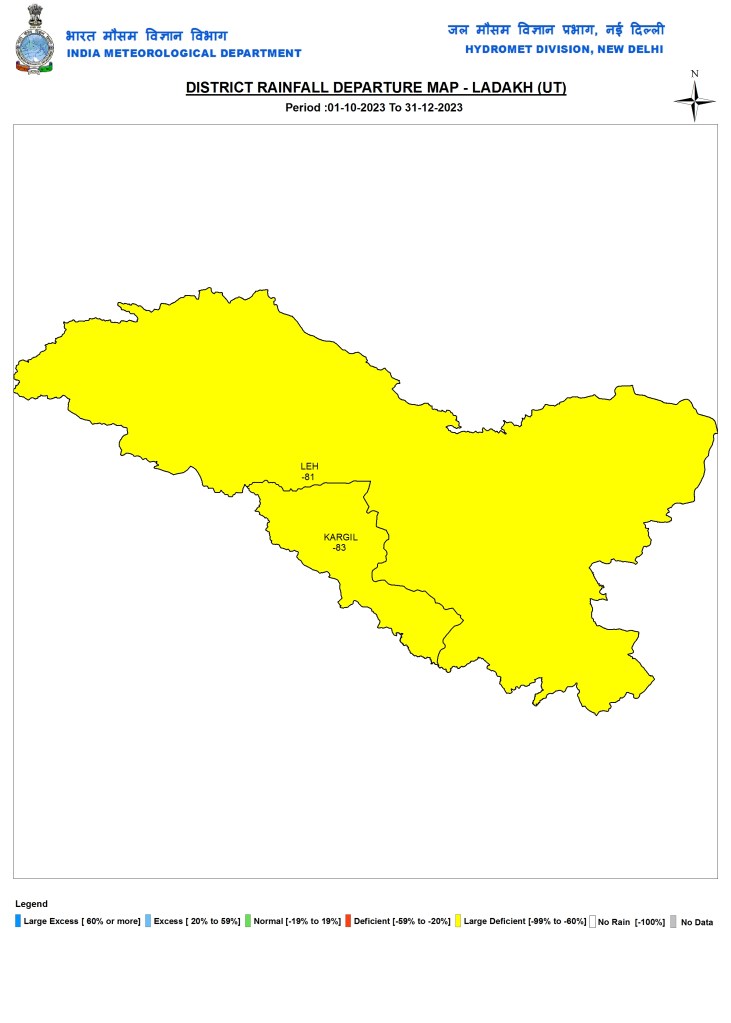
State wise rainfall Four States and Union Territories (UTs) had Large Excess Rainfall (more than 60% above Long Period Average or LPA), 6 had Excess (20-59% above LPA), 16 had normal (19% below to 19% above normal) and 8 states and UTs had Deficit Rainfall (20 to 59% below normal) and Two (Ladakh, Diu Daman, Dadar and Nagarhaveli) had Large Deficit (deficit over 60% of normal) during Oct Dec 2023 period in India. Here LPA is Long period average, taken as average of the rainfall during 1971-2020. Ladakh had the highest deficit at 81% and Jharkhand had the highest surplus at 99%. Pondicherry, like in Post Monsoon 2022 had the highest rainfall at 739.9 mm, way above the 2nd highest rainfall in Kerala at 625.6 mm.
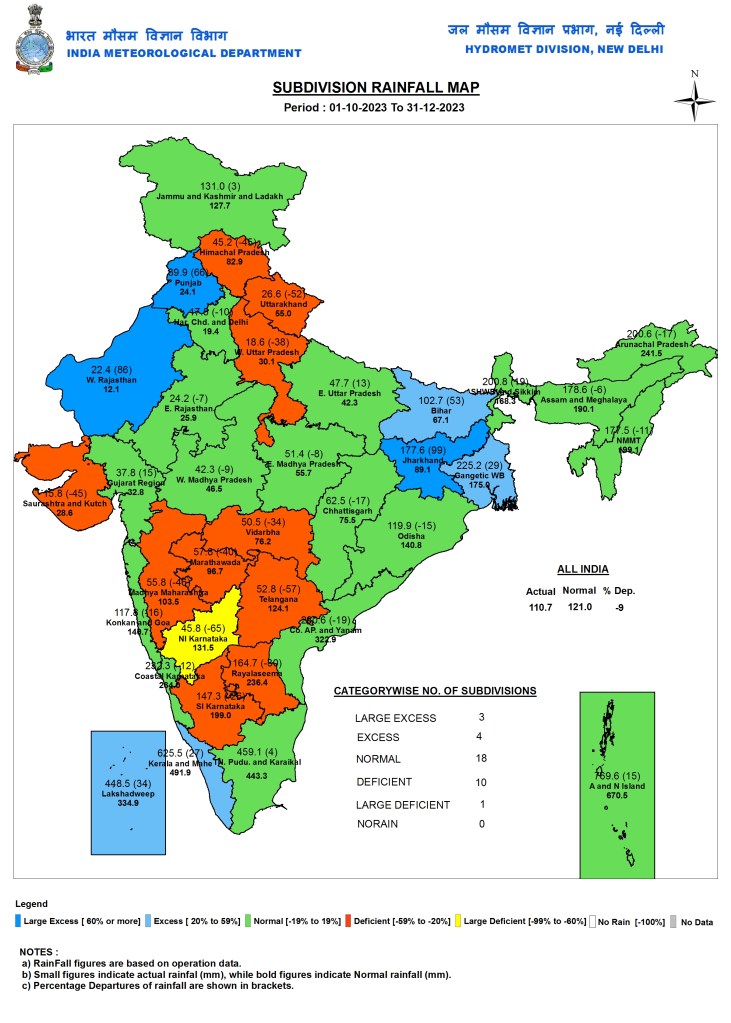
Sub-Division wise rainfall Among IMD’s 36 sub divisions, 3 received Large Excess, 4 received Excess, 18 received Normal, 10 received Deficit rainfall and 1 (North Interior Karnataka) had large deficit. Like in 2020, 2021 and 2022, Andaman and Nicobar Islands received the highest sub-divisional rainfall at 769.6 mm.
River basin wise rainfall The IMD also reports river basin wise rainfall, which is actually the most important way to report rainfall. But this year too IMD unfortunately has done a rather callous job of it. During Post Monsoon 2023 season, IMD reports ZERO rainfall in several basins: Middle Yamuna, Ganga, Gomati, Mahi, Upper Godavari, Upper Bhima, Lower Bhima, Manjira, Upper Krishna, Vamsadhara, Nagvati, East Flowing Rivers between Krishna and Godavari and East Flowing Rivers between Krishna and Pennar, Upper Brahmaputra, Imphal & Others, Barak and one more basin. This is clearly an impossibility. For two river basins (Jhelum and Upper Indus) IMD had no rainfall data (like was the case in 2019, 2020, 2021 and 2022)!
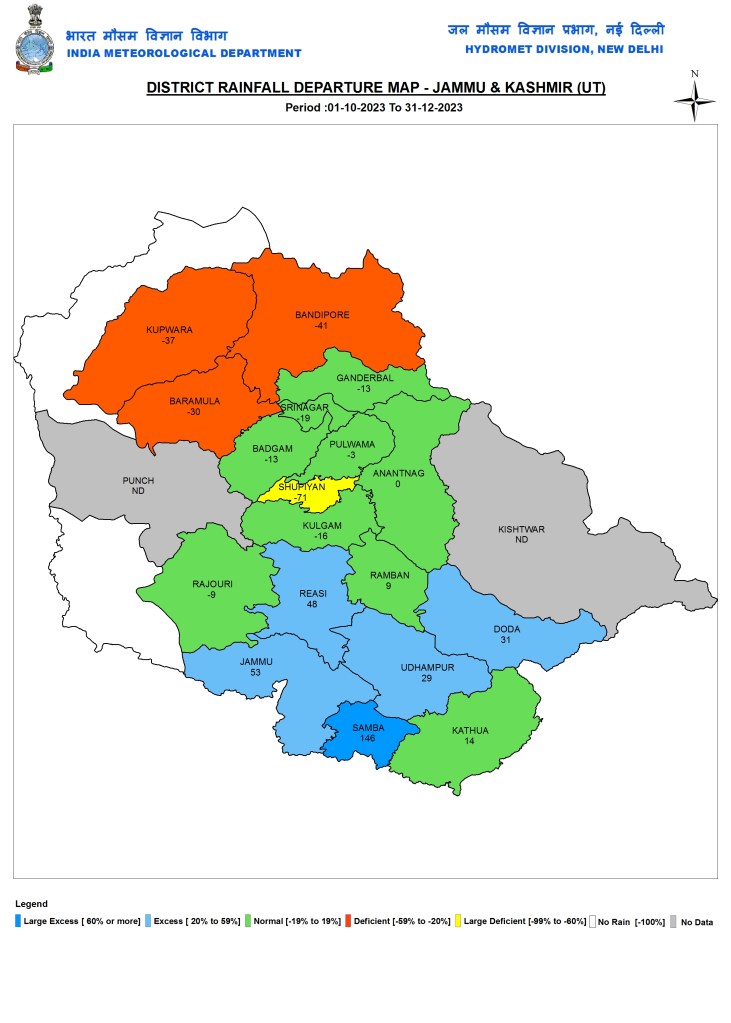
STATE WISE DISTRICT WISE RAINFALL: NORTH ZONE: Jammu and Kashmir
Ladakh
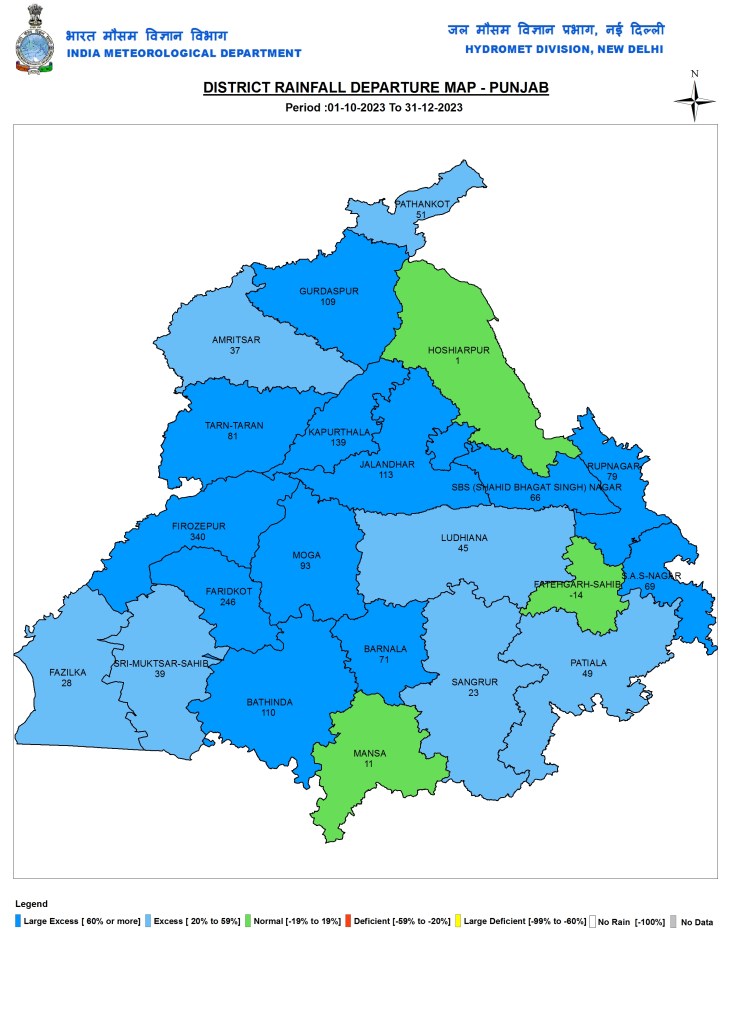
Punjab
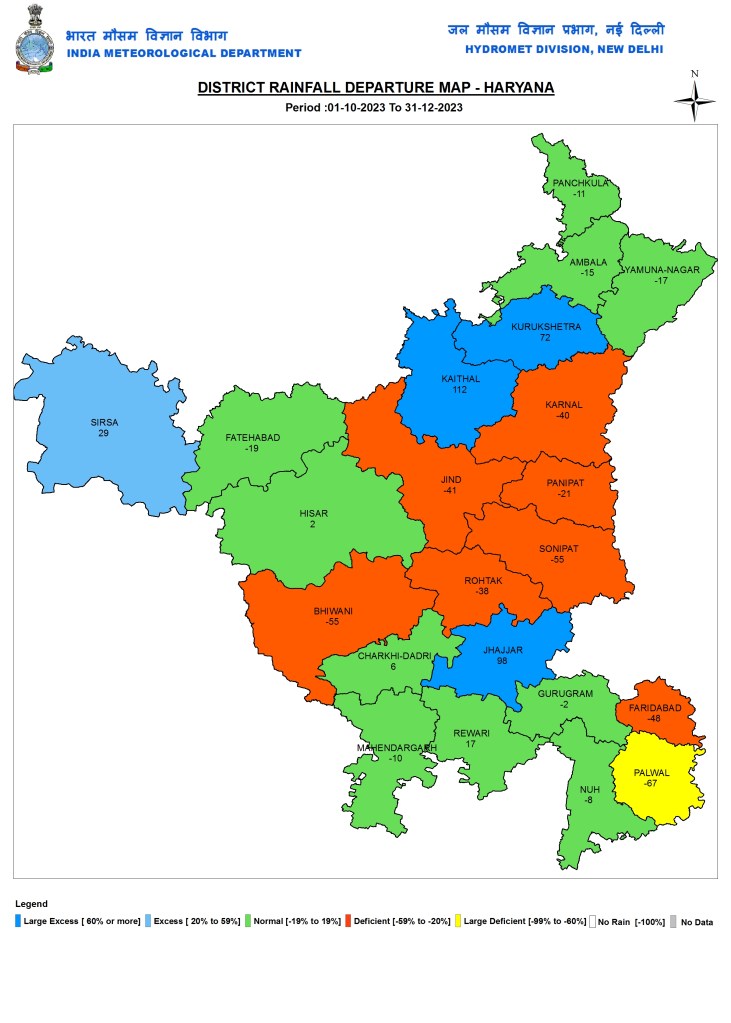
Haryana
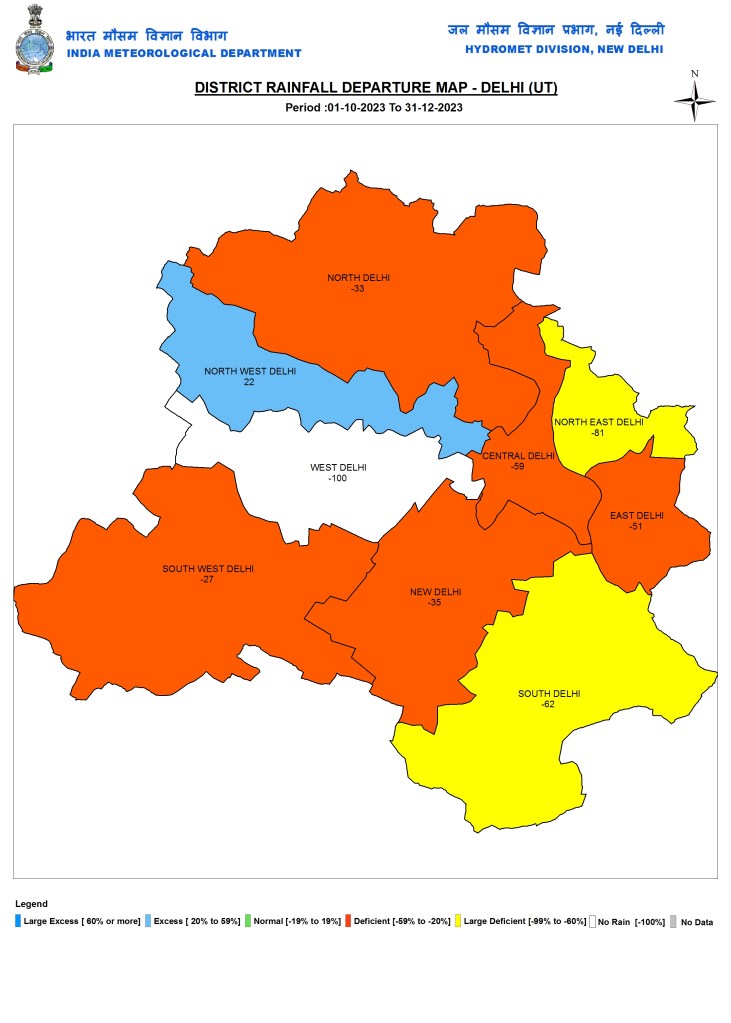
Delhi
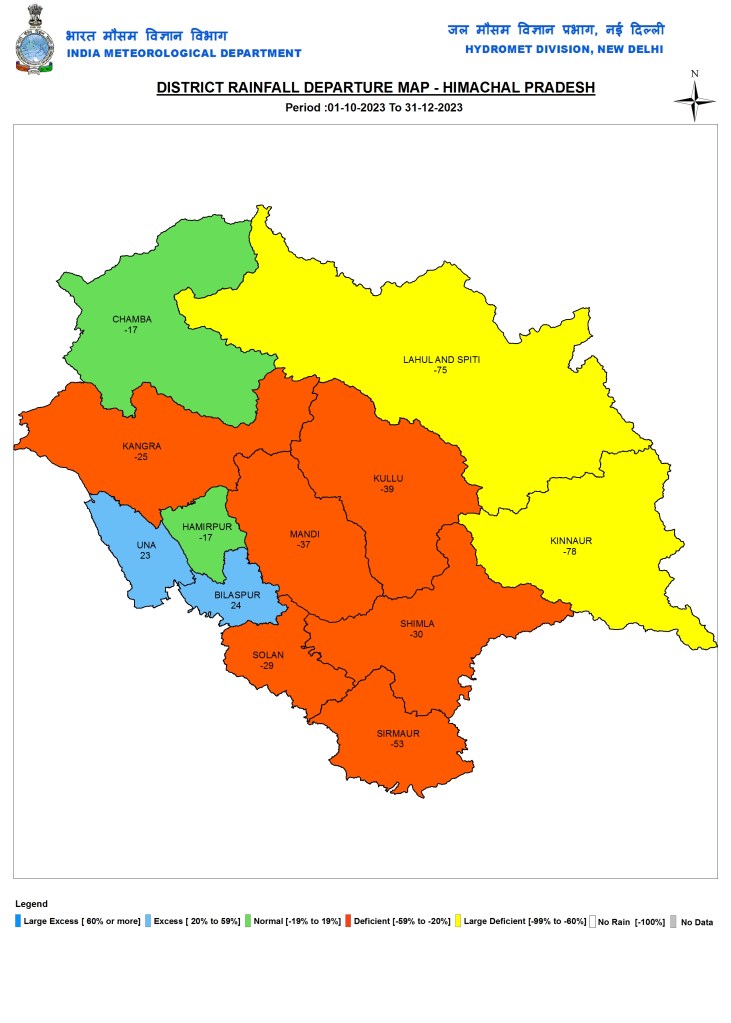
Himachal Pradesh
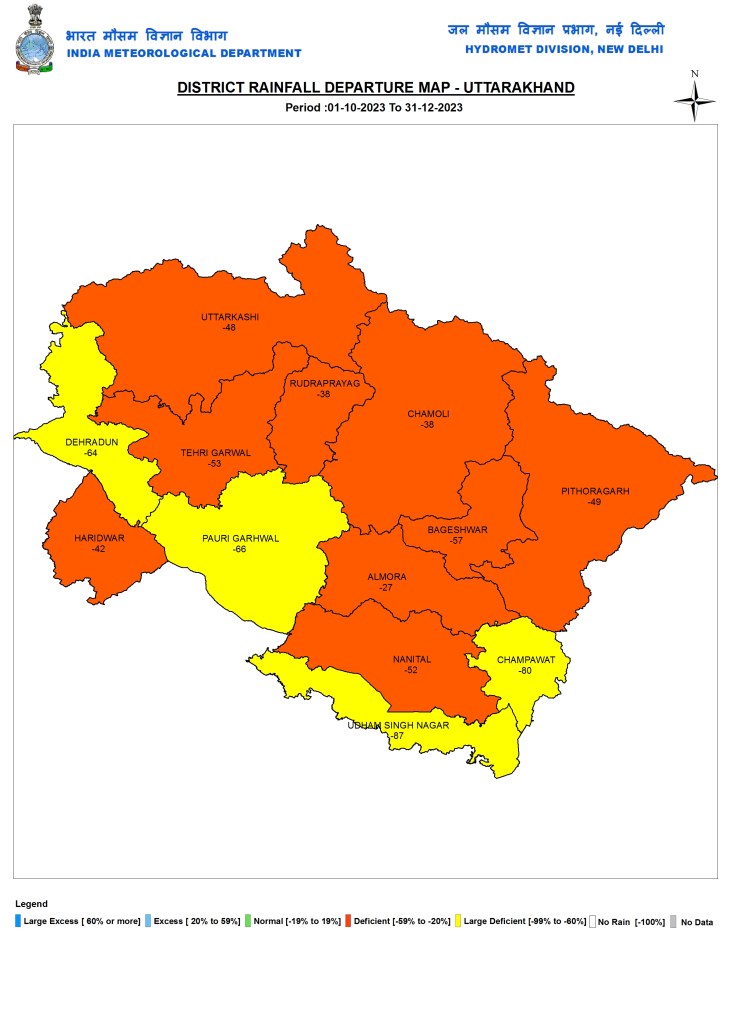
Uttarakhand
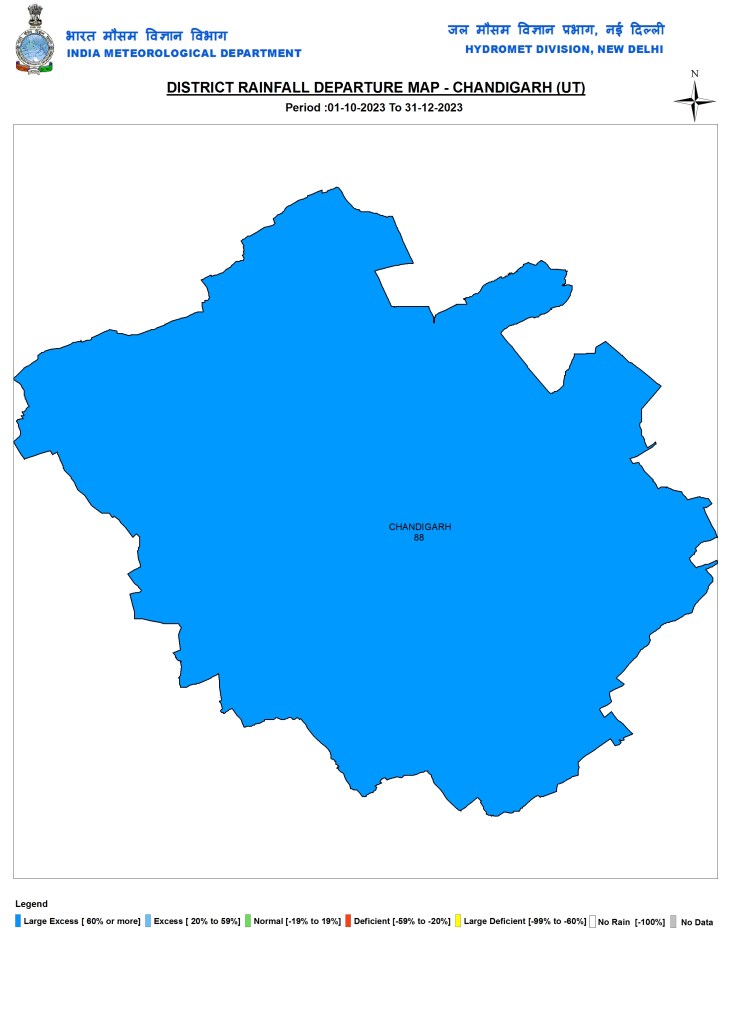
Chandigarh
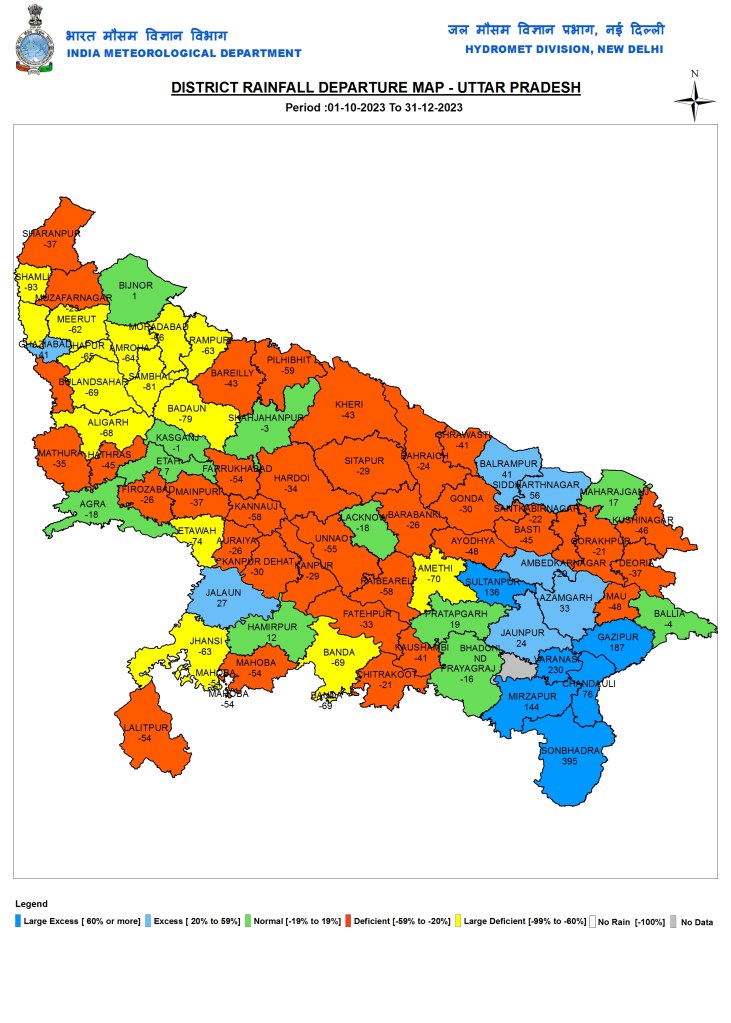
EAST ZONE: Uttar Pradesh
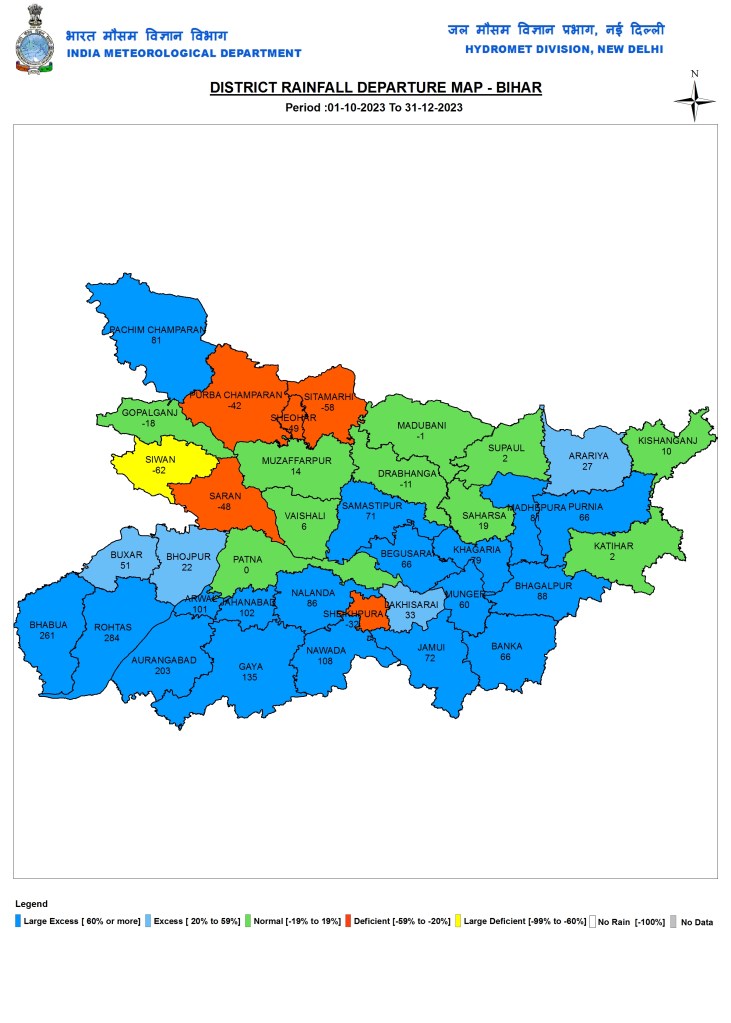
Bihar
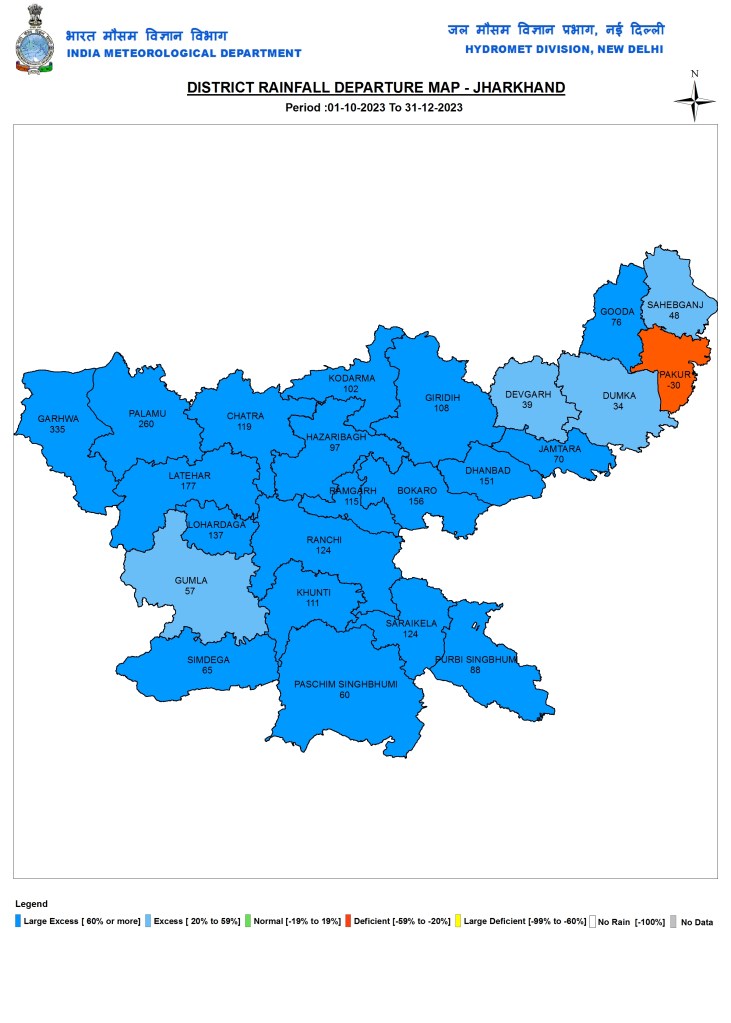
Jharkhand
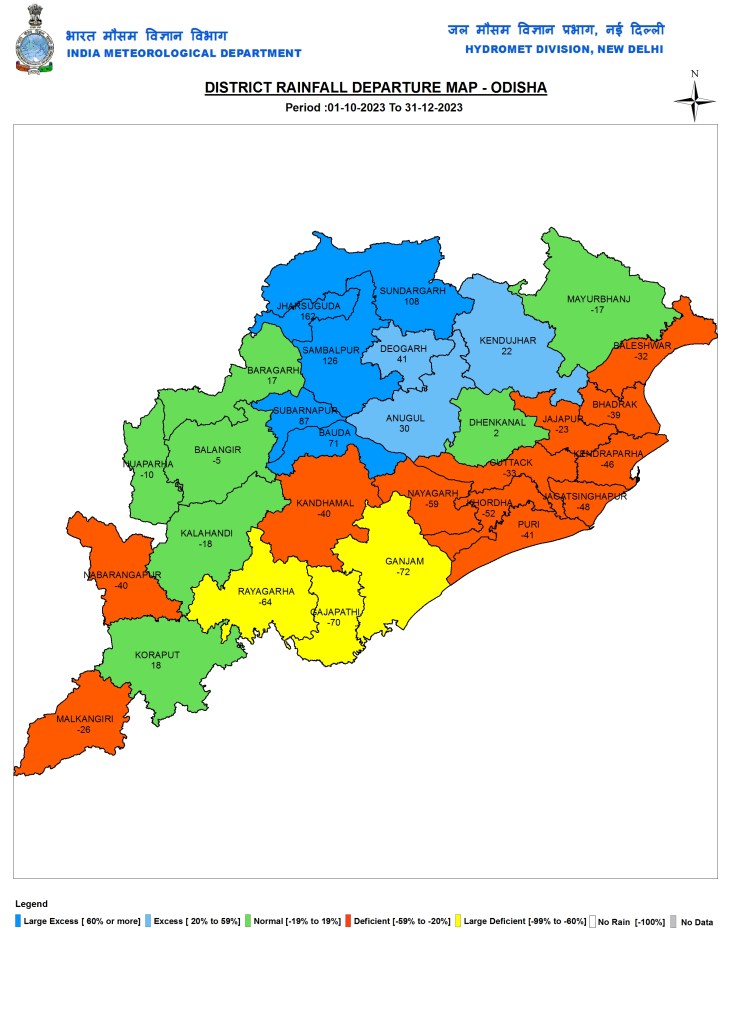
Odisha
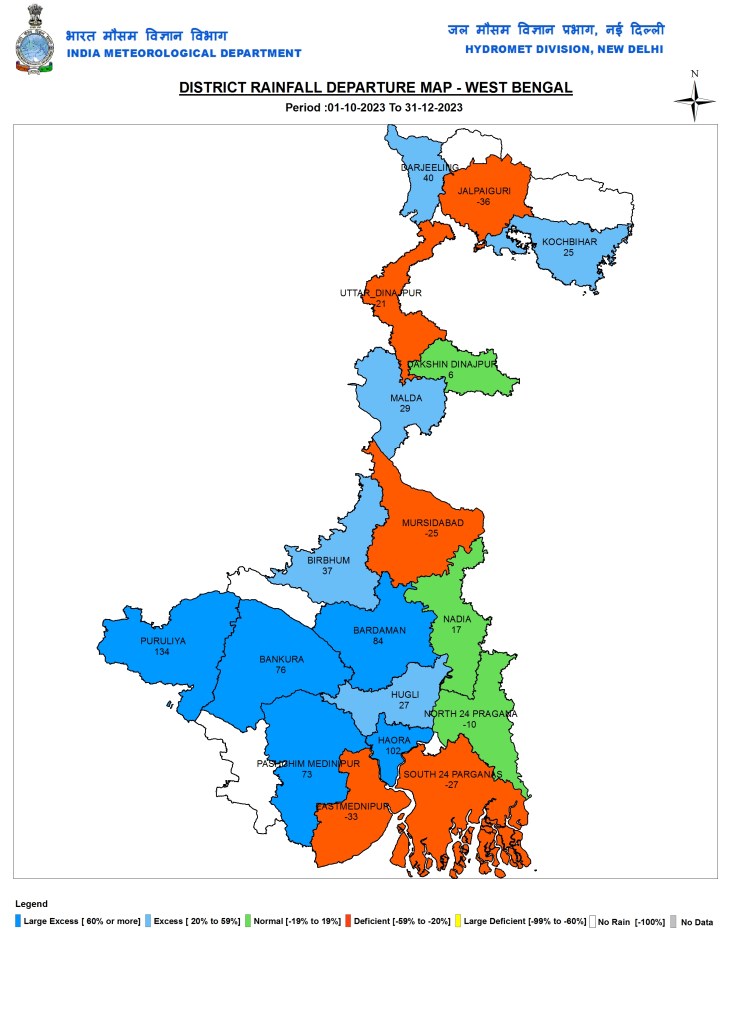
West Bengal
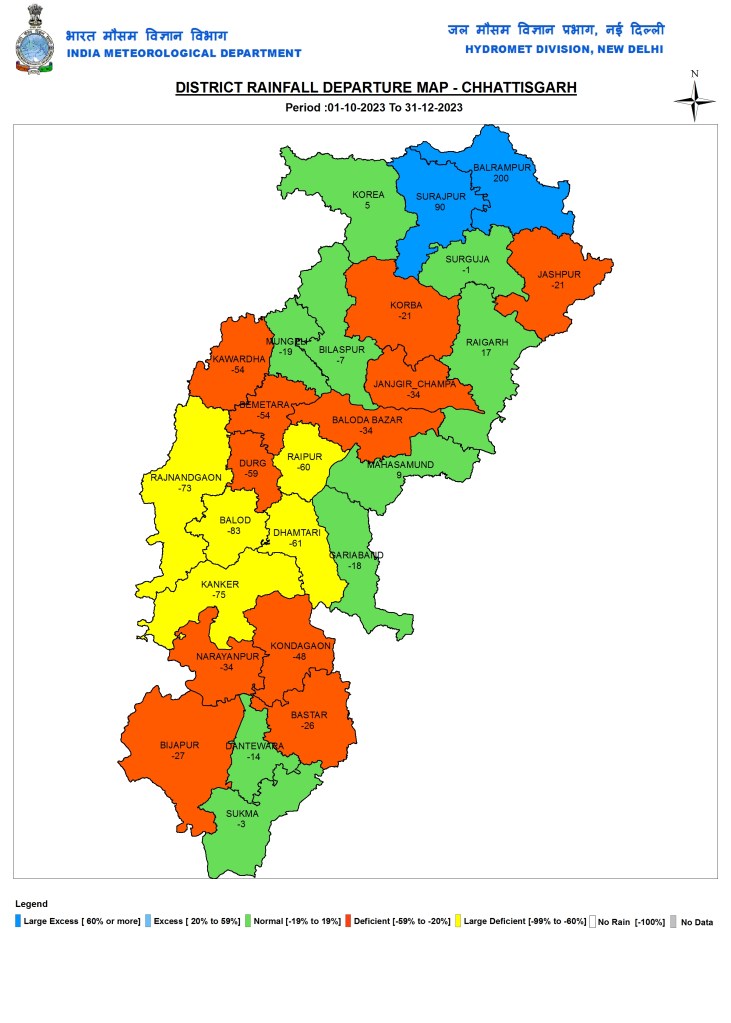
Chhattisgarh
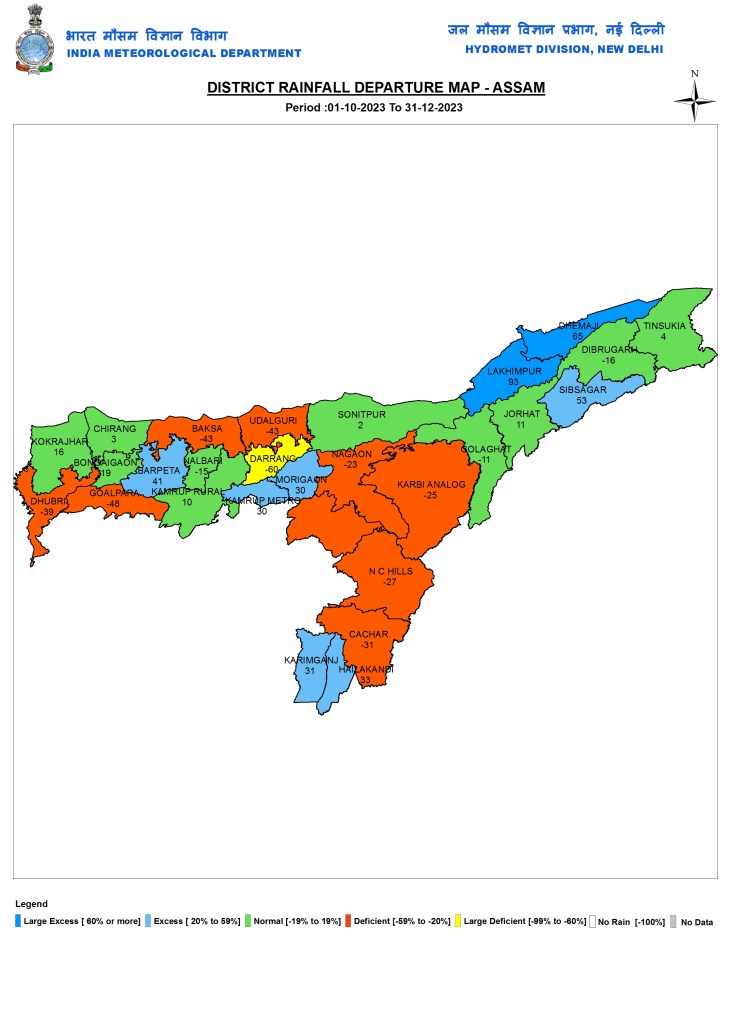
NORTH EAST ZONE: Assam
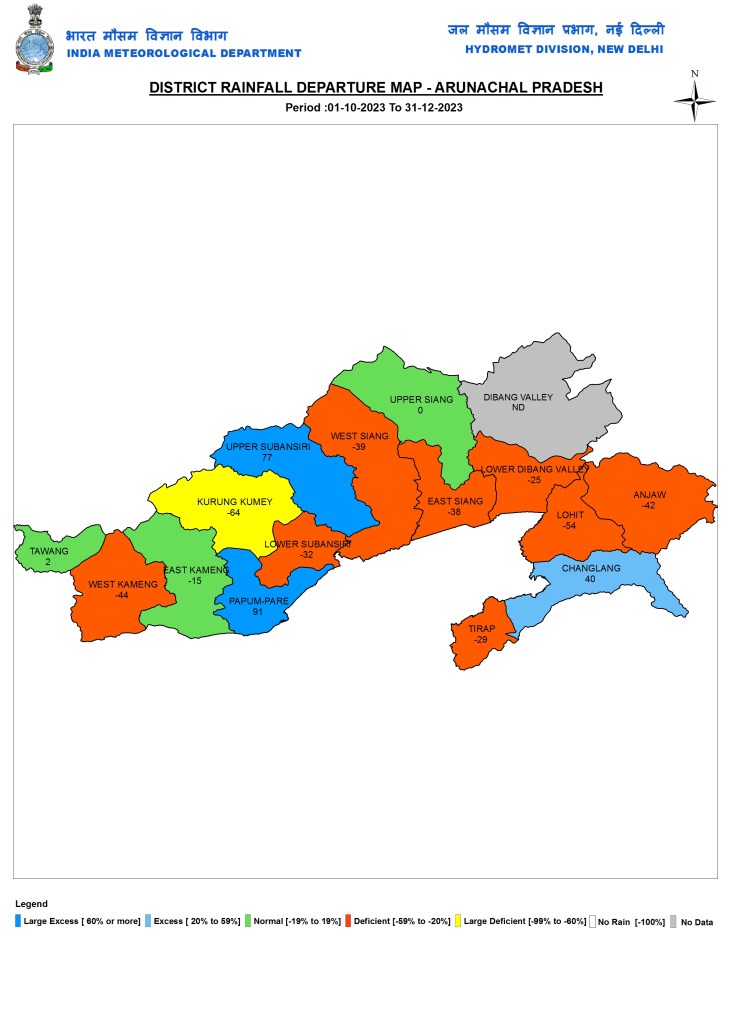
Arunachal Pradesh
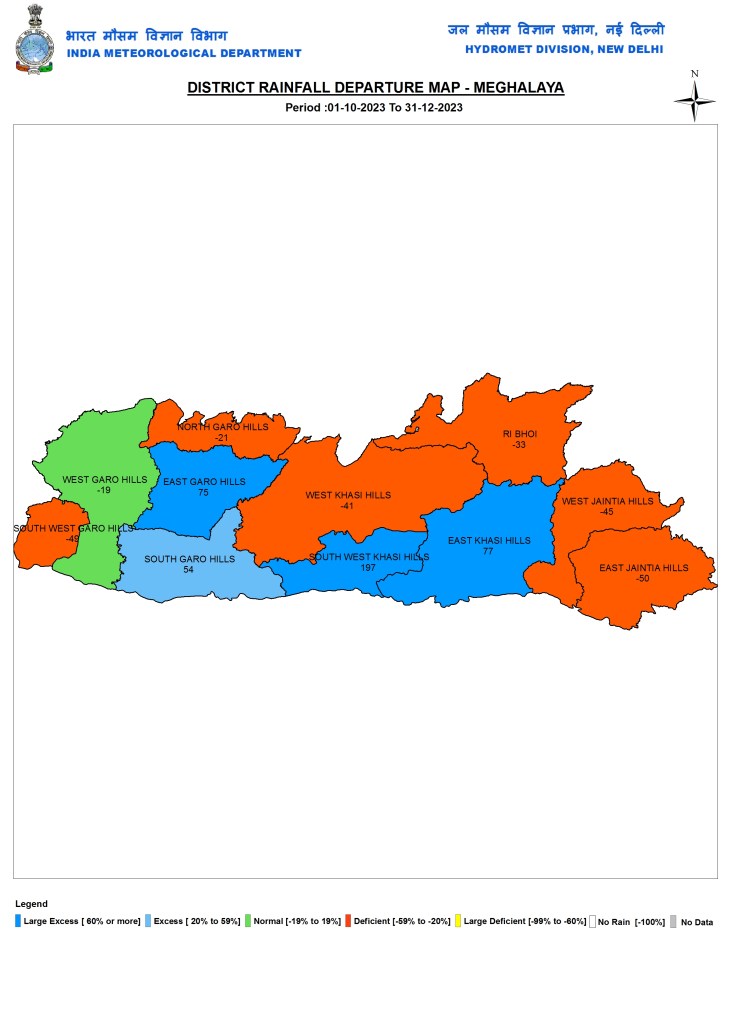
Meghalaya
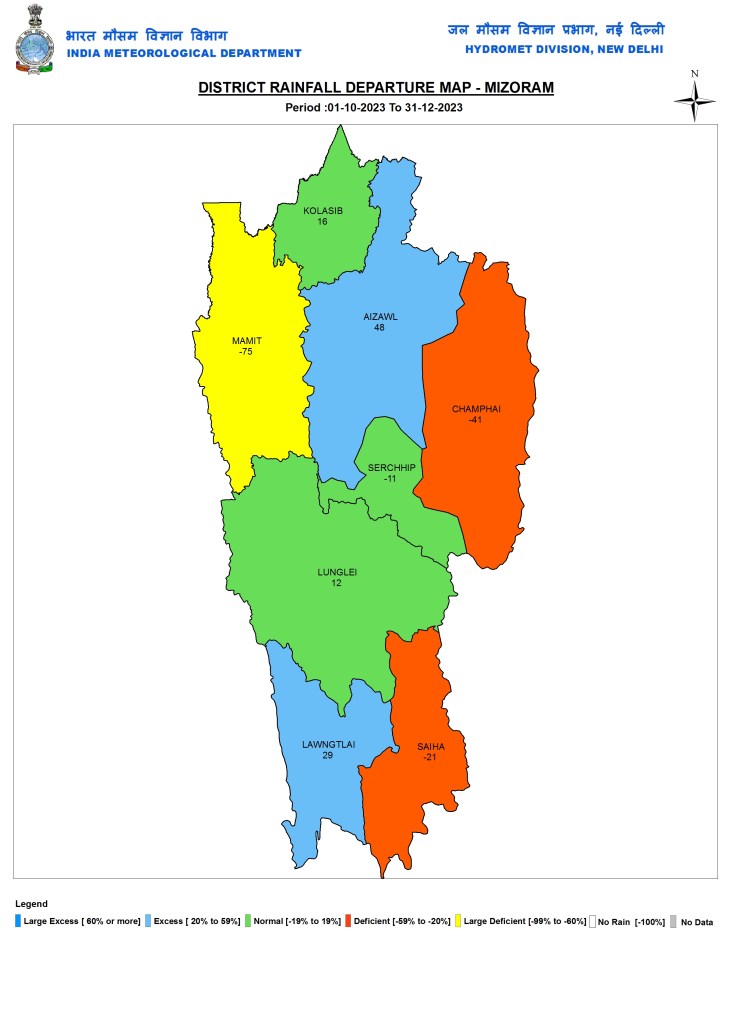
Mizoram
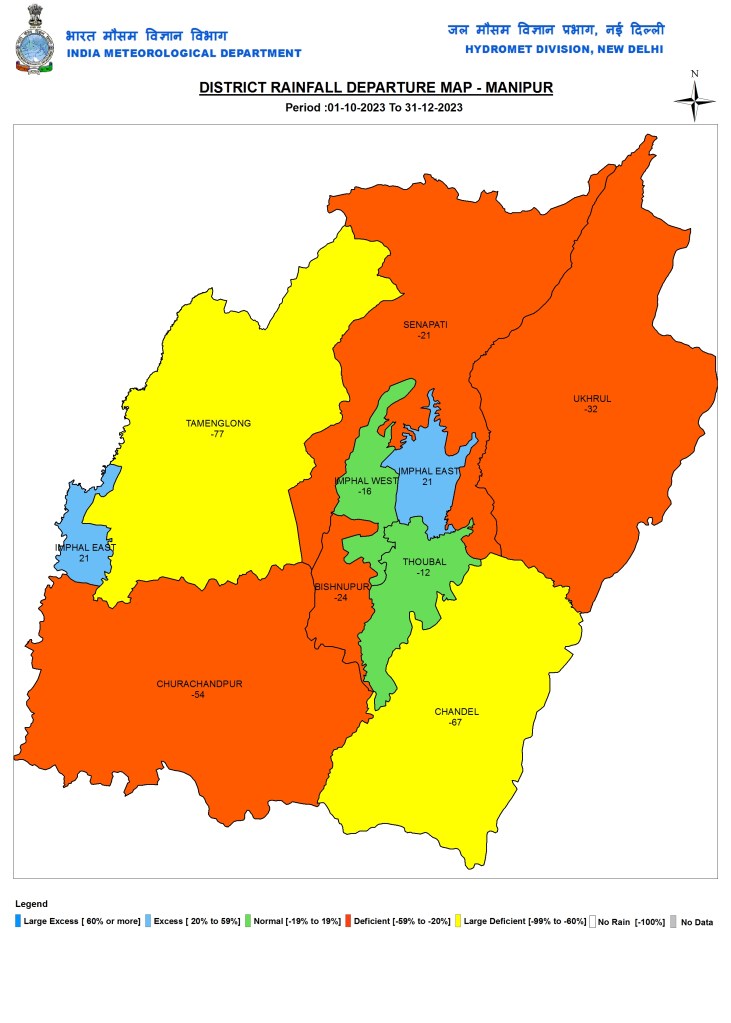
Manipur
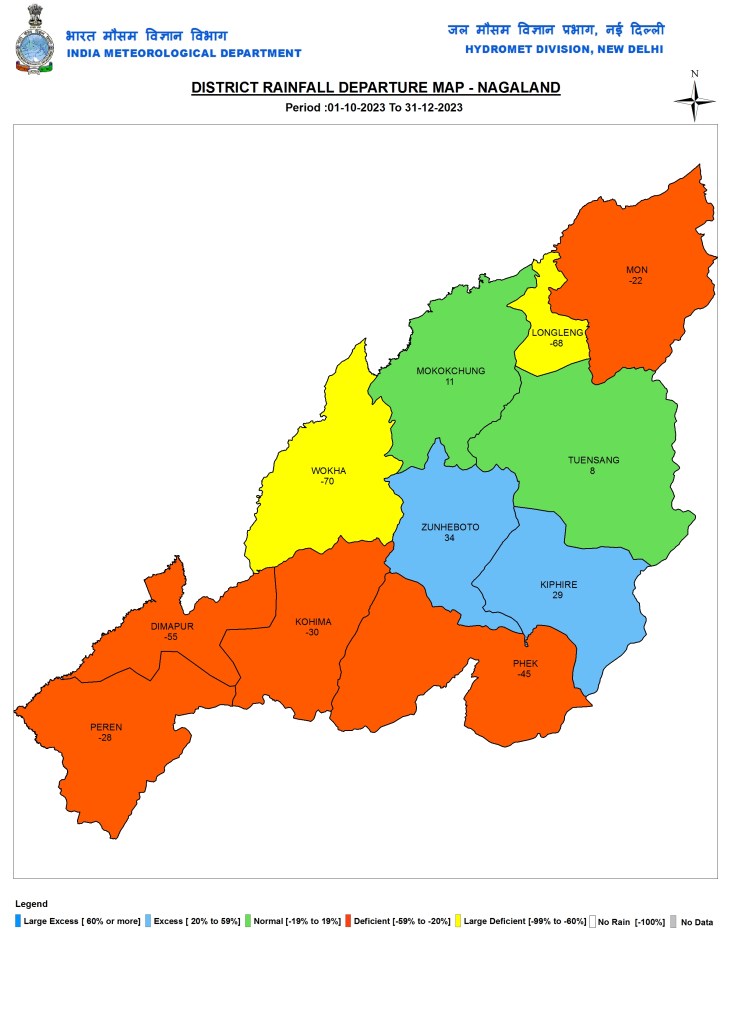
Nagaland
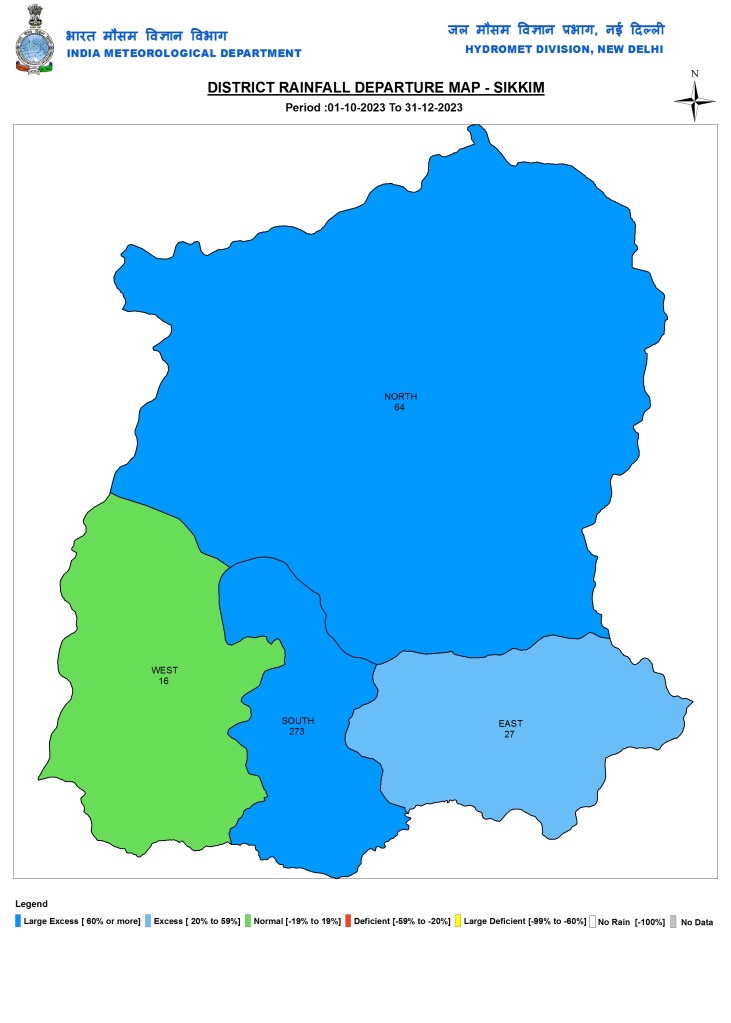
Sikkim
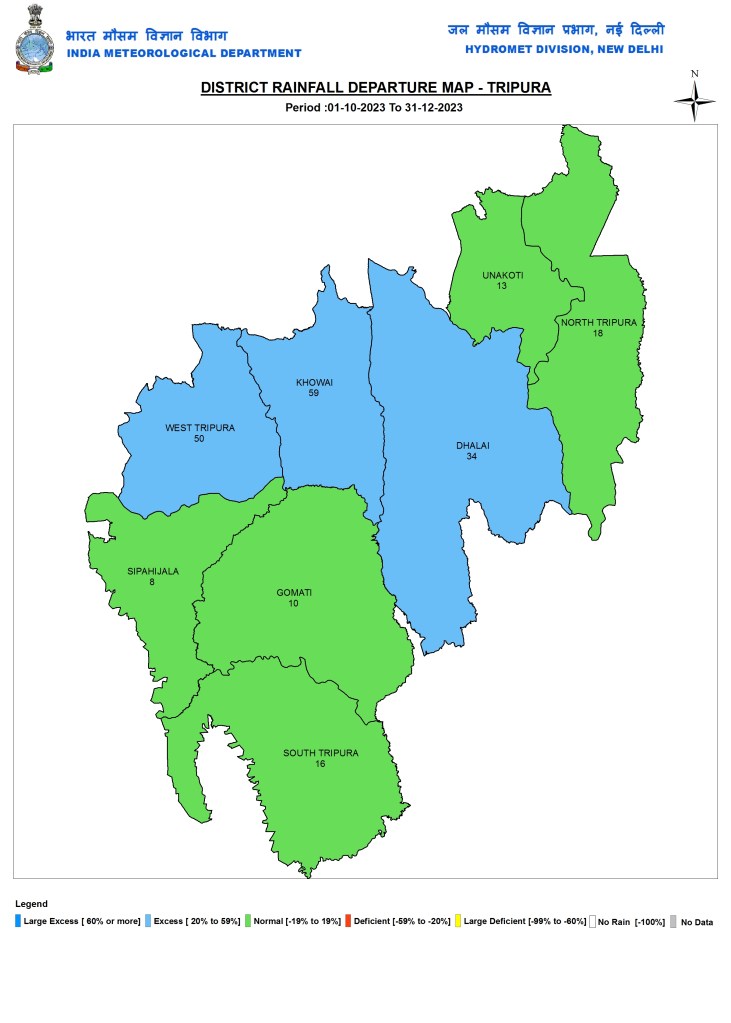
Tripura
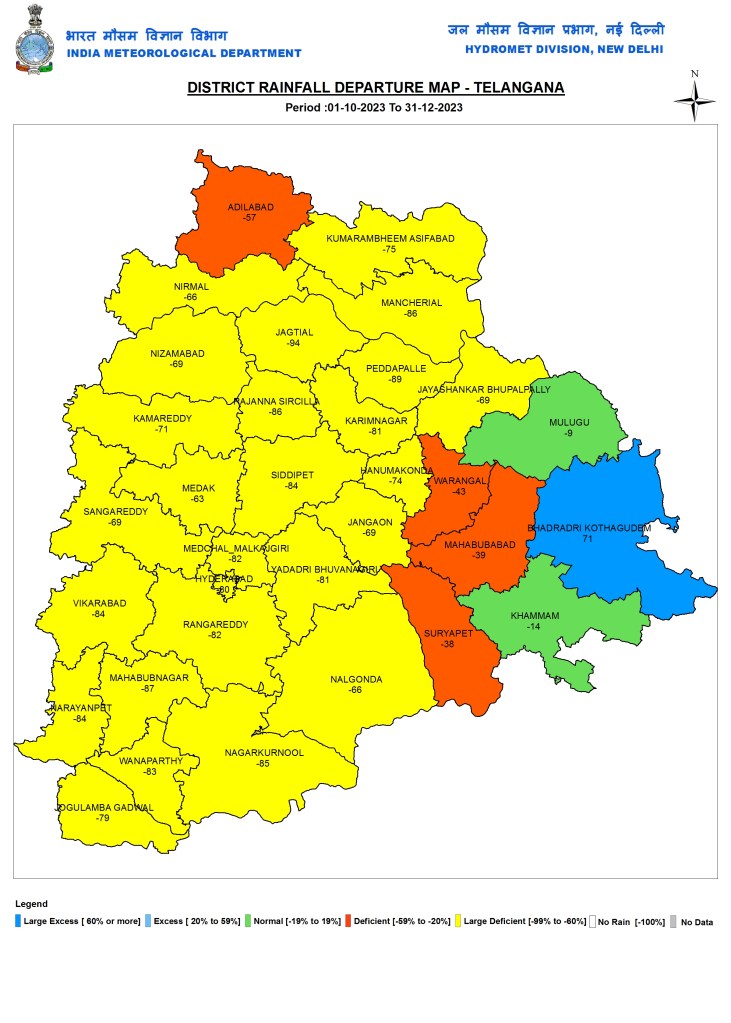
SOUTH ZONE: Telangana
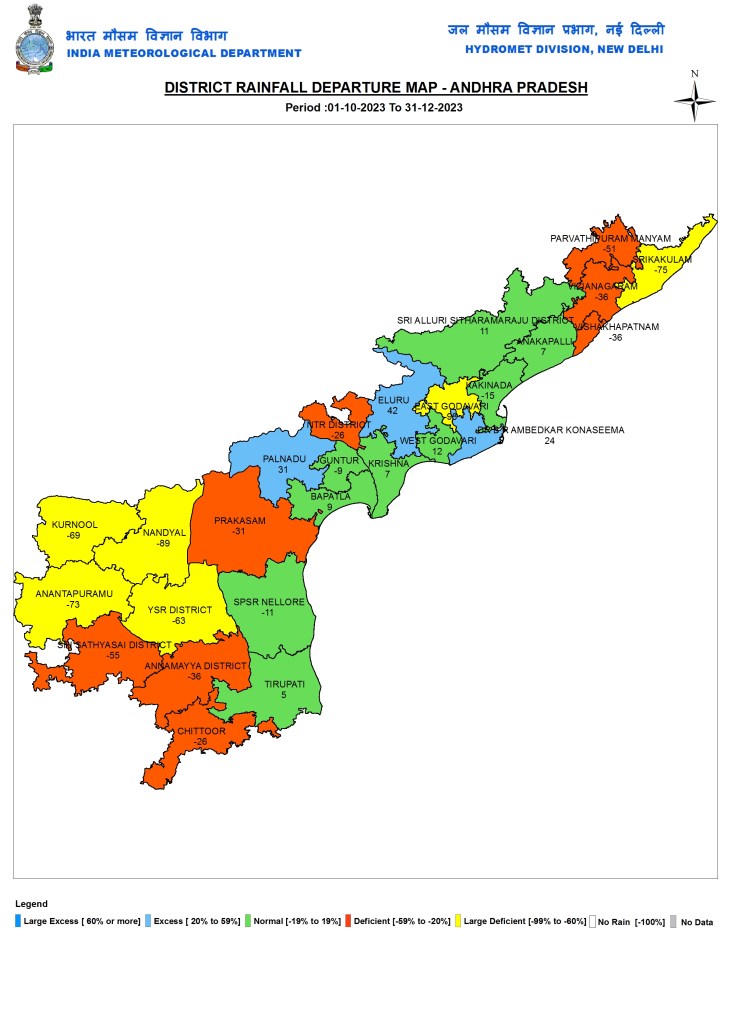
Andhra Pradesh
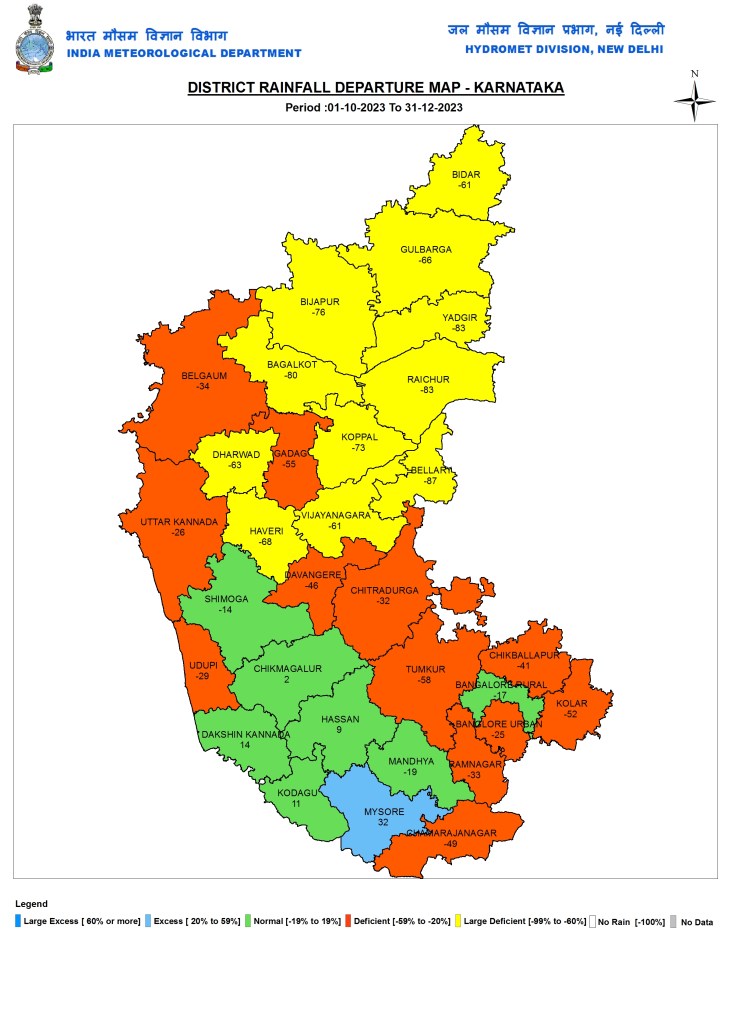
Karnataka
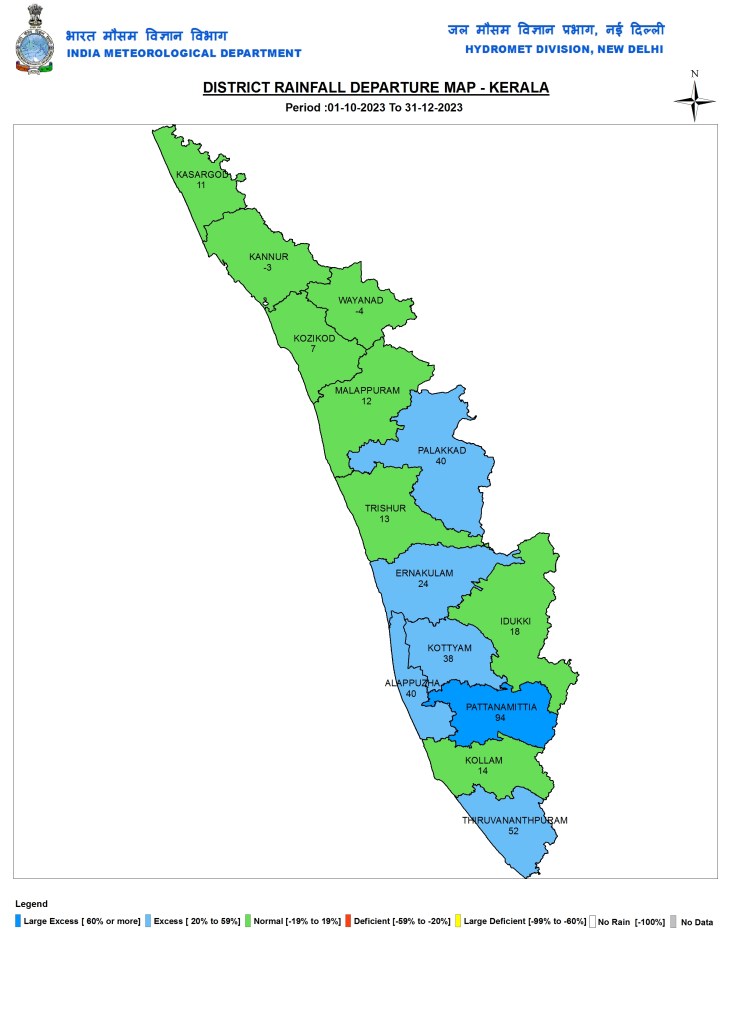
Kerala
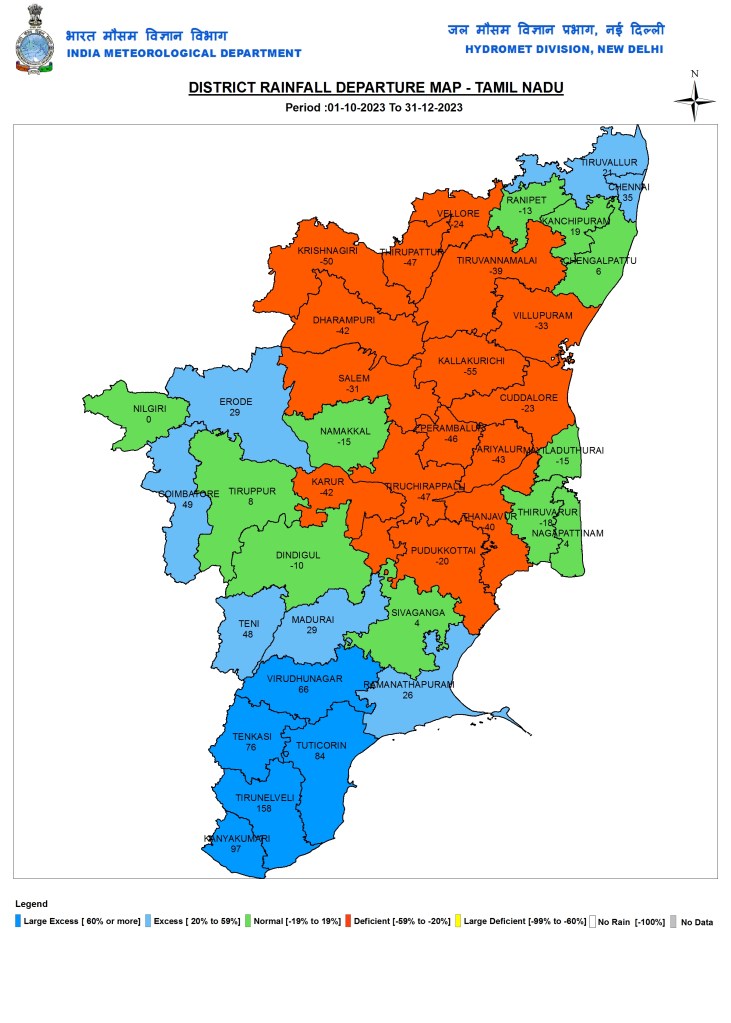
Tamil Nadu
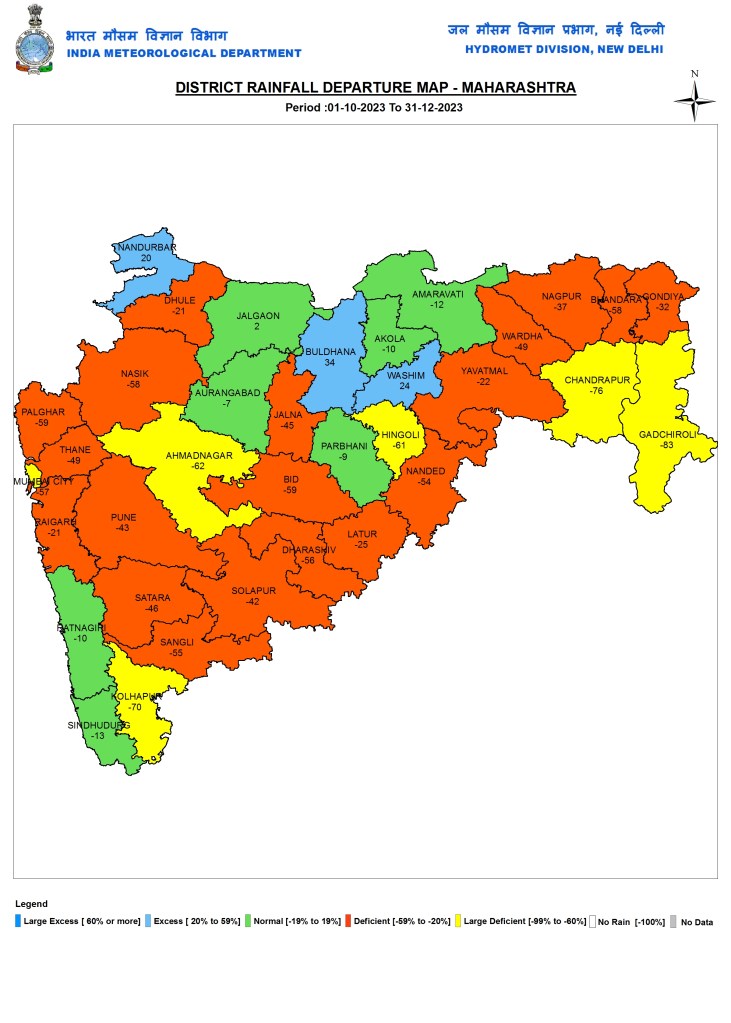
WEST ZONE: Maharashtra
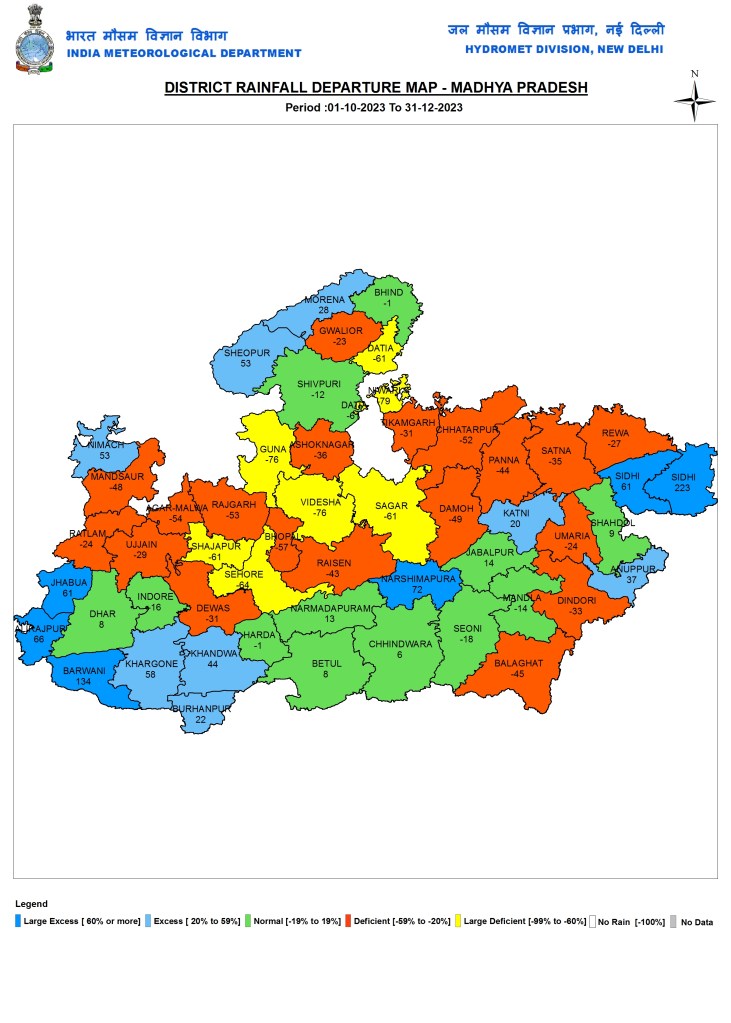
Madhya Pradesh
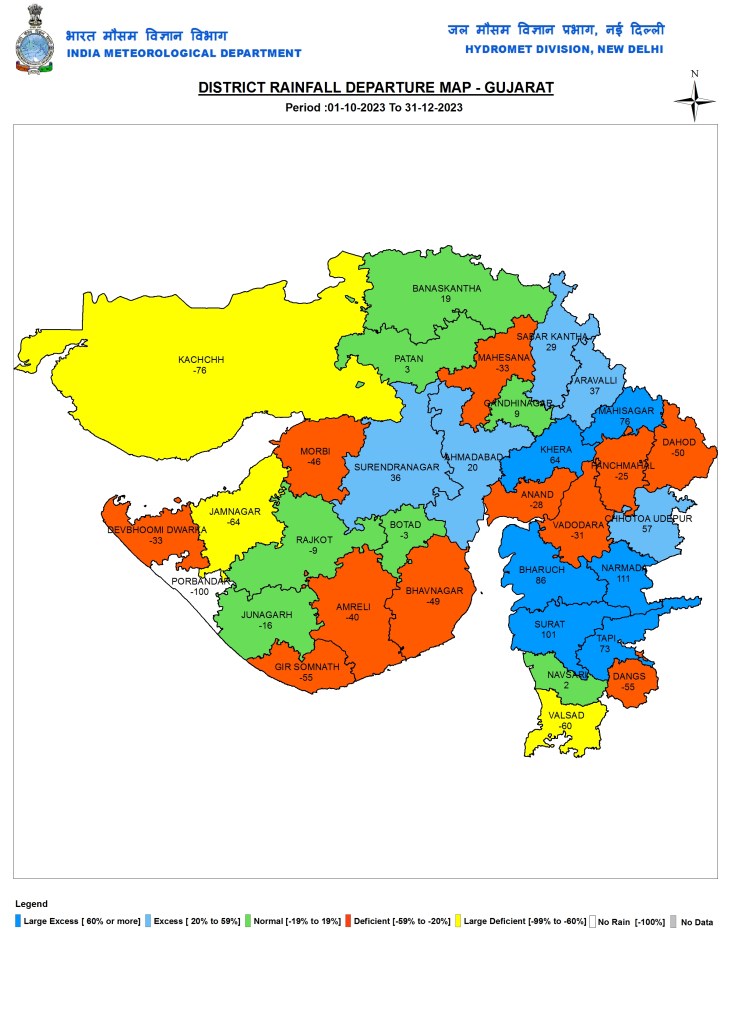
Gujarat
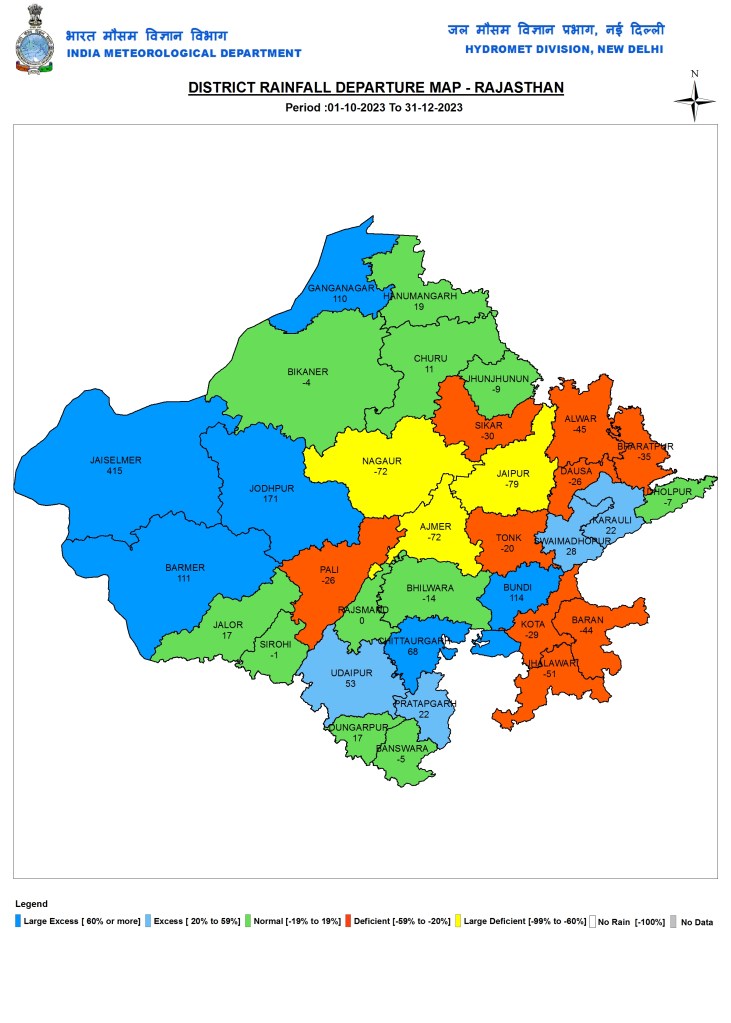
Rajasthan
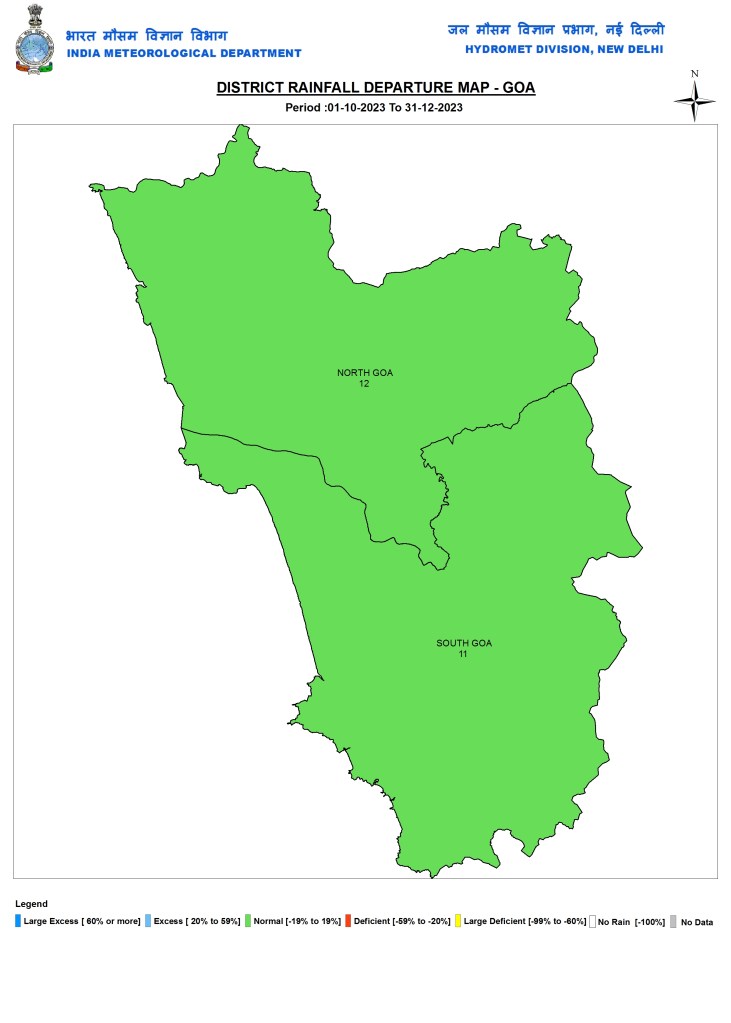
Goa
SANDRP (ht.sandrp@gmail.com)
END NOTES:
[i] https://sandrp.in/2023/01/01/post-monsoon-2022-district-wise-rainfall-in-india/
[ii] https://sandrp.in/2021/12/31/post-monsoon-2021-district-wise-rainfall-in-india/
[iii] India Meteorological Department (IMD) divides a water year (June 1 to May 31) into four seasons: Monsoon: (June 1 to Sept 30), Post monsoon (Oct 1 to Dec 31), Winter (Jan 1 to Feb 28/9) and Pre-Monsoon (March 1 to May 31). For rainfall during all these seasons, IMD’s hydro-meteorological website provides a lot of data on daily basis, including daily district wise, state-wise, sub division wise and river wise rainfall maps among many other weekly, monthly and seasonal products. However, one problem with it is that none of this information is achieved. So if you missed seeing or downloading available data on any date, there is no way to look at it even next day. This is even true of the seasonal rainfall maps, unfortunately.
[iv] https://sandrp.in/2021/01/01/state-wise-post-monsoon-2020-rainfall/
[v] https://sandrp.in/2020/06/05/india-received-20-excess-rains-in-pre-monsoon-2020/

Hi, this is super useful, Would you have this data in an excel for rain between Oct-Dec at a district level by any chance?
LikeLike
No, unfortunately not.
LikeLike
I may have it in PDF along with other data.
LikeLike