
According to India Meteorological Department (IMD), during the just concluded Post Monsoon Rainfall for 2020, that included rainfall during Oct-Dec months, India received 124.6 mm rainfall, 0.64% above the normal rainfall of 123.8 mm during the period. As per IMD[i] definition, the rainfall was thus normal.
This three-month period from Oct 1, to Dec 31 includes the North East Monsoon that mainly affects parts of South India including Tamil Nadu, Puducherry, Rayalseema, parts of Karnataka and Kerala. IMD declared on Jan 1, 2021 that the of NE Monsoon ended on Dec 31, 2020 with normal overall rainfall: TN had 6% above normal, Karnatak 13% above normal, Puducherry 32% above normal, Andhra Pradesh 33% above normal. However, Lakshadweep had 9% below normal and Kerala 26% below normal. This monsoon provides 48% of the annual rainfall of TN so it is most imp for that state.
The rainfall revived only towards the end of November, mainly due to two consecutive cyclones — Nivar and Burevi — both of which developed in the Bay of Bengal. While Cyclone Nivar crossed the coast close to Karaikal near Puducherry and brought heavy showers for the east and coastal districts of Tamil Nadu, Cyclone Burevi weakened before it reached land.
The period also includes some part of the South West Monsoon that is supposed to end on Sept 30, but the withdrawal many times extends well into October, as it happened in 2020. In fact as per IMD Press Release of Oct 28, 2020[ii], SW Monsoon withdrew from India only on Oct 28, 2020 and NE Monsoon set in on the same date.
The period also includes the rainfall that most of North India gets from western disturbances, but that contribution has been below normal this year. In fact, this being a La Nina year, the rainfall was supposed to be significantly above normal, but that is clearly not the case.
In fact, in Post Monsoon season of 2019, India received 160 mm rainfall[iii] in this season, 29% above normal, when 2019 was not a La Nina year. Even with La Nina, post monsoon 2020 rainfall is just about normal and over 28% less than the post monsoon 2019 rainfall.
Monthly rainfall The distribution of rainfall for the three months of Post Monsoon 2020 season as per IMD figures is as follows. While the monthly normal and actual rainfall decreases as we go from October to December, the % surplus also decreases and turns into slight deficit by December 2020. There is no evident impact of La Nina here.
| Months | Actual rainfall, mm | Normal rainfall, mm | % departure |
| Oct 2020 | 78.1 | 76 | 2.8 |
| Nov 2020 | 29.3 | 28.8 | 1.7 |
| Dec 2020 | 17.2 | 17.4 | (-) 1.2 |
| Post Monsoon 2020 | 124.6 | 123.8 | 0.64 |
Major unknown One major unknown, here is that it is not clear if IMD’s these reported figures include the contribution from snowfall and if so what is the contribution of snowfall. It is not even known looking at the IMD website if IMD even monitors the snowfall figures and if so what are they. This is worrying since snowfall is expected to make a significant contribution during winter months and we seem to be in total dark as to what is the quantum of snowfall in different districts, states, in different months.
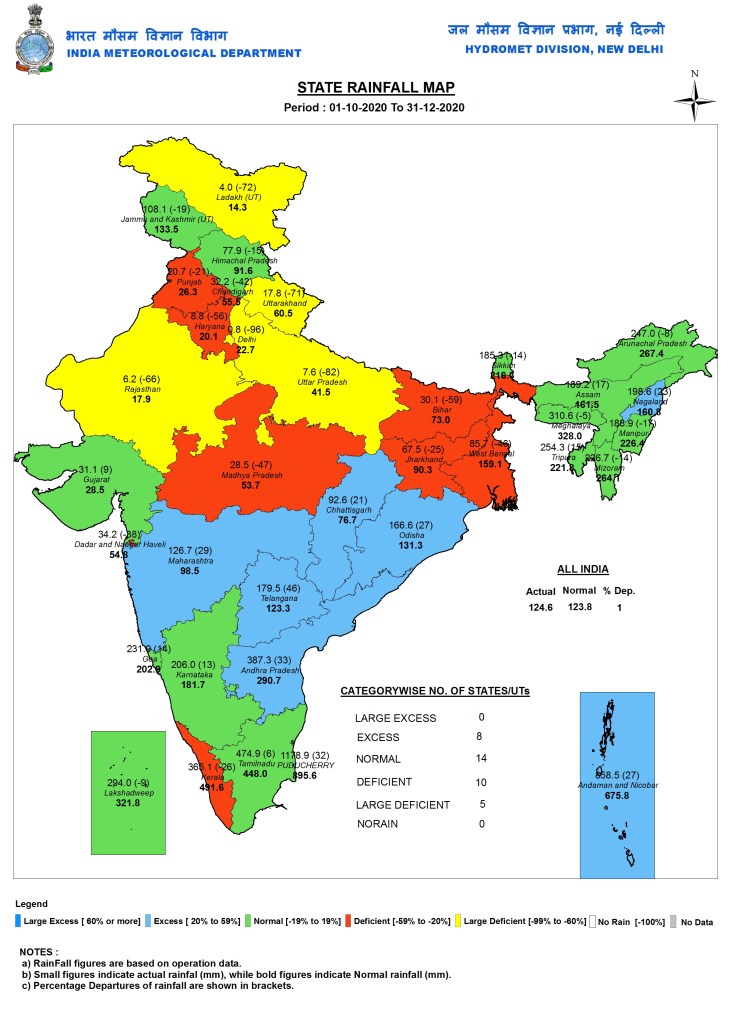
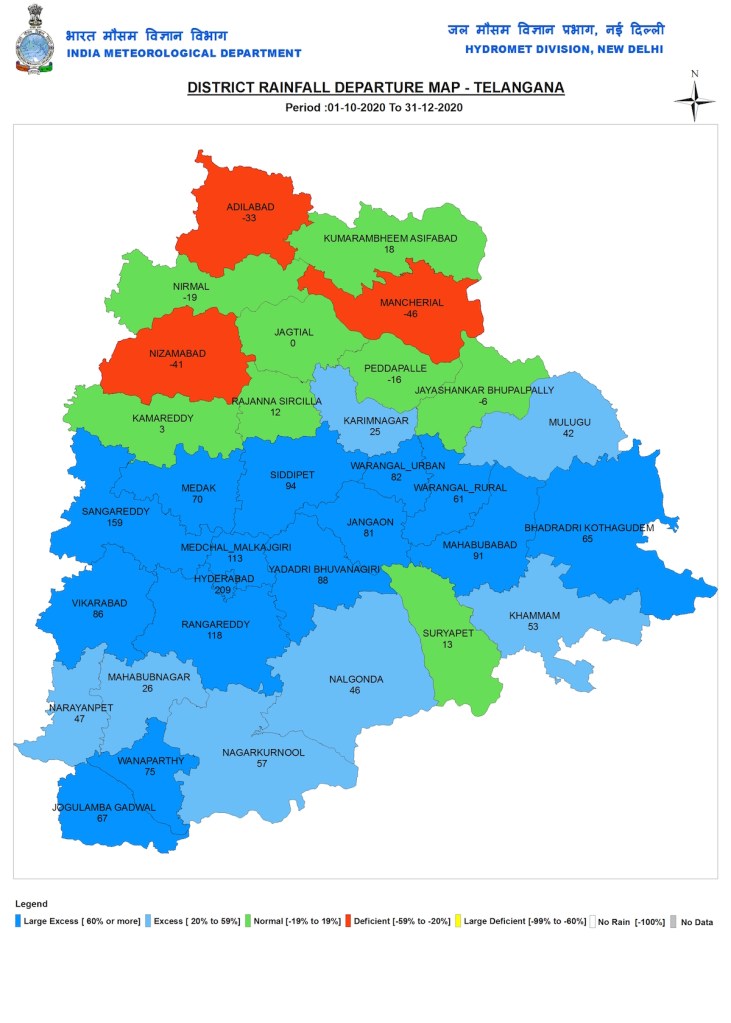
ALL INDIA: State wise rainfall No states got Large Excess (over 60% above LPA rains), 8 states received Excess (20-59% above LPA), 14 states got Normal (+/- 19% of LPA), 10 states got deficit rains (20-59% below LPA) and 5 states got Large Deficit (over 60% below LPA). Here LPA is Long period average, taken as average of the rainfall during 1961-2010. Puducherry received the highest rainfall at 1178.9 mm. Delhi had the lowest rainfall at 0.8 mm and also the highest deficit (96%). Telangana had the highest surplus at 46%.
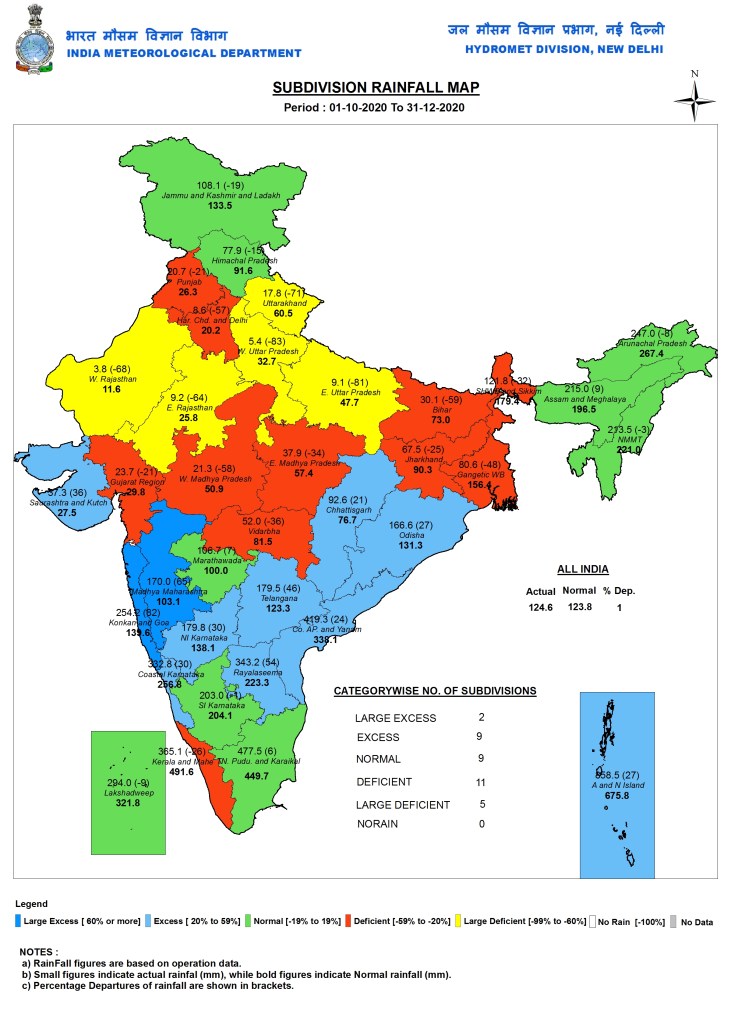
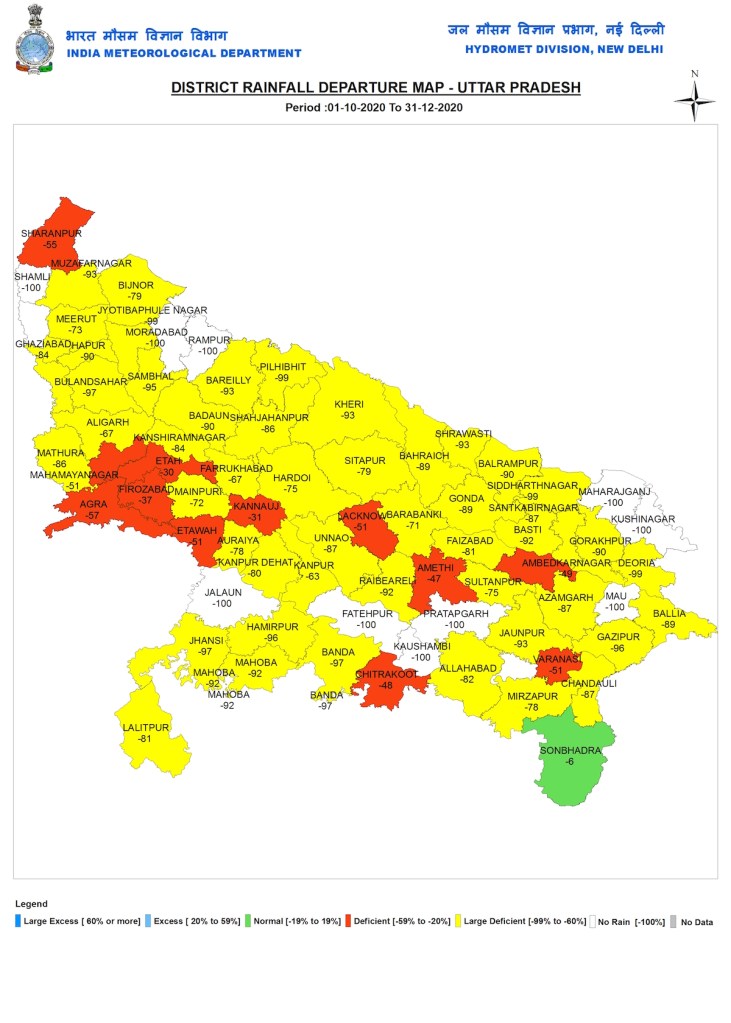
Sub-Division wise rainfall Among IMD’s 36 sub divisions, 2 received Large Excess, 9 received Excess, 9 received Normal, 11 received Deficit, and 5 received Large Deficit rainfall. Andaman and Nicobar Islands received the highest divisional rainfall at 858.5 mm. Konkan and Goa had the highest excess at 82%. W Rajasthan received the lowest rainfall at just 3.8 mm. W Uttar Pradesh had the highest deficit at 83%. North East India has the highest rainfall, followed by East India.
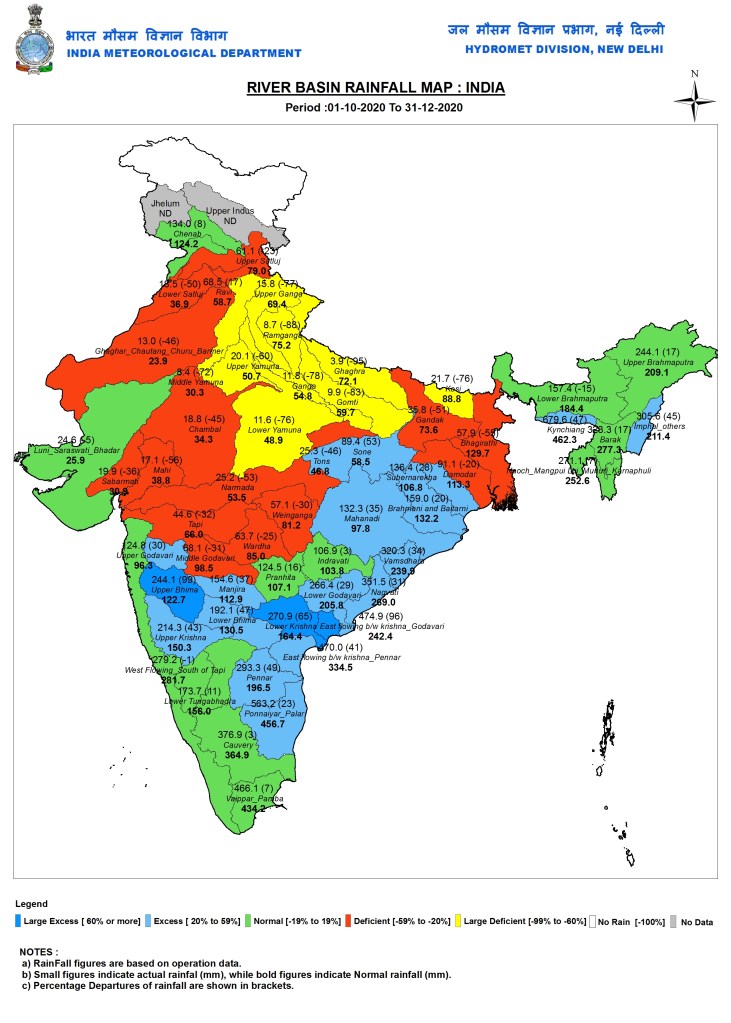
River basin wise rainfall The media generally ignores this, but IMD also reports river basin wise rainfall, which is actually the most important way to report rainfall. But IMD unfortunately does a rather callous job of it. During Post Monsoon 2020, as we can see from IMD map, there were three river basins with Large Excess rainfall: Upper Bhima, East flowing rivers between Krishna and Godavari and Lower Krishna, Upper Bhima had the highest surplus at 99%. For two river basins (Jhelum and Upper Indus) IMD had no rainfall data (like in case in 2019)! Kynchiang basin in Meghalaya had the highest rainfall (like in case in 2019) at 679.6 mm, 47% above normal. Ghagra basin in UP had the highest deficit at 95%, with just 3.9 mm rainfall, which was also the lowest rainfall of all the river basins.
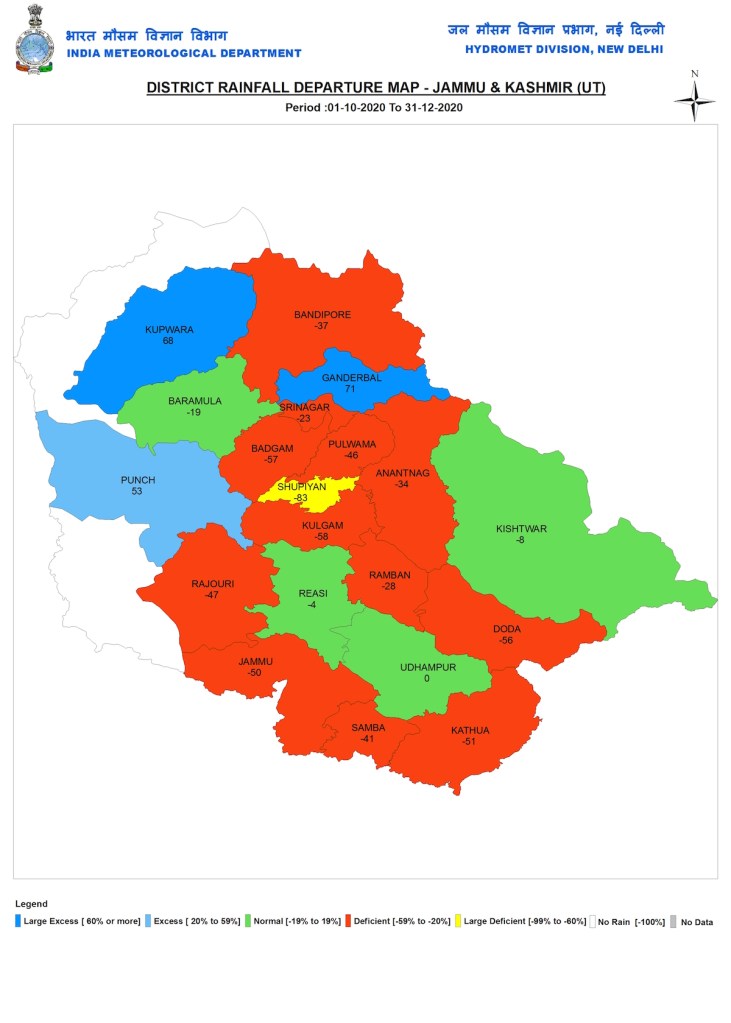
STATE WISE DISTRICT WISE RAINFALL: North Zone: Jammu and Kashmir
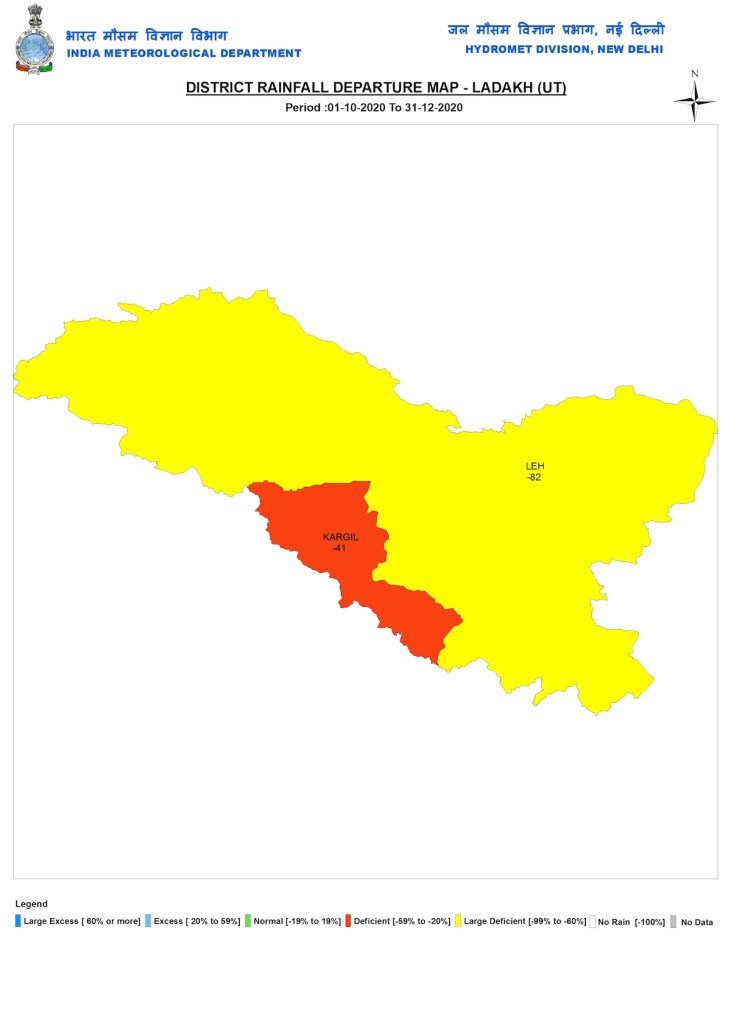
Ladakh
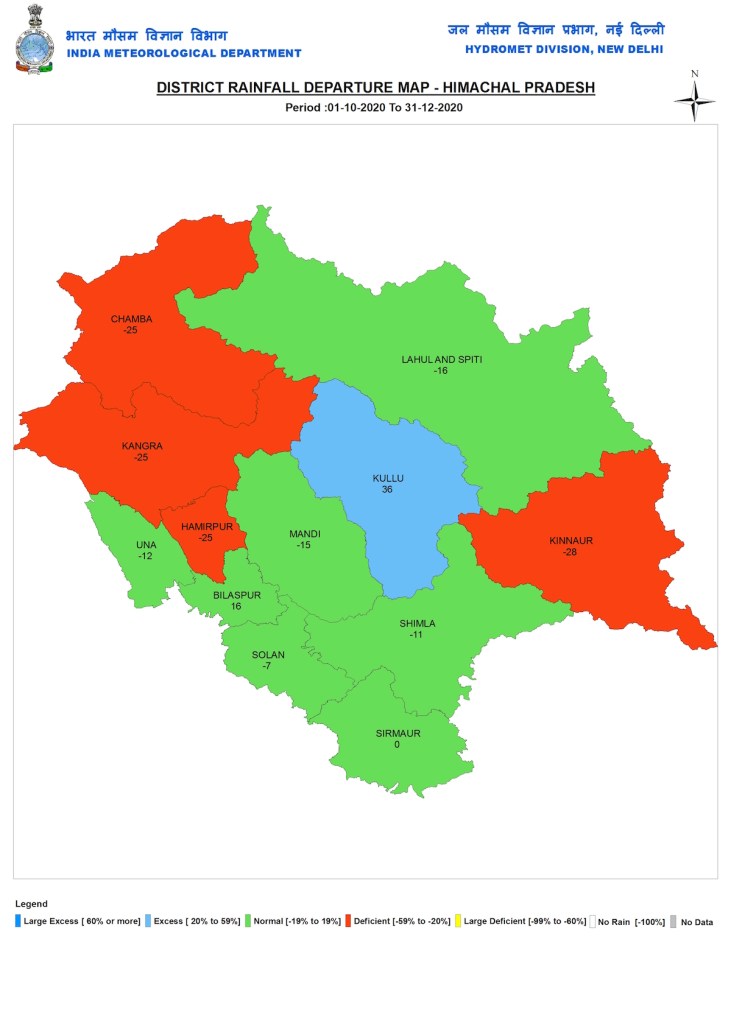
Himachal Pradesh
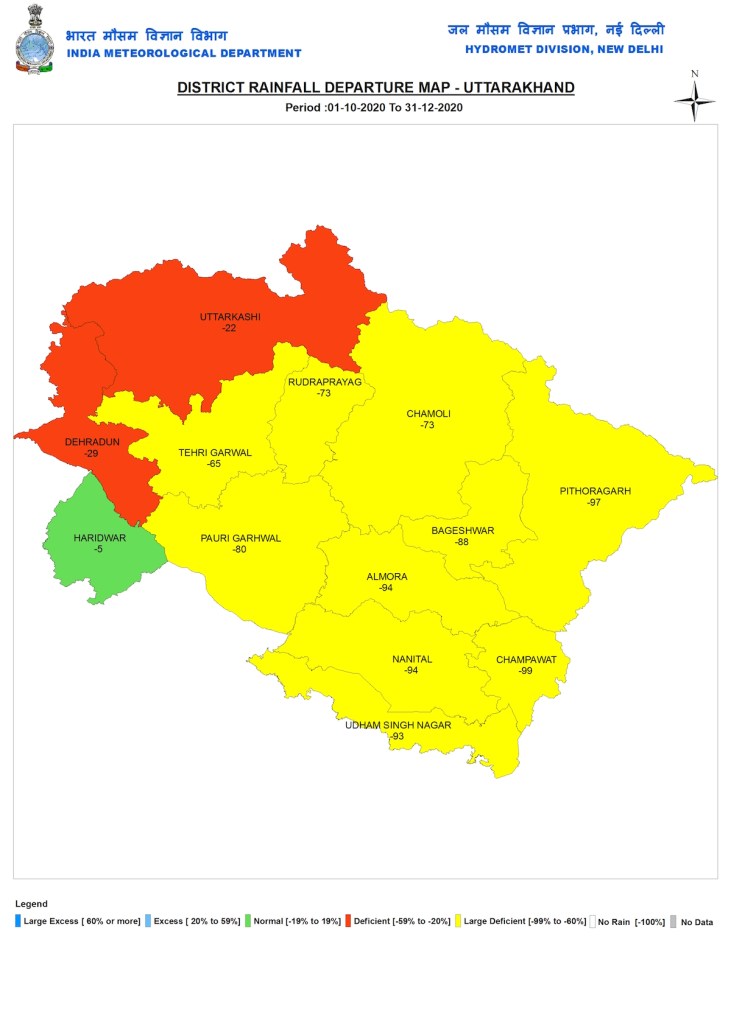
Uttarakhand
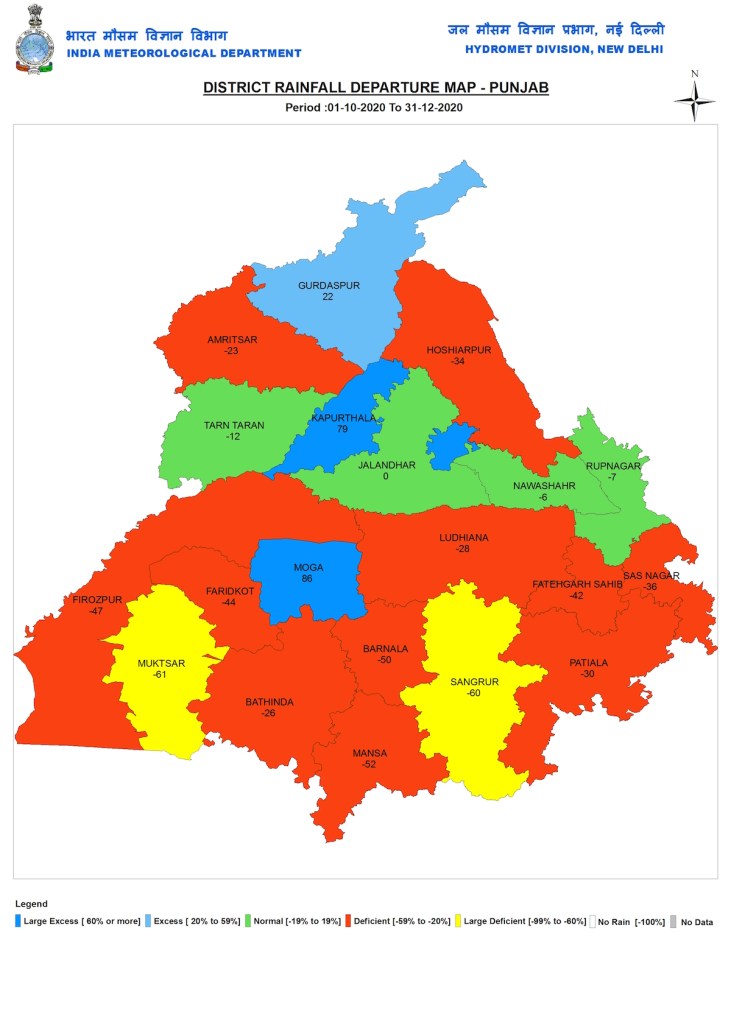
Punjab
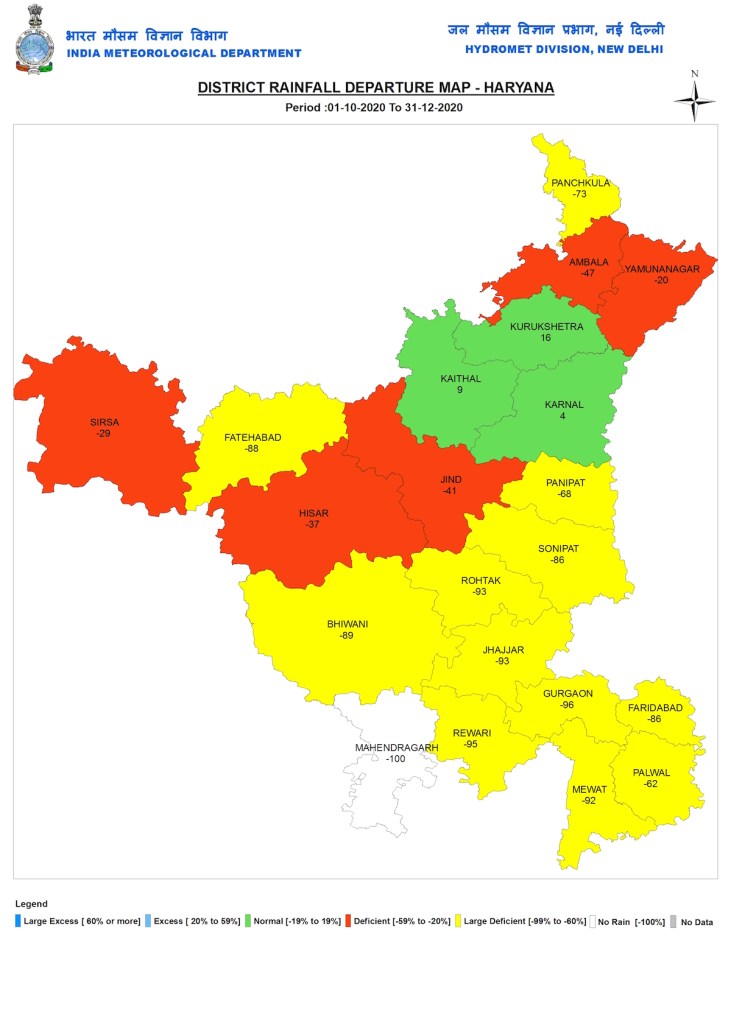
Haryana
Chandigarh During Post Monsoon 2020, 32.2 mm rainfall, 42% below normal rainfall of 55.5 mm.
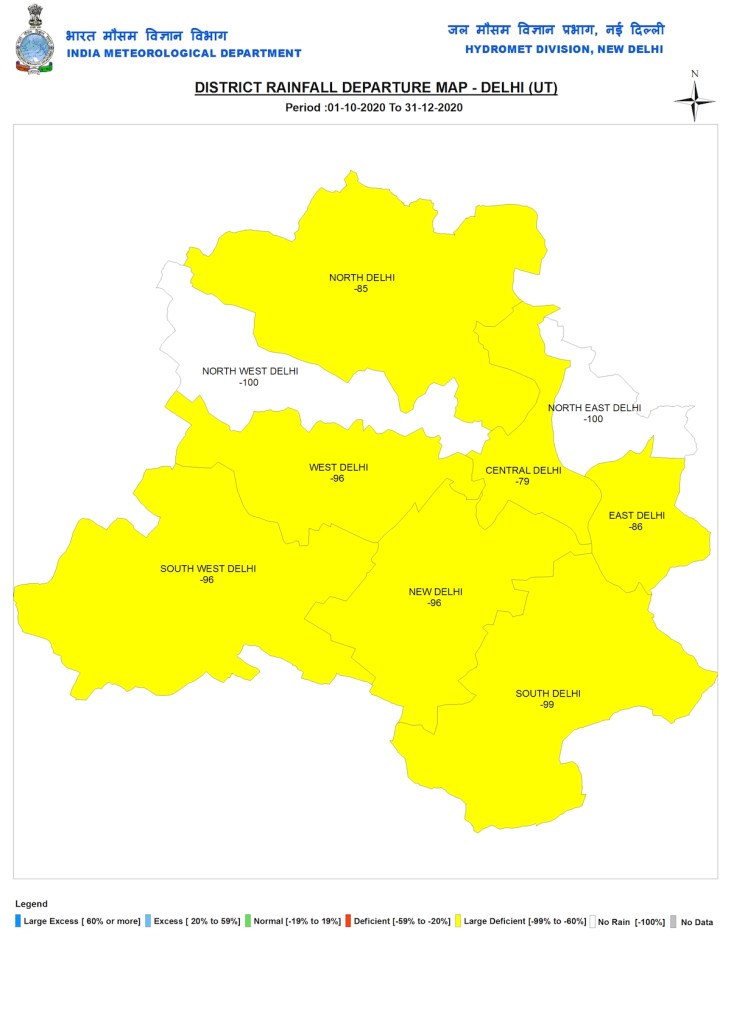
Delhi
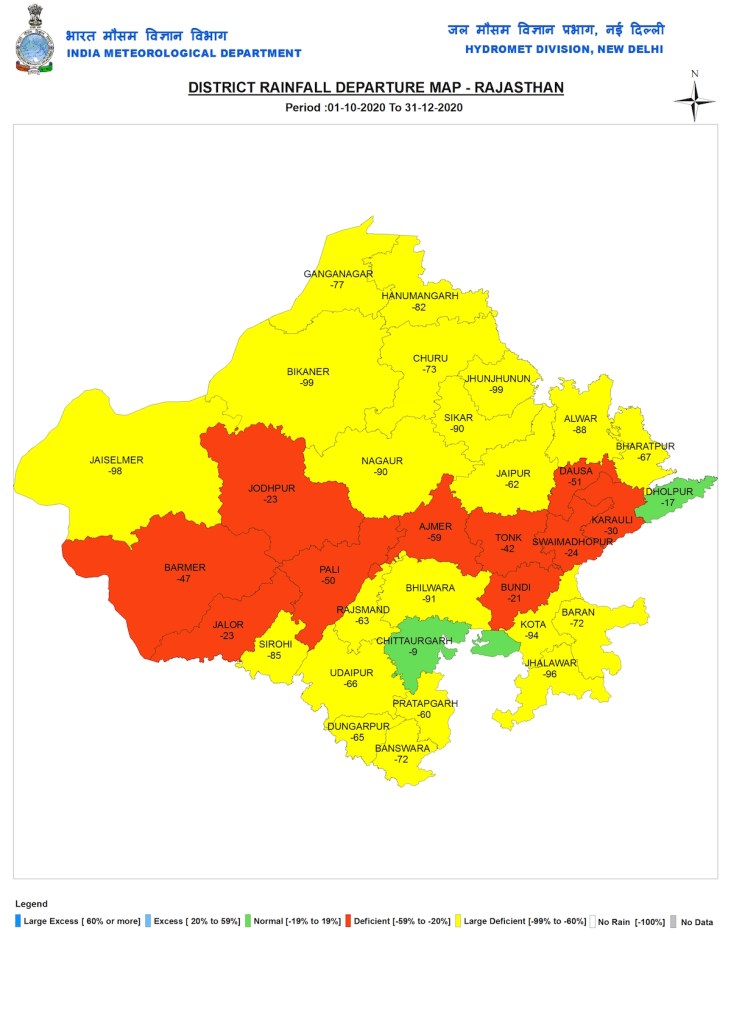
WEST INDIA: Rajasthan
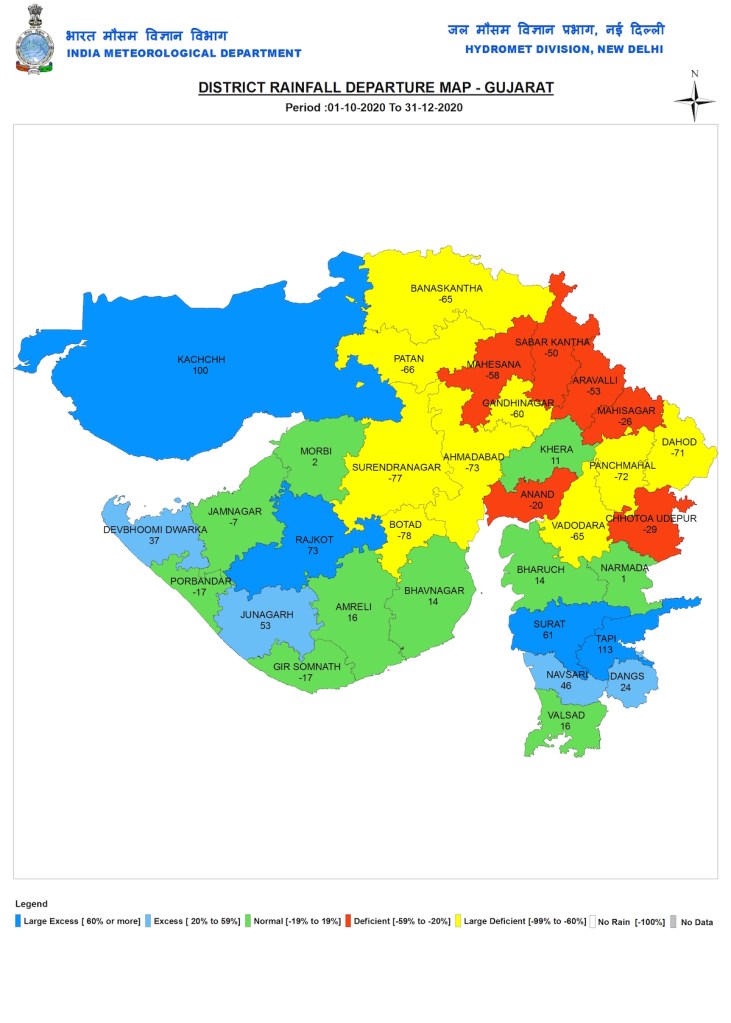
Gujarat
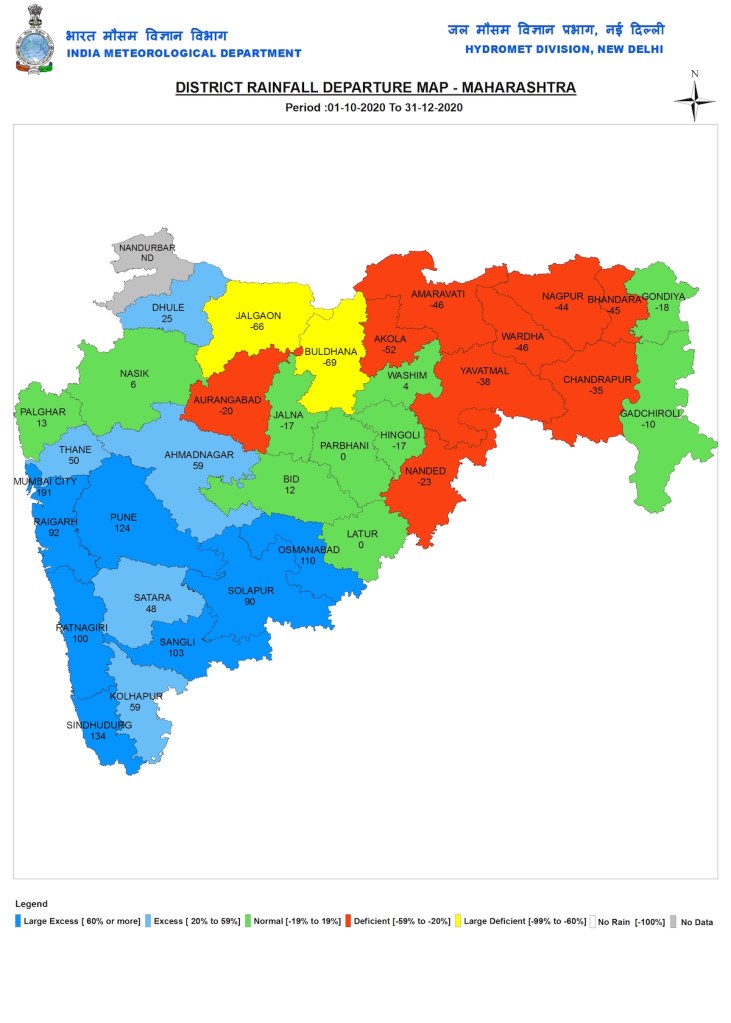
Maharashtra
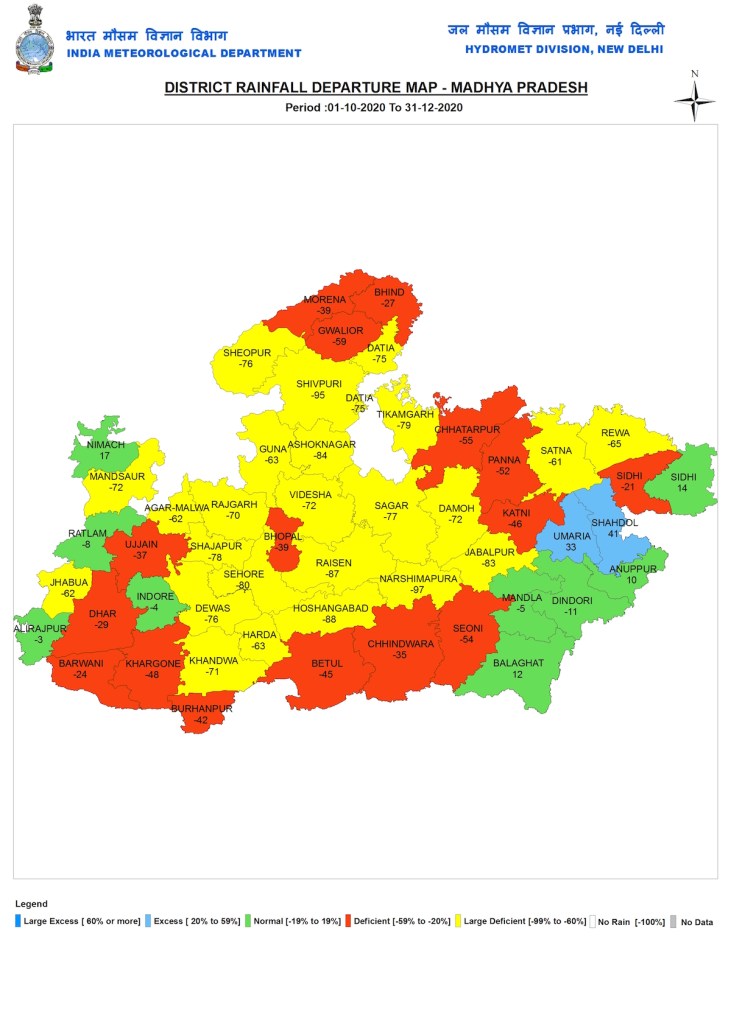
Madhya Pradesh
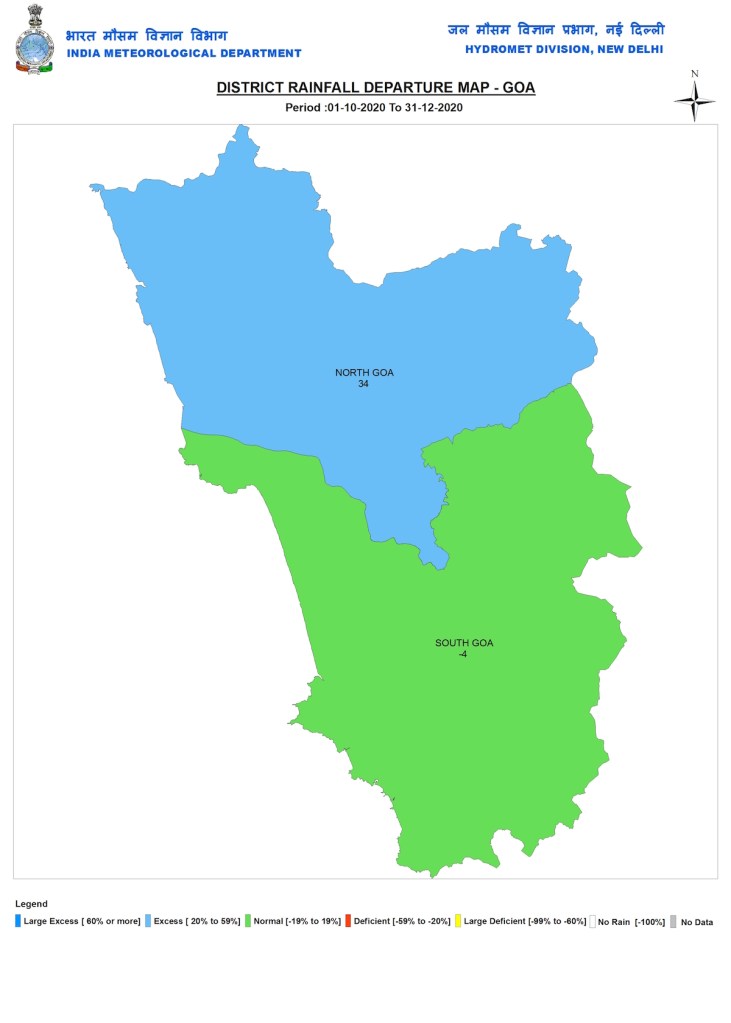
Goa
Dadar & Naharhaveli Rainfall was 34.2 mm, 38% below normal rainfall of 54.8 mm.
Diu Daman Rainfall was 35.5 mm, 29% below normal rainfall of 50 mm.
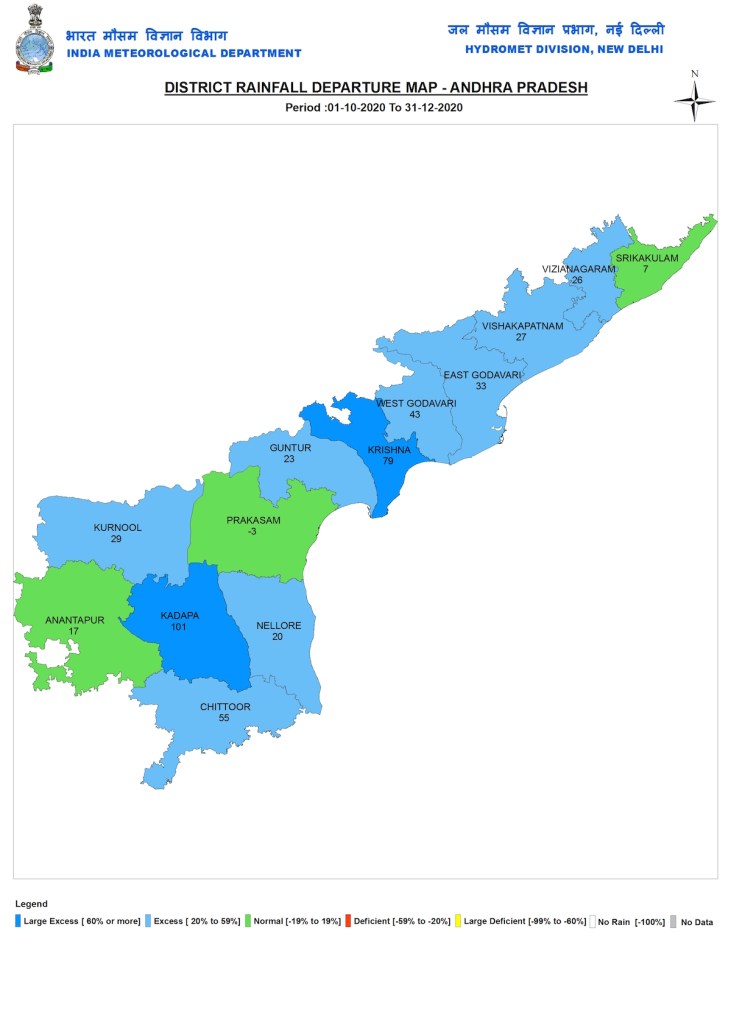
SOUTH INDIA & ISLANDS: Andhra Pradesh
Telangana
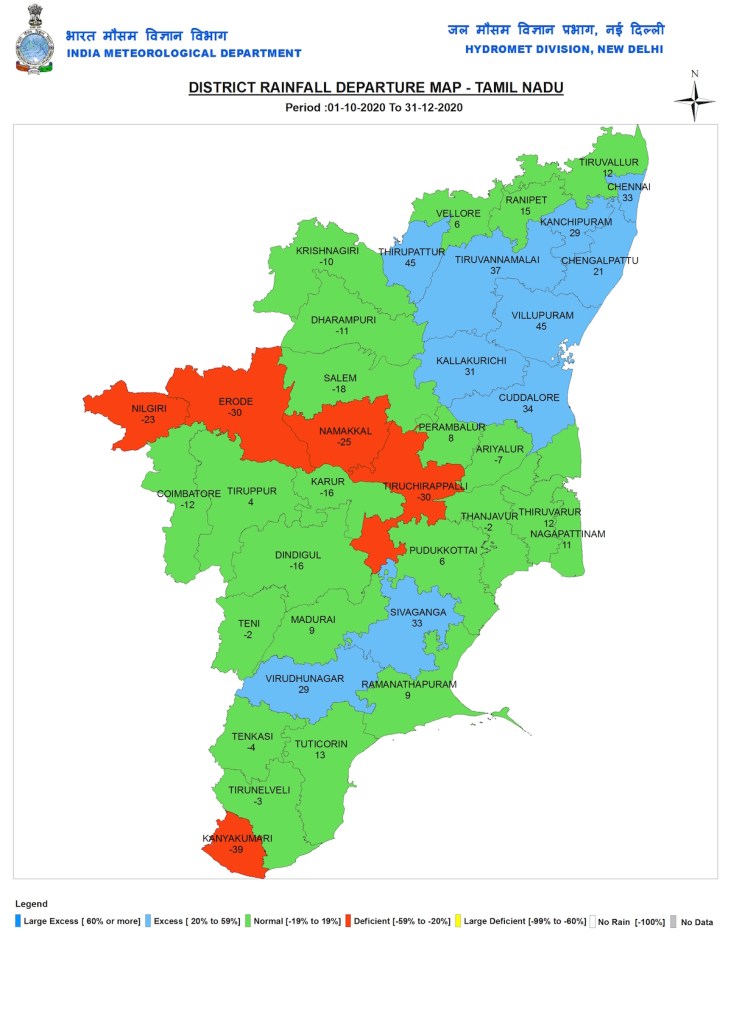
Tamil Nadu: Five districts had deficit rainfall.
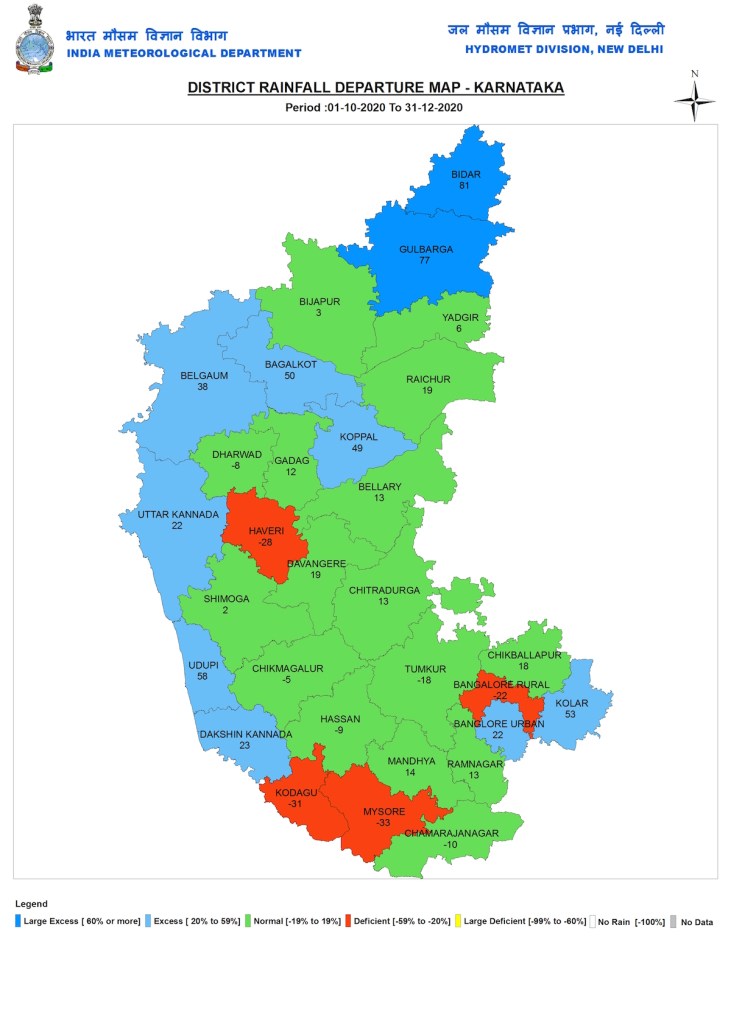
Karnataka
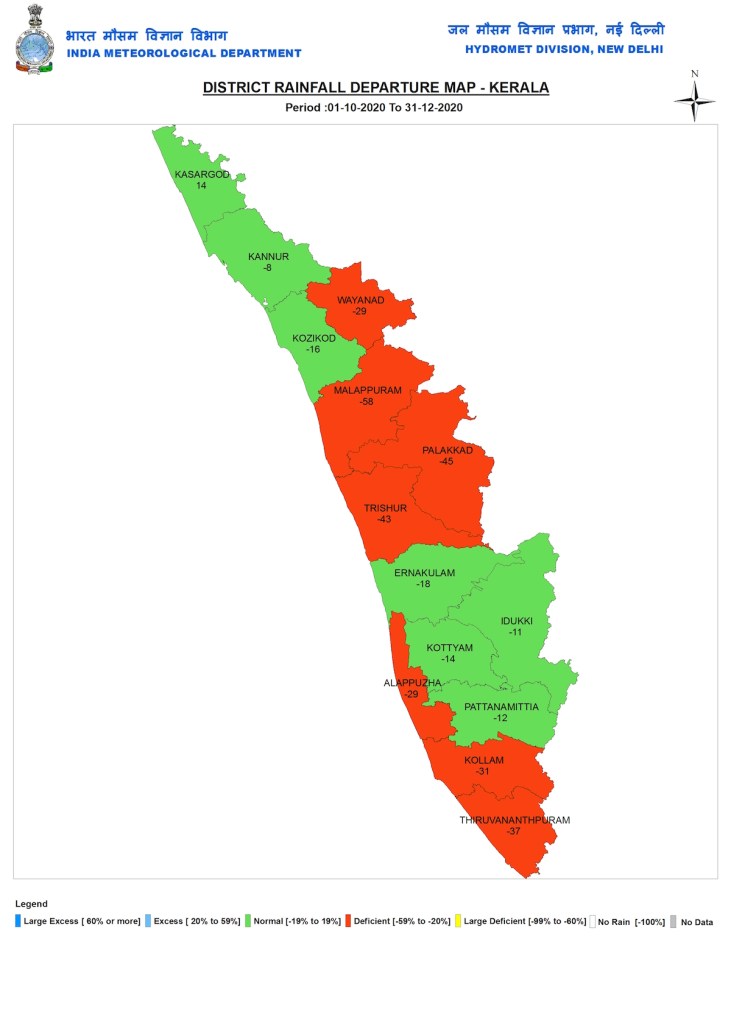
Kerala In Kerala, eight of the 14 districts were rainfall deficient during the season — Malappuram (-58 per cent), Palakkad (-45 per cent), Thrissur (-43 per cent), Thiruvananthapuram (-37 per cent), Kollam (-31 per cent), Alappuzha (-29 per cent) and Pathanamthitta (-12 per cent).
Pondicherry The rainfall was 1178.9 mm, 32% above normal rainfall of 895.6 mm. The rainfall here was the highest among all states and Union Territories.
Andaman and Nicobar The rainfall was 858.5 mm, 27% above normal rainfall of 675.8 mm.
Lakshadweep The rainfall was 294 mm, 9% below normal rainfall of 321.8 mm.
EAST ZONE: Uttar Pradesh
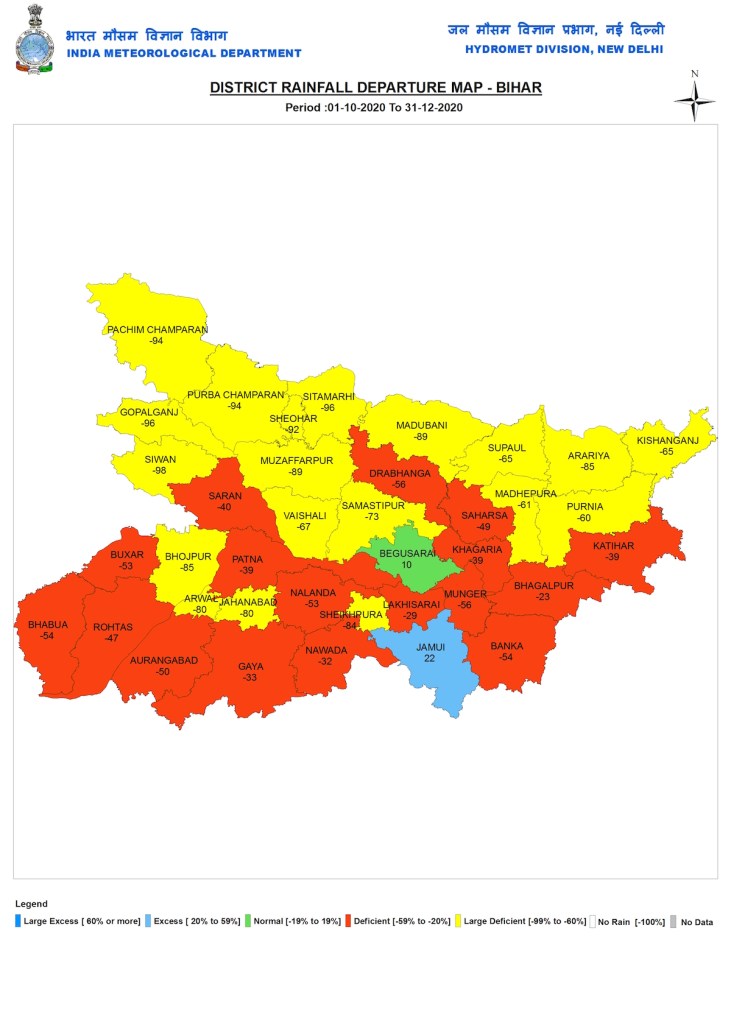
Bihar
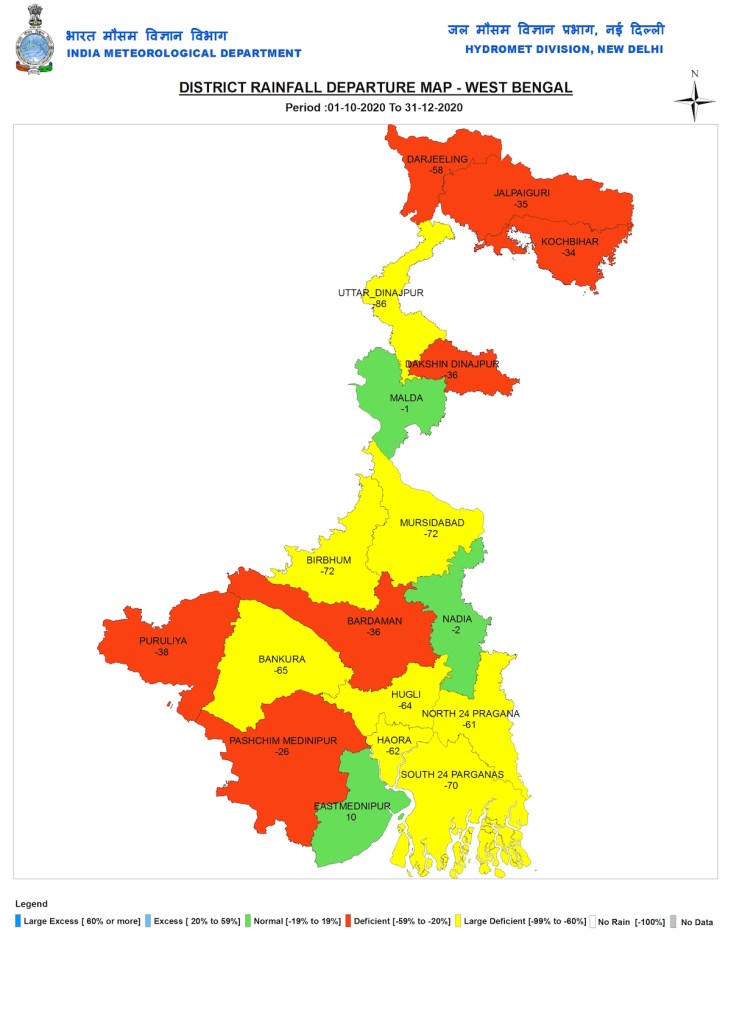
W Bengal
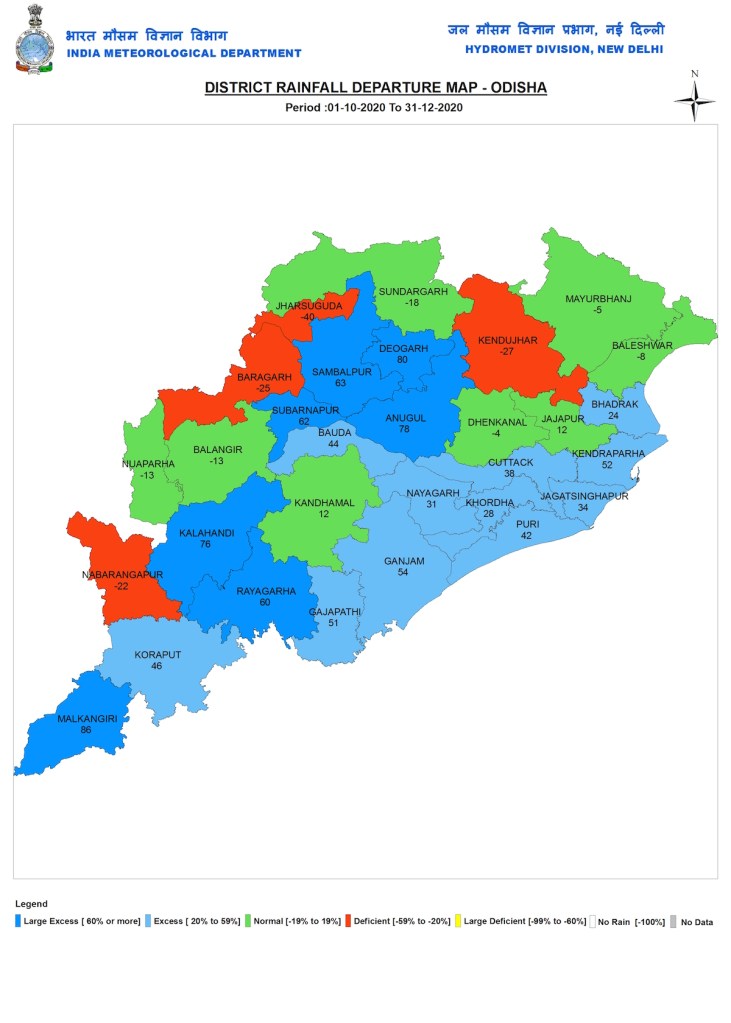
Odisha
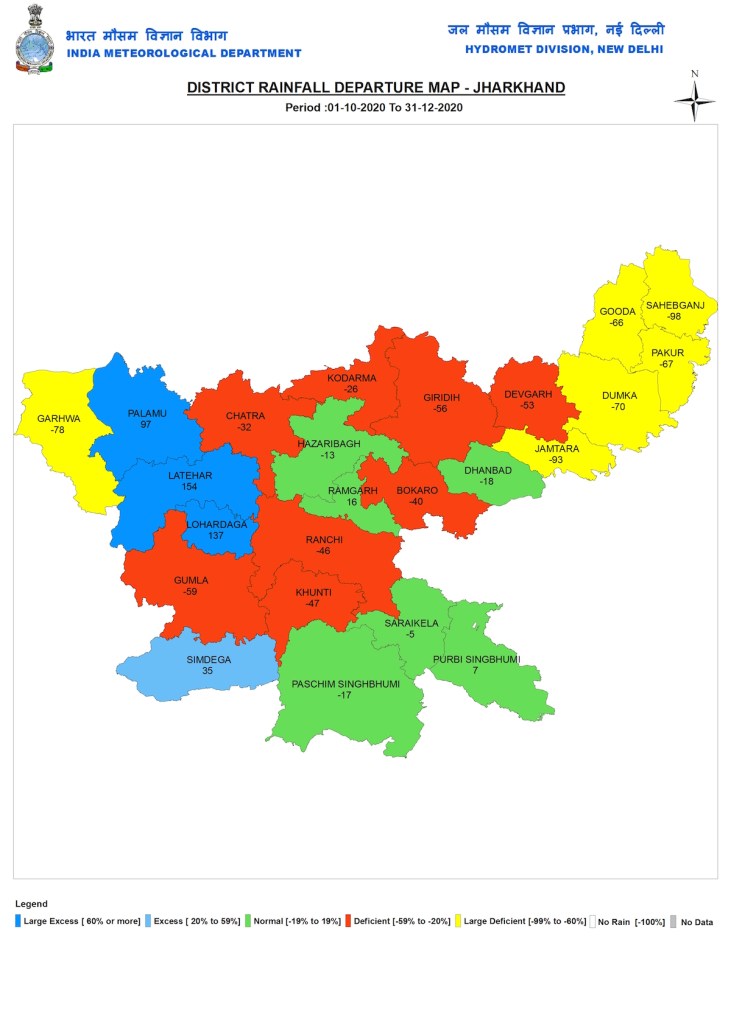
Jharkhand
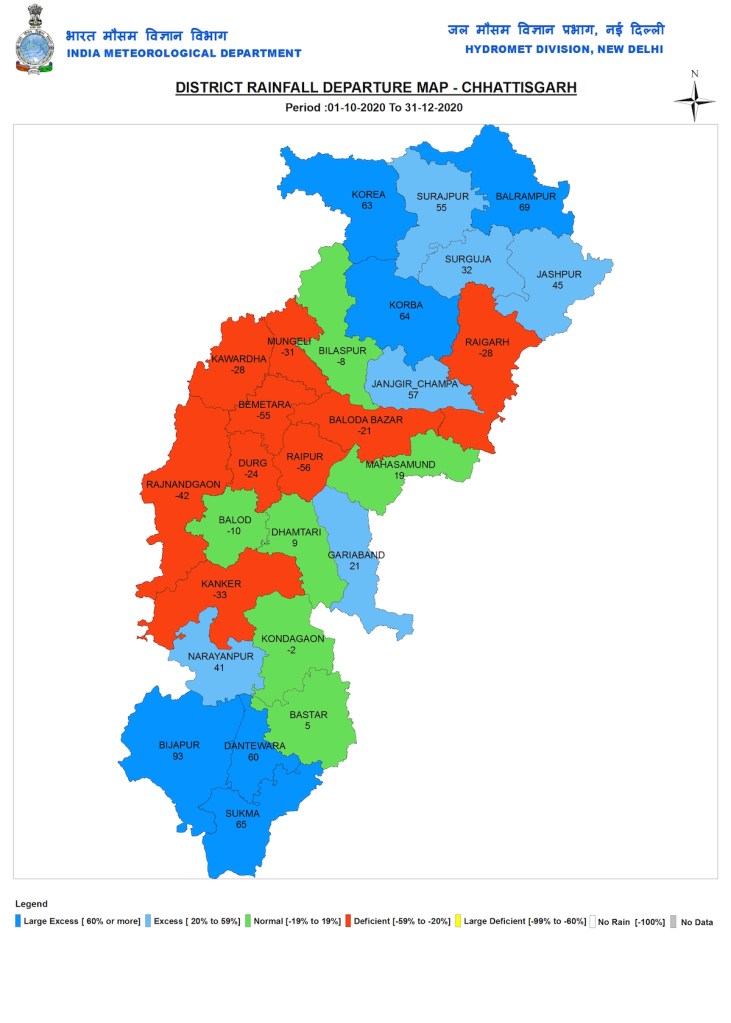
Chhattisgarh
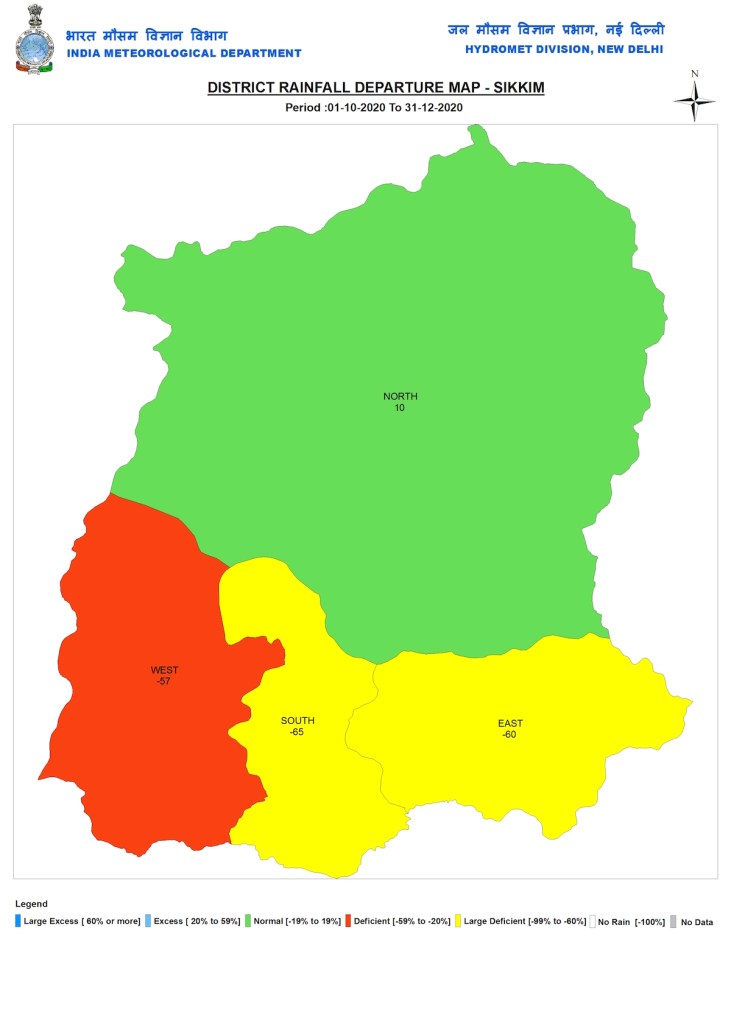
NORTH EAST INDIA: Sikkim
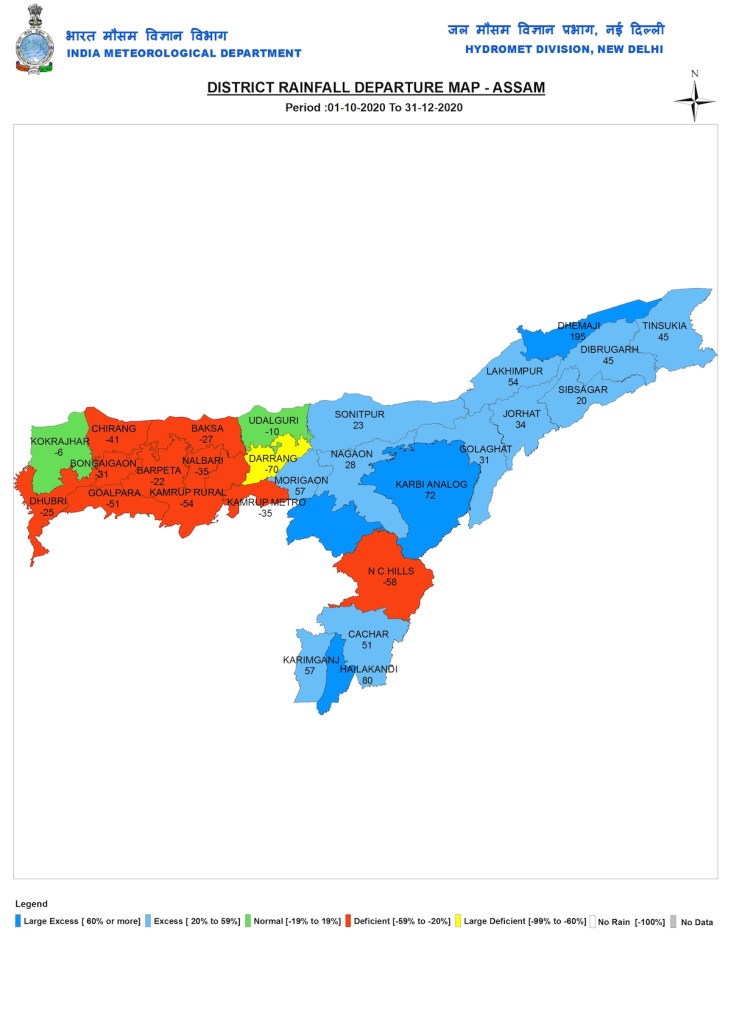
Assam
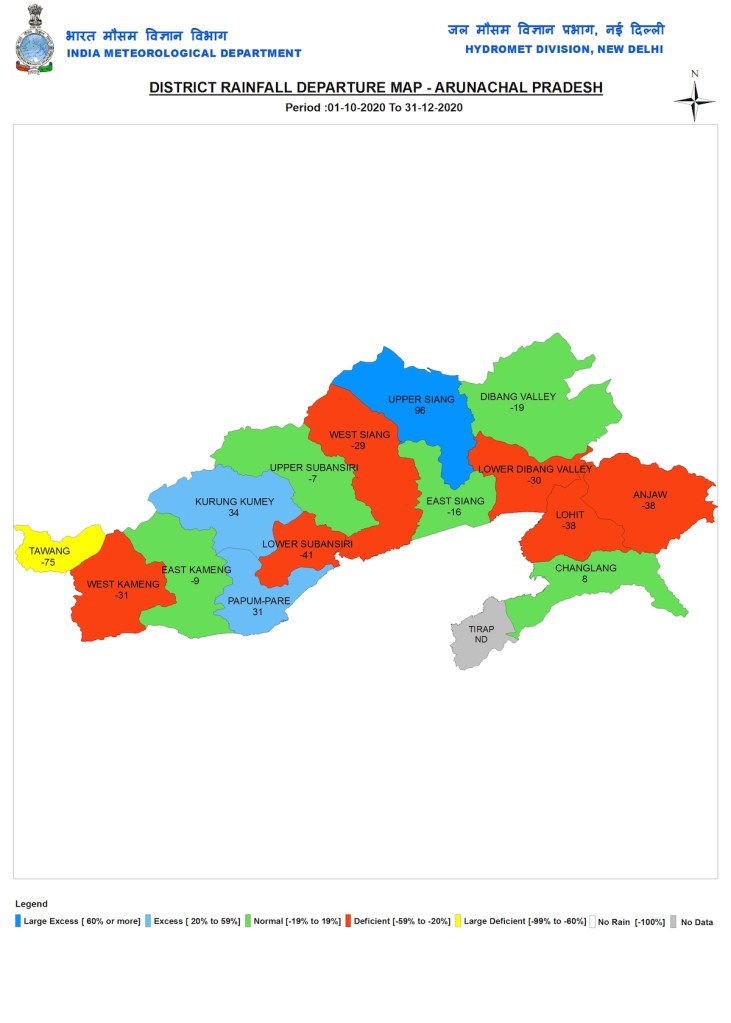
Arunachal Pradesh
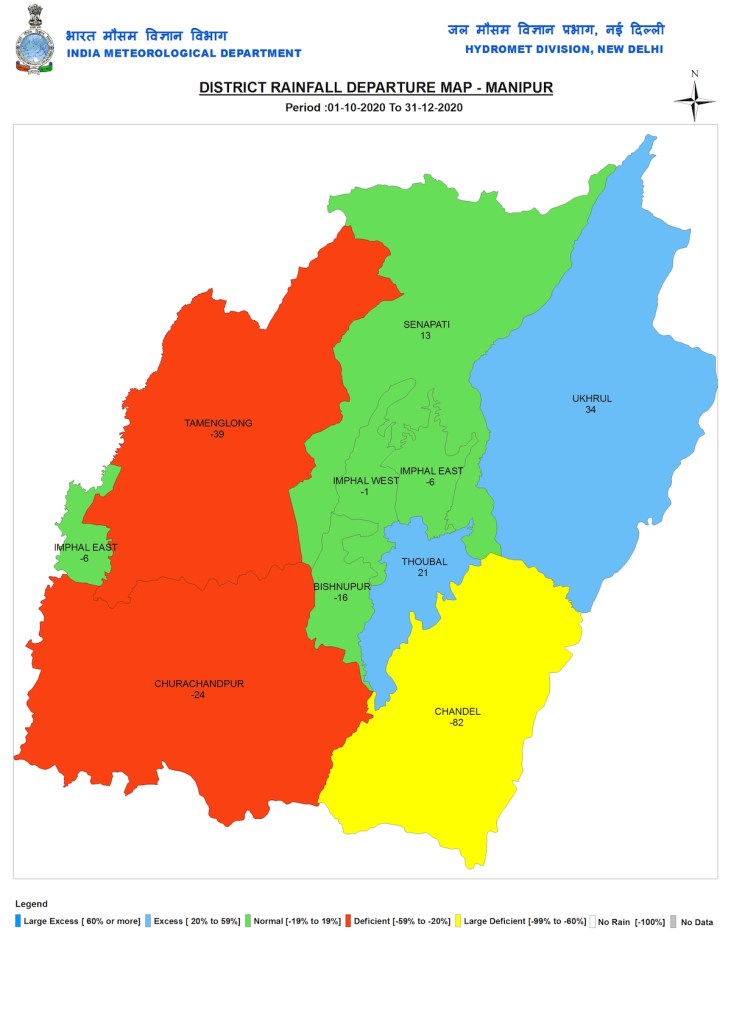
Manipur
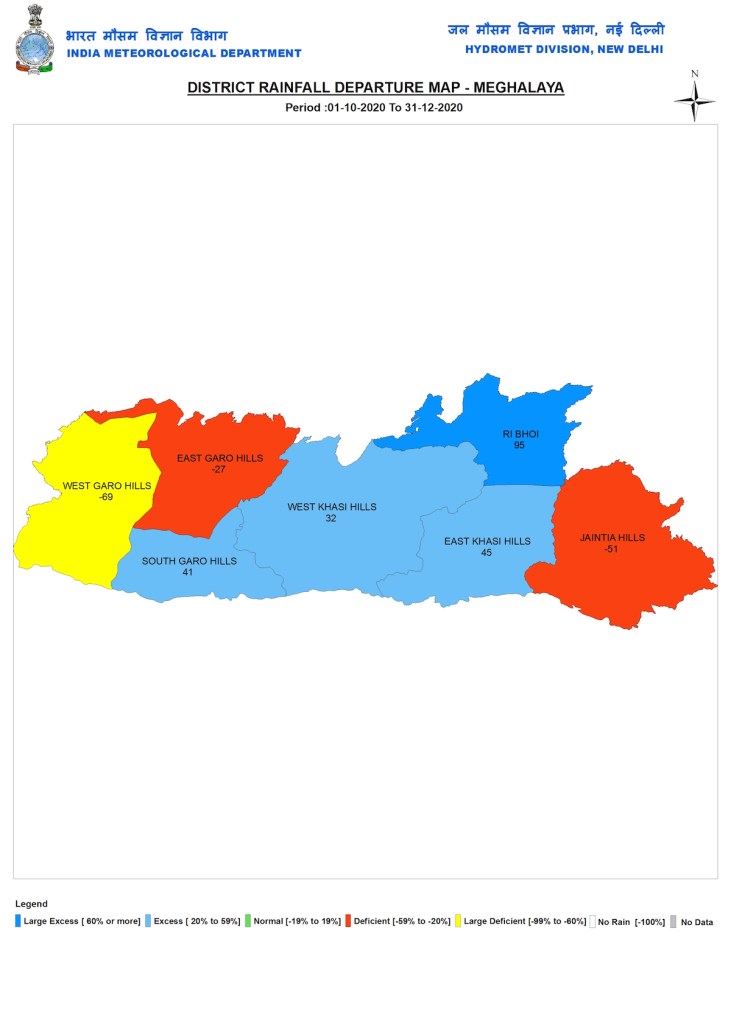
Meghalaya
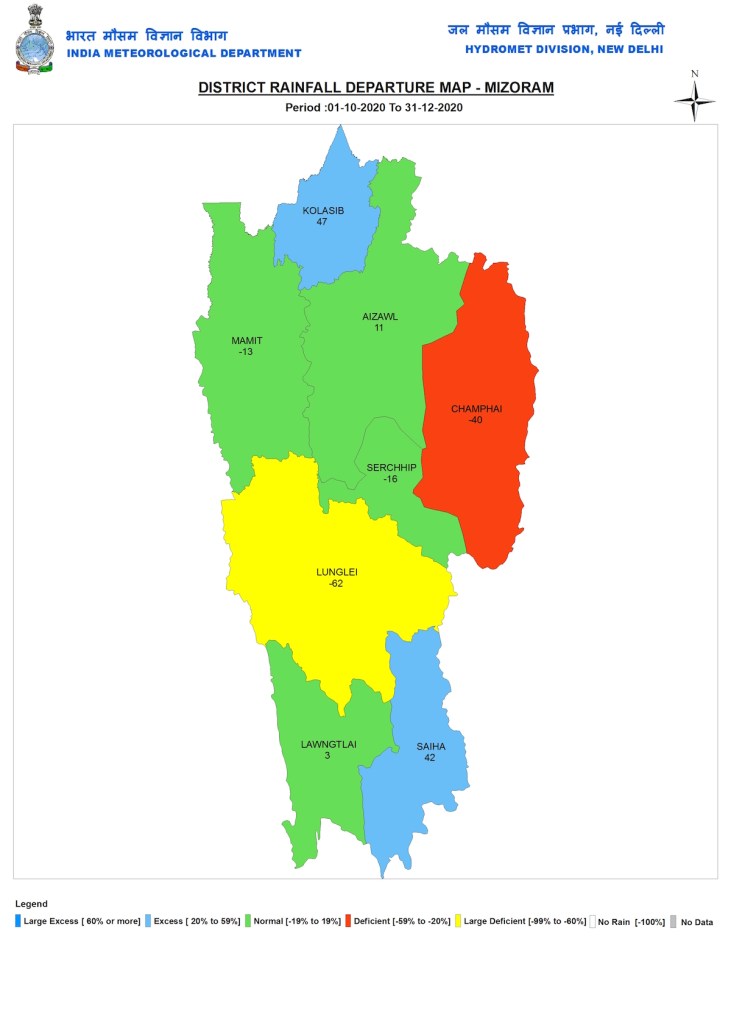
Mizoram
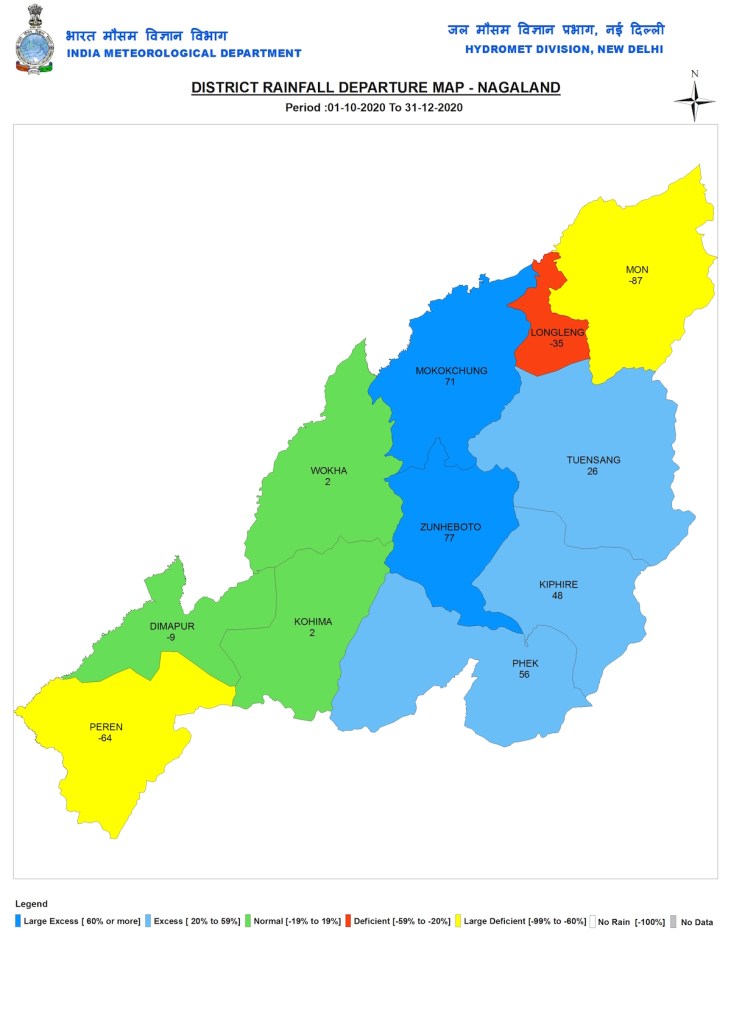
Nagaland
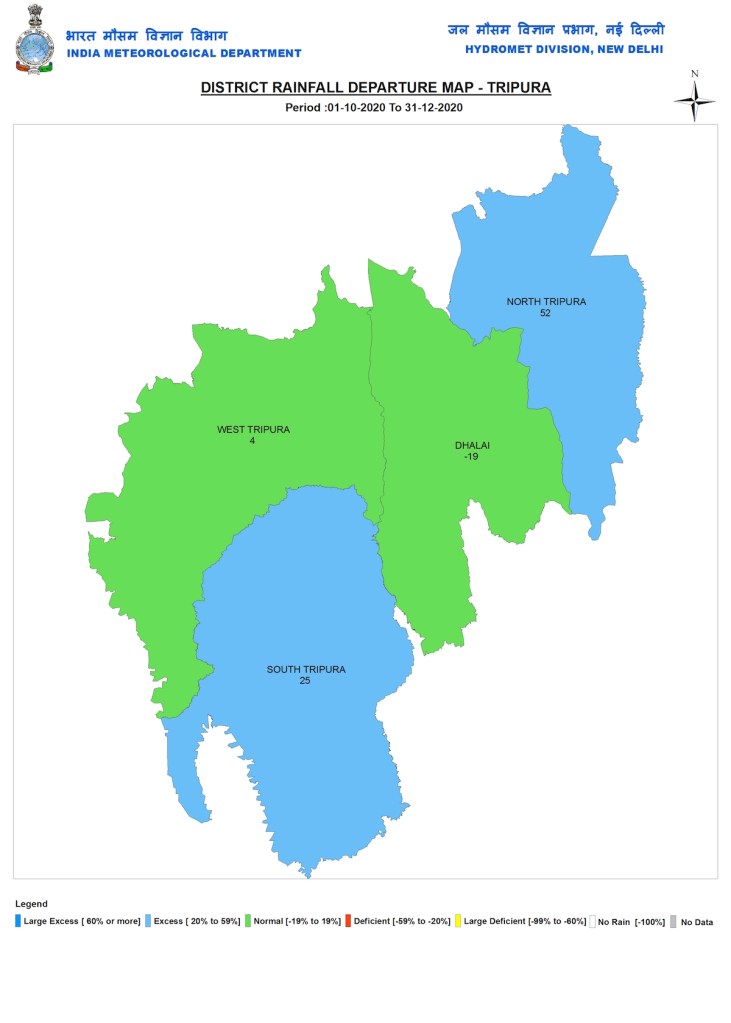
Tripura
SANDRP (ht.sandrp@gmail.com)
END NOTES:
[i] India Meteorological Department (IMD) divides a water year (June 1 to May 31) into four seasons: Monsoon: (June 1 to Sept 30), Post monsoon (Oct 1 to Dec 31), Winter (Jan 1 to Feb 28/9) and Pre Monsoon (March 1 to May 31). For rainfall during all these seasons, IMD’s hydro-meteorological website provides a lot of data on daily basis, including daily district wise, state-wise, sub division wise and river wise rainfall maps among many other weekly, monthly and seasonal products. However, one problem with it is that none of this information is achieved. So if you missed seeing or downloading available data on any date, there is no way to look at it even next day. This is even true of the seasonal rainfall maps, unfortunately.
[ii] https://mausam.imd.gov.in/backend/assets/press_release_pdf/Press_release_28th_October_2020.pdf
[iii] https://sandrp.in/2020/06/05/india-received-20-excess-rains-in-pre-monsoon-2020/
