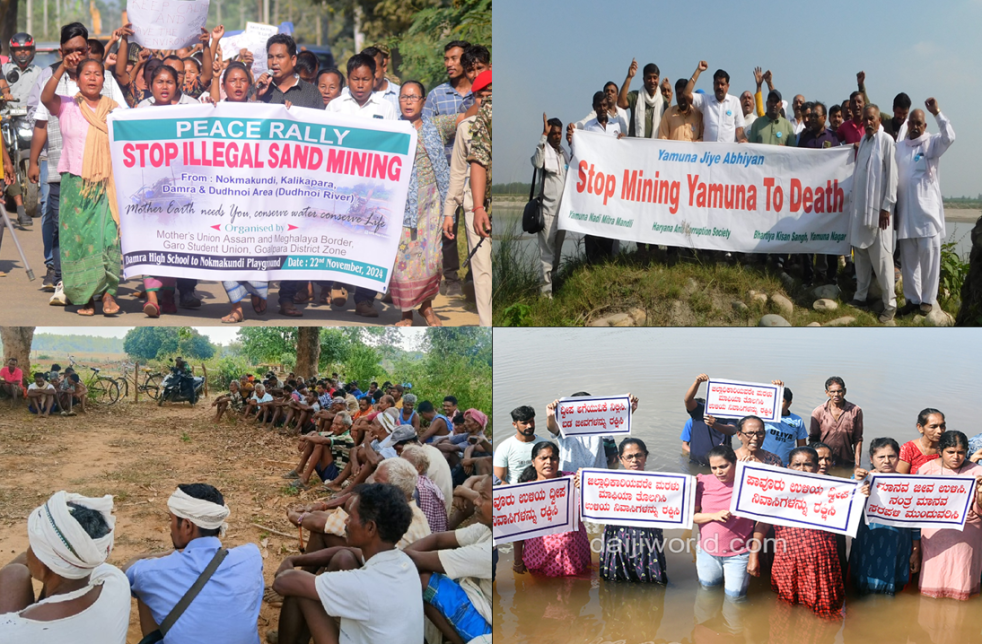
Since 1997, March 14 has been observed as an International Day of Action for Rivers across the world. This year the 29th event on the topic will be celebrated with the theme ‘Our Rivers, Our Future’. Marking the day, SANDRP through this account highlights the exemplary work being done by activists and organizations in protecting the rivers from destructive riverbed mining practices in India.
Continue reading “Indian People’s Fight Against Destructive Riverbed Mining”Tag: Subarnarekha
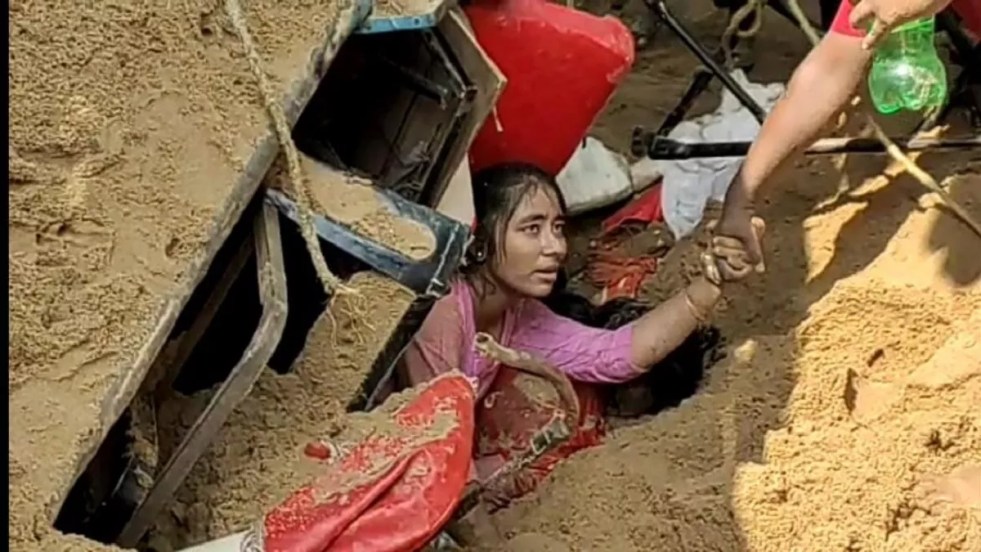
2023: Riverbed Mining Deaths & Violence in East India
(Feature Image: A sand loaded truck overturned on a passenger auto killing 5 people & injuring 5 others in Motihari, Bihar in Sept. 2022. Image Source: Dainik Jagran)
In this second part, SANDRP present summary report on riverbed minerals mining related human deaths and violent incidents in East Indian states of Bihar, West Bengal, Odisha, Jharkhand, Chhattisgarh and in North Eastern states of Assam and Manipur during April 2022 to February 2023. The detailed tabular report compiling all these incidents in past 11 months can be seen here. The first part of the series tracking the human death toll on account of illegal, unsustainable sand mining activities in North Indian states for the same period can be seen here.
Continue reading “2023: Riverbed Mining Deaths & Violence in East India”
DRP 120421: Meghalaya, Himachal, MP people oppose Dam & Hydro projects
(Feature image: Locals protest against the proposed mega dam project on the Umngot river. Shillong Times)
From the news this week we can see news reports of strong protests to dam and hydro projects from North East India (protests against the proposed 240 MW Umngot hydropower project), North India (protests against the Jangi Thopan power project in Himachal Pradesh) and Central India (protests against the Ken Betwa Link Project and Basania Dam on Narmada, both in Madhya Pradesh), among others. These protests underline not only the protests against the social and environmental destruction such projects bring, but also the abysmally poor environmental governance and decision making processes, the shoddy Environment Impact Assessments, the Public Hearings and over all undemocratic decision making process. One hopes the government realises the underlying issues and addresses them urgently rather than ignoring the messages and messengers.
Continue reading “DRP 120421: Meghalaya, Himachal, MP people oppose Dam & Hydro projects”
Riverbed mining 2020: East & North East India
This compilation covers the Riverbed mining issue in remaining states of East and North East India in the past eighteen months. There were not enough media reports on the issue of sand mining in remaining states of East and North East India. Hence we have prepared the single compilation covering these states. We have also put some informative reports from previous years which we had not compiled earlier to highlight the problems of illegal mining.
Continue reading “Riverbed mining 2020: East & North East India”
Odisha River Sand Overview 2020: Another mining ravaged state
The overview presents picture of river sand mining in Odisha based on available information in public domain from past 18 months.
Illegal Sand Mining Incidents
May 2019 Brick kilns spur illegal mining Scores of illegal brick kilns operating in Samana and Habaleswar panchayats under Hatadihi block in Keonjhar district had spurred illegal mining from riverbeds. As a result, the state government was losing crores of rupees revenue. The miners had encroached upon government and pastureland and set up brick kilns without sanction of the Odisha State Pollution Control Board.
Continue reading “Odisha River Sand Overview 2020: Another mining ravaged state”
DRP: 27 April 2020: For whom is this unviable Etalin project being pushed?
In the ongoing debate on forest clearance for the controversial Etalin Hydropower project in Dibang Valley in Arunachal Pradesh between the Forest Advisory Committee, The Hindustan Times’s consistent reporting and Sanctuary magazine launching a campaign along with others, one (of the many) key question that remains unanswered is: for whom this economically (in addition to socially, environmentally and from climate change perspective) unviable, massively expensive project being pushed in a power surplus country?
Electricity from hydropower projects is no longer economically viable, since cheaper options are available. Some misguided people are claiming virtue in hydropower project claiming it provides peaking power. The fact is India is today not only power surplus, the peak power deficit has been just around 1% or less for long time. This when there is no attempt to either monitor as to how much of the electricity produced from existing hydropower projects provides peaking power, nor is there any attempt to achieve optimisation of operation of existing hydro projects to produce maximum possible hydropower. Nor is there any attempt to even manage the peaks either through pricing or other policy measures. In such a situation there is clearly no justification for more hydro for peaking. Moreover, the storage option is becoming increasingly cost effective, reducing the peaking power needs. So then for whom this project whose cost won’t be less than Rs 30000 crores at most conservative estimates, being pushed? The contractors, the equipment suppliers, the hydro lobby, the consultants, the timber lobby, the dam lobby, or the kickbacks?
Continue reading “DRP: 27 April 2020: For whom is this unviable Etalin project being pushed?”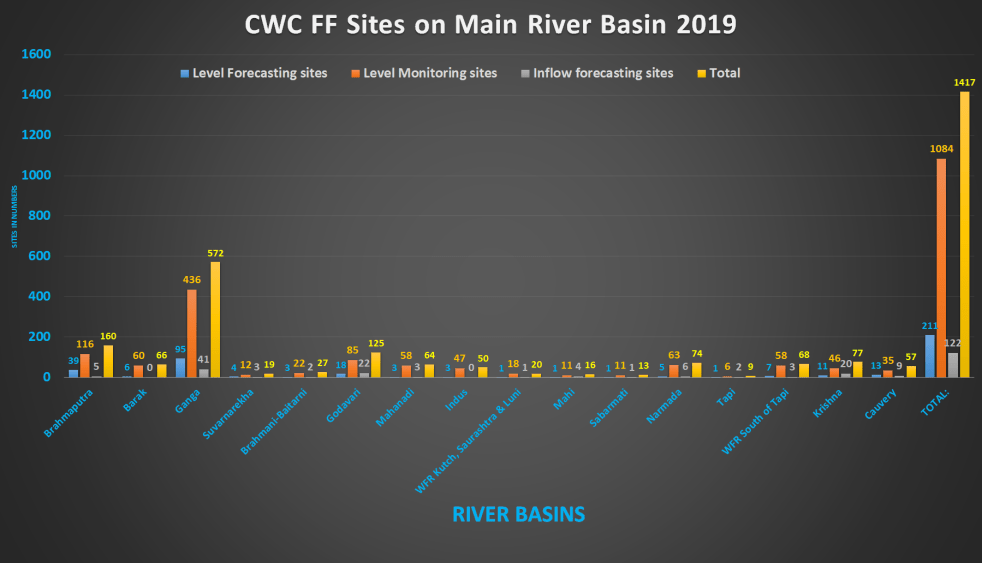
2019 All India summary of CWC flood forecasting sites
This article provides and overview of flood forecasting work of Central Water Commission (CWC) in 2019 after looking closely at each site details for the five regions of India: North East[i], East[ii], North[iii], West[iv] and South[v] India.
The table below provides an overview of number of Level Forecasting, Level Monitoring and Inflow forecasting sites as per CWC’s FF website during 2019 floods for all the states and regions of India.
Continue reading “2019 All India summary of CWC flood forecasting sites”
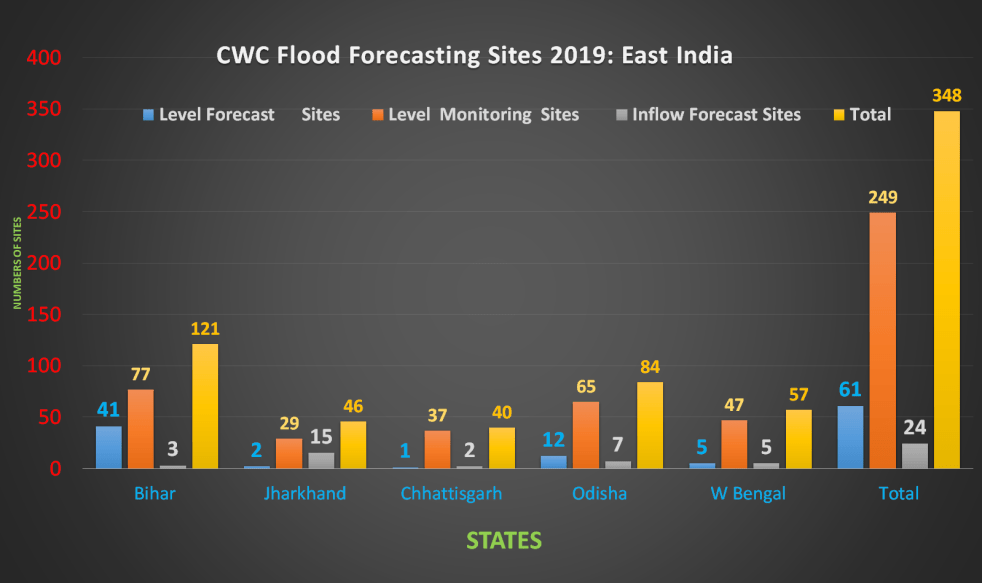
East India: 2019 Overview of CWC Flood Forecasting Sites
Central Water Commission (CWC) is the only agency doing flood forecasting in India. CWC’s Flood Forecasting (FF) is available on its website[I]. In this article we have given an overview of CWC’s flood forecasting and monitoring sites in East India. It includes state wise list of CWC’s Level Forecast, Inflow Forecast and level monitoring sites in East India. Similar report has been published for North East India[II] and North India[III] and we hope to publish reports covering other regions of India soon. East India includes five states: Bihar, Jharkhand, Chhatisgarh, Odisha and W Bengal.
Continue reading “East India: 2019 Overview of CWC Flood Forecasting Sites “
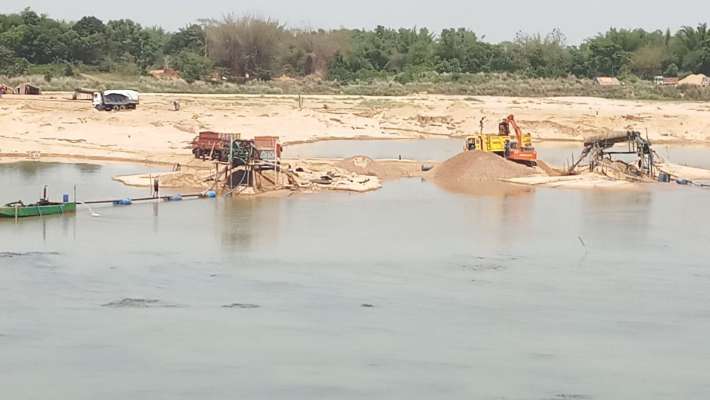
East India Sand Mining 2018: Will NGT order help restore Subarnarekha River?
Bihar Unsustainable sand mining causing floods in West Champaran The sand mining in the rivers of West Champaran was causing unmitigated floods in the region, year after year but the govt failed to respond.
– West Champaran district also sees many floods in the non-monsoon months, many of which go unreported, and often, ignored by flood-relief schemes. The natural explanation for the flash floods is that the region is at the foothills and rivers from the hills of bordering Nepal flow through it. But the floods are not entirely a result of natural phenomena. Over the years, excessive sand mining in the river beds has led to ecological imbalances, making rivers and streams flood and even change their course, wreaking havoc in the villages along their banks.
Continue reading “East India Sand Mining 2018: Will NGT order help restore Subarnarekha River?”

Overview of CWC Flood Forecasting Sites 2018: East India
Central Water Commission is the only agency doing flood forecasting in India. As per CWC’s Flood Forecasting website[I] the Data Flow Map has information about 226 Flood Forecast Sites in the country comprising of 166 Level Forecast Sites and 60 Inflow Forecast Sites. It also monitors 700 Flood sites, information made available through List Based Exploration and Hydrograph View, but no flood forecasting is done for these sites.
In order to better understand the CWC’s flood monitoring and forecasting work, in this article we have given an overview of CWC’s flood forecasting and monitoring sites in East India. It includes state wise list of CWC’s Level Forecast, Inflow Forecast and level monitoring sites in East India. Similar report has been published for North India[II] and North East India[III] and we hope to publish reports covering other regions of India too.
Continue reading “Overview of CWC Flood Forecasting Sites 2018: East India “
