This article provides and overview of flood forecasting work of Central Water Commission (CWC) in 2019 after looking closely at each site details for the five regions of India: North East[i], East[ii], North[iii], West[iv] and South[v] India.
The table below provides an overview of number of Level Forecasting, Level Monitoring and Inflow forecasting sites as per CWC’s FF website during 2019 floods for all the states and regions of India.
2019 All India Summary Table of Level and Inflow Forecast, Monitoring Sites
| States | Level Forecast
Sites |
Level Monitoring Sites | Inflow Forecast
Sites |
Total |
| Arunachal Pradesh | 3 | 18 | 0 | 21 |
| Sikkim | 3 | 17 | 5 | 25 |
| Assam | 30 | 88 | 0 | 118 |
| Nagaland | 0 | 0 | 0 | 0 |
| Meghalaya | 0 | 16 | 0 | 16 |
| Manipur | 0 | 1 | 0 | 1 |
| Tripura | 2 | 12 | 0 | 14 |
| Mizoram | 0 | 25 | 0 | 25 |
| W Bengal-B’putra | 17 | 7 | 0 | 24 |
| NE India | 55 | 184 | 5 | 244 |
| Bihar | 41 | 77 | 3 | 121 |
| Jharkhand | 2 | 29 | 15 | 46 |
| Chhattisgarh | 1 | 37 | 2 | 40 |
| Odisha | 12 | 65 | 7 | 84 |
| W Bengal (Ganga)[vi] | 5 | 47 | 5 | 57 |
| EAST India | 61 | 255 | 32 | 348 |
| Jammu & Kashmir | 3 | 34 | 0 | 37 |
| Himachal Pradesh | 1 | 17 | 0 | 18 |
| Uttarakhand | 4 | 68 | 2 | 74 |
| Punjab | 0 | 1 | 0 | 1 |
| Haryana | 1 | 5 | 1 | 7 |
| Delhi | 2 | 1 | 0 | 3 |
| Uttar Pradesh | 37 | 137 | 5 | 179 |
| North India | 48 | 263 | 8 | 319 |
| Rajasthan | 3 | 33 | 11 | 47 |
| Madhya Pradesh | 3 | 139 | 10 | 152 |
| Gujarat | 6 | 27 | 7 | 40 |
| Maharashtra | 11 | 72 | 14 | 97 |
| Goa | 0 | 2 | 0 | 2 |
| West India | 23 | 273 | 42 | 338 |
| Andhra Pradesh | 10 | 31 | 11 | 52 |
| Telangana | 05 | 15 | 08 | 28 |
| Karnataka | 11 | 42 | 14 | 67 |
| Kerala | 04 | 35 | 02 | 41 |
| Tamil Nadu | 08 | 54 | 12 | 74 |
| South India | 38 | 177 | 47 | 262 |
| Union Territories[vii] | 1 | 3 | 0 | 4 |
| INDIA | 226 | 1155 | 134 | 1515 |
Among the states, the highest number of level forecasting sites are in Bihar (41), followed by UP (37). The highest number of level monitoring sites are in Madhya Pradesh (139) followed by Uttar Pradesh (137). The highest number of inflow forecasting sites are in Jharkhand (25) followed by Karnataka and Maharashtra (14 each). The total number of sites are highest in Uttar Pradesh (179) followed by Madhya Pradesh (152).
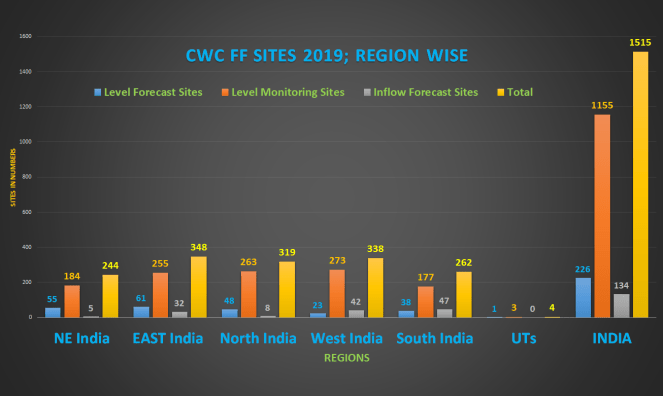
Among the regions, the highest number of Level Forecasting sites are in East India (61), followed by North East India (55). The highest number of Level Monitoring sites are in West India (273) followed by North India (263). The highest number of Inflow forecasting sites are in South India (47) followed by West India (42). The highest number of total sites are in East India (348) followed by West India (338).
Numbers up from 2018 If we compare the number of sites at all India level between 2018[viii] and 2019, we see that the number of Level forecasting sites has gone up from 185 in 2018 to 226 in 2019. The number of Level Monitoring sites has seen much bigger jump from 597 to 1155. The number of inflow forecasting sites have gone up from 103 in 2018 to 134 in 2019, but there is no change in poor quality of inflow forecasting information. The total number of sites have gone up from 885 in 2018 to 1515 in 2019.
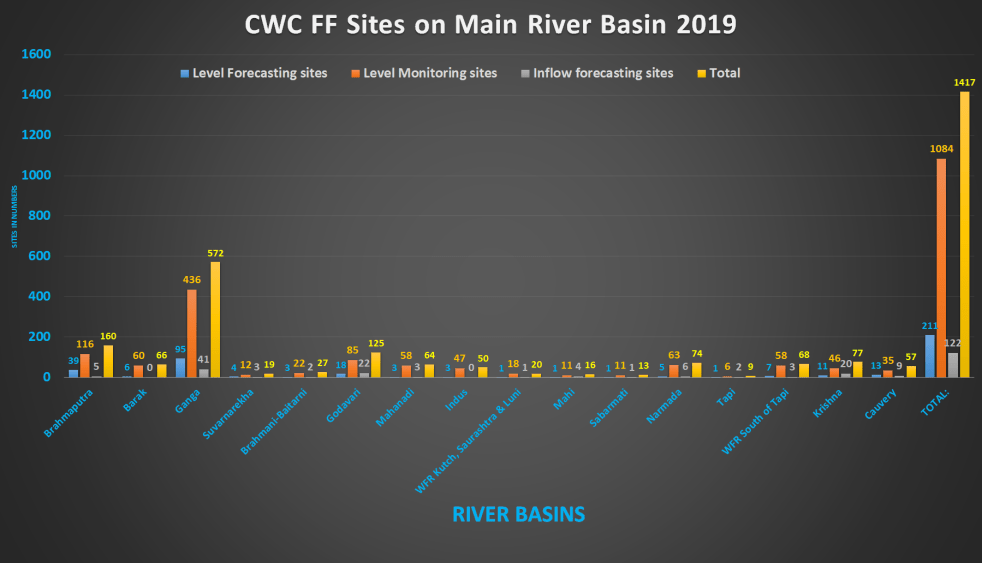
River Basin wise distribution In the table below we have given river basin wise distribution of Level forecasting, Level Monitoring and Inflow forecasting sites of CWC.
| River Basins | Level Forecasting sites | Level Monitoring sites | Inflow forecasting sites | Total |
| Brahmaputra | ArP: 3
Assam: 26 Sikkim: 3 W Bengal: 7 TOTAL: 39 |
ArP: 18
Assam: 60 Meghalaya: 4 Sikkim: 17 W Bengal: 17 TOTAL: 116 |
Sikkim: 5 | 160 |
| Barak | Assam: 4
Tripura: 2 TOTAL: 6 |
Assam: 28
Manipur: 1 Tripura: 14 Mizoram: 17 TOTAL: 60 |
0 | 66 |
| Kynchiang and other south flowing rivers | 0 | Meghalaya: 7 | 0 | 7 |
| Rivers flowing to Bangladesh | 0 | Meghalaya: 5
Mizoram: 3 |
0 | 8 |
| Rivers flowing to Myanmar | 0 | Mizoram: 5 | 0 | 5 |
| Ganga | Bihar: 41
Jharkhand: 1 W Bengal: 5 Himachal: 1 Uttarakhand: 4 Haryana: 1 Delhi: 2 Uttar Pradesh: 38 Rajasthan: 2 TOTAL: 95 |
Bihar: 77
Jharkhand: 23 Chhattisgarh: 1 W Bengal: 45 Himachal: 5 Uttarakhand: 68 Haryana: 5 Delhi: 1 Uttar Pradesh: 137 Rajasthan: 20 Madhya Pradesh: 54 TOTAL: 436 |
Bihar: 3
Jharkhand: 12 W Bengal: 5 Uttarakhand: 2 Haryana: 1 Uttar Pradesh: 5 Rajasthan: 9 Madhya Pradesh: 4 TOTAL: 41 |
572 |
| Suvarnarekha | Jharkhand: 1
Odisha: 3 |
Jharkhand: 5
Odisha: 5 W Bengal: 2 |
Jharkhand: 3 | 19 |
| Brahmani-Baitarni | Odisha: 3 | Jharkhand: 1
Odisha: 21 |
Odisha: 2 | 27 |
| Godavari | Chhattisgarh: 1
Maharashtra: 7 Andhra Pradesh: 5 Telangana: 5 TOTAL: 18 |
Chhattisgarh: 5
Odisha: 3 Madhya Pradesh: 19 Maharashtra: 46 Andhra Pradesh: 3 Telangana: 8 Karnataka: 1 TOTAL: 85 |
Odisha: 4
Madhya Pradesh: 1 Maharashtra: 9 Andhra Pradesh: 1 Telangana: 6 Karnataka: 1 TOTAL: 22 |
125 |
| Mahanadi | Odisha: 3 | Chhattisgarh: 31
Odisha: 27 |
Chhattisgarh: 2
Odisha: 1 |
64 |
| East Flowing Rivers | Odisha: 3 | Odisha: 9 | 0 | 12 |
| Indus | J & K: 3 | J&K: 34
Himachal: 12 Punjab: 1 |
0 | 50 |
| West flowing rivers of Kutch Saurashtra & Luni | Rajasthan: 1 | Rajasthan: 5
Gujarat: 13 |
Gujarat: 1 | 20 |
| Mahi | Gujarat: 1 | Rajasthan: 7
Madhya Pradesh: 2 Gujarat: 2 |
Rajasthan: 2
Gujarat: 2 |
16 |
| Sabarmati | Gujarat: 1 | Rajasthan: 1
Gujarat: 10 |
Gujarat: 1 | 13 |
| Narmada | Madhya Pradesh: 3
Gujarat: 2 |
Madhya Pradesh: 63 | Madhya Pradesh: 5
Gujarat: 1 |
74 |
| Tapi | Gujarat: 1 | Madhya Pradesh: 1
Gujarat: 1 Maharashtra: 4 |
Gujarat: 1
Maharashtra: 1 |
9 |
| West Flowing Rivers South of Tapi | Gujarat: 1
Maharashtra: 1 Kerala: 4 Daman, Diu: 1 TOTAL: 7 |
Gujarat: 1
Maharashtra: 9 Goa: 2 Karnataka: 9 Kerala: 34 Tamil Nadu: 4 TOTAL: 58 |
Gujarat: 1
Kerala: 2 TOTAL: 3 |
68 |
| Krishna | Maharashtra: 3
Andhra Pradesh: 3 Karnataka: 5 TOTAL: 11 |
Maharashtra: 13
Andhra Pradesh: 8 Telangana: 7 Karnataka: 18 TOTAL: 46 |
Maharashtra: 4
Andhra Pradesh: 5 Telangana: 2 Karnataka: 9 TOTAL: 20 |
77 |
| East Flowing Rivers | Andhra Pradesh: 2
Tamil Nadu: 1
|
Andhra Pradesh: 20
Karnataka: 1 Tamil Nadu: 31 Puducherry: 1 |
Andhra Pradesh: 5
Tamil Nadu: 7 |
68 |
| Cauvery | Karnataka: 6
Tamil Nadu: 7 |
Karnataka: 13
Kerala: 1 Tamil Nadu: 19 Puducherry: 2 |
Karnataka: 4
Tamil Nadu: 5 |
57 |
| TOTAL: | 217 | 1166 | 134 | 1517 |
Note: There is slight discrepancy between total figures in two tables, which is because of inconsistencies in the CWC flood forecasting sites. We are trying to resolve them.
As we can see from the table above, expectedly, Ganga basin has the highest number of Level forecasting, Level Monitoring and Inflow forecasting sites, as also total number of sites. Brahmaputra basin is second with respect to all these except in case of Inflow forecasting sites, where Godavari basin (22) comes second after Ganga basin. Low number of flood forecasting sites (3) in flood prone Indus basin, among others is surprising.
These numbers significantly vary from those given in the CWC publication titled: “Standard Operating Procedure for Flood Forecasting”, published in April 2019[ix].
In Conclusion Central Water Commission’s flood forecasting sites have significantly increased in 2019 compared to 2018, but in terms of quality of forecasts and its overall forecasting work, we do not see huge improvements, while there is a huge scope for improvement. Flood forecasting is a very important part of flood management and if done with rigour can be a very useful tool in reducing the flood damage. It can also help improve the reservoir management, but there the CWC’s performance is the poorest.
SANDRP (ht.sandrp@gmail.com)
END NOTES:
[i] https://sandrp.in/2019/10/02/overview-of-cwcs-flood-forecasting-sites-2019-north-east-india/
[ii] https://sandrp.in/2019/10/06/east-india-2019-overview-of-cwc-flood-forecasting-sites/
[iii] https://sandrp.in/2019/09/25/overview-of-cwc-flood-forecasting-sites-2019-north-india/
[iv] https://sandrp.in/2019/10/13/west-india-overview-of-cwc-flood-forecasting-sites-2019/
[v] https://sandrp.in/2019/10/18/south-india-overview-of-cwc-flood-forecasting-sites-2019/
[vi] W Bengal has been divided into two region: The Brahmaputra basin part is included in North East India and Ganga Basin part in East India.
[vii] These include Chandigarh (no sites), Dadra and Nagar Haveli (no sites, one that was there in 2018 has been dropped now), Lakshdweep Islands (no sites), Andaman Islands (no sites), Puducherry (three sites, all monitoring sites) and Diu-Daman (one level monitoring site on Damanganga river).
[viii] https://sandrp.in/2018/09/18/india-overview-of-cwc-flood-monitoring-sites/
[ix] http://cwc.gov.in/standard-operating-procedure-flood-forecasting-april-2019
