In last six years, from 2016-17 to 2021-22, India’s Large Hydropower projects (projects above 25 MW installed capacity) have contributed just around 10% of the total power generation, going as low as 9.68% in 2017-18. In fact, in three of these six years, large hydro contributed less than 10% and recovering only marginally in the rest, thanks to surplus monsoon.
Continue reading “INDIA’S HYDRO GENERATION CONTRIBUTION AROUND 10% for SIX YEARS”Category: Hydropower Performance
India’s hydro generation in 2019-20
In 2019-20 power generation from India’s large hydropower projects[i] was 11.26% of total electricity generation in India. In 2016-17, for the first time in independent India’s history, power generation from large hydropower projects in India fell below 10% of total electricity generation and remained below 10% for the next three years: 2016-17, 2017-18 and 2018-19. This calculation is based on actual generation (measured as Million or Billion Units[ii]) as reported by Central Electricity Authority (CEA) and not installed capacity (measured in Mega Watts). Continue reading “India’s hydro generation in 2019-20”
India’s hydro generation AGAIN below 10% in 2018-19
In 2018-19, for the third year in succession, power generation from India’s large hydropower projects was below 10% of total electricity generation in India. In 2016-17, for the first time in independent India’s history, power generation from large hydropower projects in India fell below 10% of total electricity generation. This calculation is based on actual generation (measured as Million or Billion Units[i]) and not installed capacity (measured in Mega Watts). Continue reading “India’s hydro generation AGAIN below 10% in 2018-19”

India’s hydro generation AGAIN below 10% in 2017-18
In 2016-17, for the first time in independent India’s history, hydropower generation from large hydropower projects in India fell below 10% of total electricity generation. In 2017-18, for which the Central Electricity Authority figures have just became available, the trend has continued, with proportion of electricity produced by large hydropower projects going further down. This percentage is in terms of actual generation (measured as Million or Billion Units[i]) and not installed capacity (measured in Mega Watts). Continue reading “India’s hydro generation AGAIN below 10% in 2017-18”

Diminishing Returns from Large Hydropower projects: Opportunity for a pause
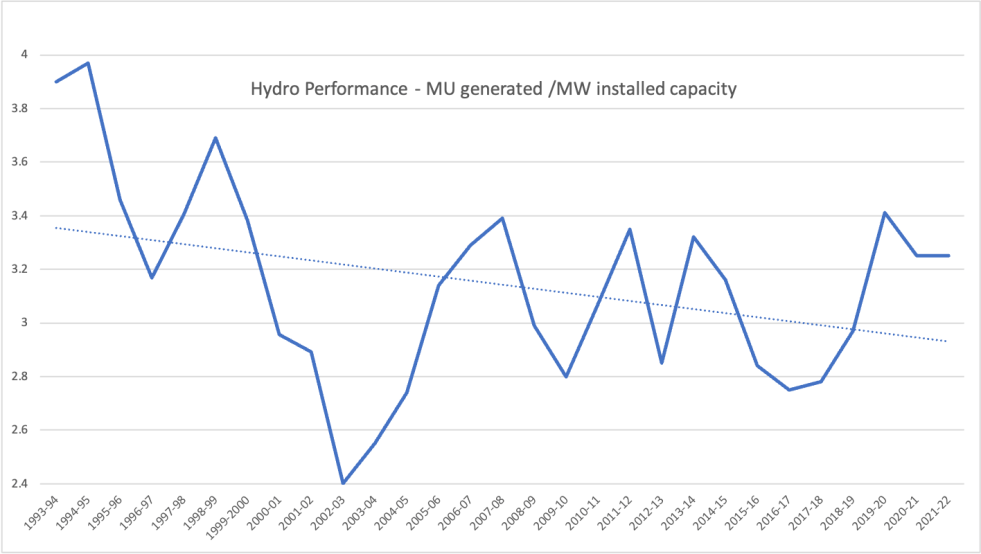
As per the latest power generation figures released by the Central Electricity Authority,[1] the hydropower generation during the current Financial Year 2016-17 is likely to be lower than the previous year’s generation even though the installed capacity has gone up. Average generation per MW of hydro capacity in India in 2016-17 is likely to be about 30% less power than what our average generation was in 1994-95. More worryingly, the hydropower generated per MW installed capacity continues its downward slide, the downward slide has been going on for now over two decades. Continue reading “Diminishing Returns from Large Hydropower projects: Opportunity for a pause”
Hydropower projects in India: Important 2015 Developments
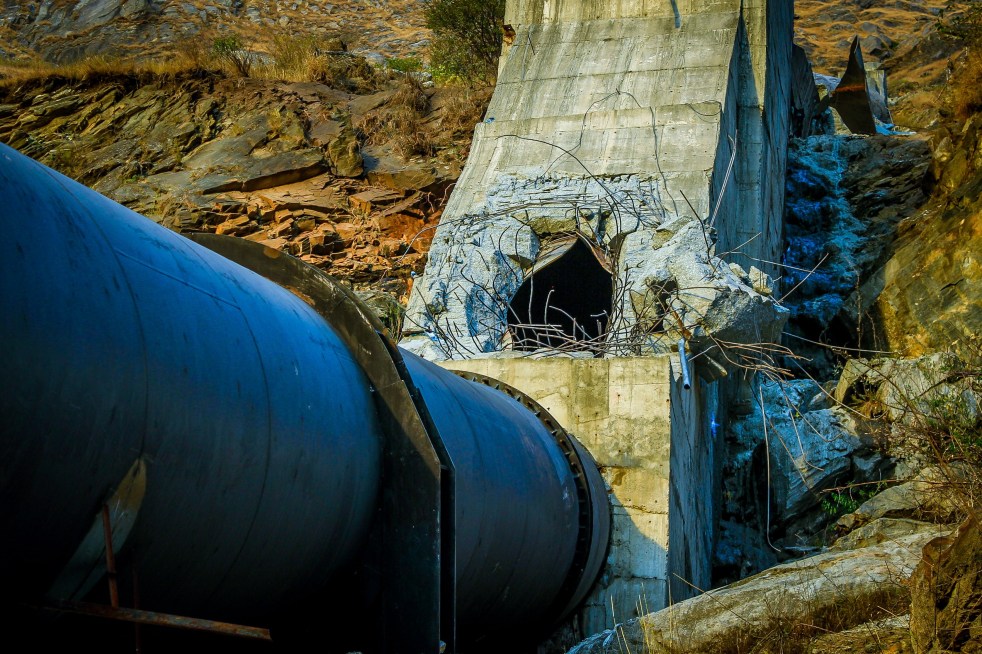
Above: Penstock burst of Sorang Hydropower Project in Himachal Pradesh (Photo: Himdhara)
Indian government continues to have very ambitious hydropower targets, even though all the evidence suggests why we should be reviewing it. As per Central Electricity Authority, India has 42641 MW of installed capacity from large hydropower projects at the end of Dec 2015. The installed capacity from projects below 25 MW is not included in this figure.
CAPACITY ADDITION IN 2015: Troubled projects During 2015, India added 1824 MW of large hydropower capacity. Some of the important projects commissioned during the year include: 800 MW Kol Dam in Himachal Pradesh (one unit each on 30.03, 31.03, 10.04, 12.06), 450 MW Baglihar II in Jammu and Kashmir, 80 MW at Lower Jurala Project in Telangana, 330 MW Srinagar HEP in Uttarakhand and 96 MW Jorethang Loop Project in Sikkim. The first project is in Central Sector, next two in state sector and last two in private sector. Except for the 80 MW from Lower Jurala, rest of the capacity is all in Himalayan states.
As we reviewed these projects closely in a separate blog, all of these projects have had a very troubled track record and most continue to face serious problems even after commissioning.
What does all this show? The reason for going into above details about projects commissioned in 2015 is to illustrate how seriously problematic our decision-making has been, even in these times. Evidently, there is a need to overhaul decision making surrounding hydropower projects in vulnerable areas which face local opposition.
Are we paying any attention to this? Unfortunately, no.
To illustrate, let us look at the decisions taken by the Union Ministry of Environment and Forests’ Expert Appraisal Committee on River Valley and Hydropower Projects. All hydropower projects above 25-50 MW need clearance from this committee, as also all large irrigation projects.
EAC DECISIONS IN 2015: As our earlier analysis showed[1], the EAC has had zero rejection rate and has been clearing huge number of dams and hydropower projects, far exceeding the need, justification or carrying capacity of the river basins, with very little attention to the prudent environment governance.
During the year 2015[2], EAC continued this tradition of zero rejection rate! Even for the couple of projects that it did not agree to approve immediately, it asked for a reformulate of the proposal, keeping the options open.
During 2015, EAC recommended environment clearance to twelve projects; six of them were hydropower projects, all from Arunachal Pradesh. The biggest of them, the Kalai II project of 1200 MW showed how starkly flawed were the EAC decisions. Rest of the six were irrigation projects, including two controversial lift irrigation projects from Maharashtra (Shirapur and Krishna Marathwada) and one irrigation project each from Tamil Nadu, Odisha, Chhattisgarh and Telangana.
It should be added here, as a reminder to the decision makers, that the work at Lower Subansiri Hydropower project continued to remain stalled for the four full years as on Dec 16, 2015. This is an indication, if one was required, to show how costly the consequences of wrong decisions can be.
The EAC cleared 21 projects for first stage environment clearance, including 9 hydropower projects, two each from Arunachal Pradesh, Uttarakhand, Himachal Pradesh, Jammu & Kashmir and one from Sikkim. It also cleared four irrigation projects (one each from Rajasthan, Bihar, Jharkhand and Odisha) and eight lift irrigation projects (five from Karnataka, two from Maharashtra and one from Uttar Pradesh). It also okayed 16 applications for extension of validity for the first stage clearance, the validity, which is supposed to be for 2-3 years, went on for 4-5 years!
The EAC discussed Cumulative Impact Assessments (CIA) of Tawang, Subansiri, Siang, Dibang and Kameng river basins, all in North East India this year. Worrying, during each of these discussions it eventually approved shoddy and seriously problematic CIAs, diluted its own recommendations and refused to understand the concept of conflict of interest.
EAC did say no to first stage environment clearance to Purthi HEP in Lahaul and Spiti district in Himachal Pradesh, but gave its ok when it came back with a slightly different configuration. It did say no to extension of TOR to Lara Sumta and Sumta Kathong HEPs, but suggested they can apply afresh! It has not yet cleared Ken Betwa, Etalin and Pancheshwar, but has not said no either to any of them. It did mention SANDRP submissions dozens of times, but did not invite SANDRP, or any other group to the EAC meetings even once where SANDRP submissions and developer response were discussed. There has never been a point-wise discussion in the EAC about the merits and demerits of the developer’s response. Just to illustrate how problematic has the EAC decisions have been, see our blog about the 86th meeting of EAC held in August 2015 https://sandrp.wordpress.com/2015/09/22/why-the-decisions-and-minutes-of-the-86th-meeting-of-eac-on-river-valley-projects-need-to-be-reviewed/.
All this only goes to illustrate how seriously problematic are our decisions about dams and hydropower projects.
GENERATION PERFORMANCE OF HYDROPOWER PROEJCTS The basic purpose of building hydropower projects is generation of electricity, let us see how India’s hydropower projects perform in 2015. During the year, with total installed capacity of 42641 MW as on Dec 31, 2015, India’s large hydropower projects, as per the data from Central Electricity Authority, generated 129.11 BU (Billion Units, one unit equals one kilowatt hour), compared to 130.8 BU in 2014. So even though installed capacity in 2015 went up by 1824 MW, generation went down by 1636 Million Units! Our earlier analysis[3] has shown how the returns from hydropower projects in India are diminishing in different respects. The trend continues in 2015.
Peaking power It may be added here that USP (Unique Selling Proposition) of hydropower projects is that they can provide peaking power ( power supply in the hours when the demand is highest). There is no agency that is either monitoring or trying to optimize peaking power from hydropower projects. However, let us take a snapshot of this situation. A review of the daily Power Supply reports of the Northern Region Load Despatch Centre shows that on Dec 31, 2015, Northern region had peaking shortage of 1529 MW. Northern Region, incidentally, should give us the best illustration in this regard since it has, at 18815 MW, the highest hydropower capacity among all regions of India. On Dec 31 2015, hydropower projects were providing 10041 MW of generation during peak hours, and 2446 MW generation during off peak hours. So net peak load provided by hydropower projects on Dec 31, 2015 was 7595 MW, which is just 40% of the hydro installed capacity of 18815 MW in the region. This snapshot tells us that on Dec 31, 2015 (incidentally, the rivers have minimal flows at this time and hence all the more reason even for run of river projects to operate in peaking mode) about 60% of the hydropower capacity was NOT providing peaking power, which it was supposed to do! It may be added that Northern region had only 1529 MW of peaking shortage, which could have been easily provided by the more optimum performance of these projects. It also tells us that as far as peaking power requirement is concerned, we do not really need more hydro since the current capacity is sufficient to cater to our peaking needs, if operated optimally, in a manner that hydropower projects are supposed to operate! Even as a snapshot, this tells us a lot!
HYDRO DISASTERS IN 2015 The year 2015 showed increasing disasters related to hydropower projects. Such disasters included the one at Chutak Hydropower project in Kashmir, Sorang hydropower project in Himachal Pradesh, Vishnuprayag hydropower project in Uttarakhand, Multiple disasters in Kinnaur district in Himachal Pradesh, among others. At Rishikesh in Uttarakhand, hundreds of people had narrow escape in Dec 2015 due to sudden release of water from Tehri Dam, as alleged by the news reports. The High Court of Himachal Pradesh, in Jan 2016, while announcing compensation to families of the students who lost their lives due to Larji Dam mishap in Oct 2014, called Larji Dam a Killer.
IN CONCLUSION This year end review of hydropower projects in India tells us that our decision making surrounding hydropower projects is flawed and that we can and must change the way the decision making system in functioning.
On the other hand, power generation performance of hydropower projects continue to diminish and even for peaking power requirement, we do not really need more hydropower.
It should also be added that as large number or organisations from all over the world wrote to the United National Frame Convention on Climate Change, Large Hydropower must not be considered as a solution in the climate change context.
Himanshu Thakkar, SANDRP (ht.sandrp@gmail.com)
END NOTES:
[1] https://sandrp.wordpress.com/2013/02/07/the-expert-approval-committee-has-zero-rejection-in-six-years/
[2] This review is for EAC meetings till November, the minutes of the EAC meeting of Dec 22-23, 2015 were not available till Jan 8, 2016, when I finished writing this article.
[3] https://sandrp.wordpress.com/2015/04/09/diminishing-returns-from-large-hydropower-projects-in-india/

Diminishing Returns from Large Hydropower projects in India
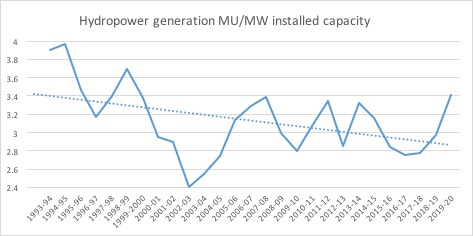
Above: Graph showing how the power generation per MW installed Hydro Capacity has been doing down over the last two decades
As per the latest power generation figures just released by the Central Electricity Authority[1] the hydropower generation during the just concluded Financial Year 2014-15 was 4.25% lower than the previous year’s generation even though the installed capacity has gone up. Average generation per MW of hydro capacity in India in 2014-15 was over 20% less power than what our average generation was in 1993-94. More worryingly, the hydropower generated per MW installed capacity continues its downward slide, the downward slide has been going on for now over two decades. Continue reading “Diminishing Returns from Large Hydropower projects in India”

Massive Hydropower capacity being developed by India: Himalayas cannot take this onslaught
At least 49 large[1] hydropower projects are under construction in India today, with a cumulative capacity of 15006 MW[2]. As per the latest bulletin from Central Electricity Authority[3], “Status of Hydro Electric Projects under Execution for 12th Plan & beyond (Excluding projects above[4] 25 MW)” dated March 31, 2014, 35 of these projects (9934 MW) are expected to be commissioned in 12th Five Year Plan[5] and remaining 14 with installed capacity of 5072 MW would provide benefit beyond 12th Plan.
Considering that 1534 MW capacity has already been added in first two years of ongoing 12th Five Year Plan (during 2012-13 and 2013-14), CEA projections means that India hopes to add massive 11468 MW capacity during the current five year plan. This will be higher than capacity added in any other five year plan and 254% of the capacity addition during the last, 11th Five Year Plan (2007-12) when India added 4514 MW. The graph below shows how steeply our hydropower installed capacity is going up over the last 25 years.

The proponent of even more accelerated hydro capacity addition misleadingly talk about the need for having 40% of installed grid capacity as hydro.
In line with this, the CEA came out with plans to add 65000 MW in 13th Five Year Plan (2017-2022: 30 000 MW) and 14th Five Year Plan (2022-2027: 35 000 MW). (see http://www.energylineindia.com/ of May 6, 2014)
There is no science behind this advocacy. It is basically a suggestion possibly based on the general assumption that peaking demand is 40% higher than base-load demand. Hence if we have 40% installed capacity from hydro in the grid, this can take care of total demand optimally. However, this is based on assumption that hydro capacity is indeed used for peaking. This assumption is completely wrong in India, with no agency monitoring or even reporting how much of the hydro generation currently provide peaking power. Without such optimum use of current hydro capacity, where is the case for 60:40 grid capacity ratio for hydro? It goes without saying that when hydro projects are used for peaking power, there are additional social and environmental impacts in the downstream and upstream. These need to assessed and those who suffer are compensated.
On similar lines, one can answer the advocacy for claim that hydro is clean, green, renewable and cheap source of power or that run of the river or small hydropower projects are more environmentally benign. However, this blog is not attempting to answer all such fallacies here, it needs a separate blog.
While this is happening, the Expert Appraisal Committee of Union Ministry of Environment and Forests on River Valley Projects has been clearing projects at break a neck speed with almost zero rejection rate. Between April 2007 and Dec 2013, this committee recommended environment clearance to 18030.5 MW capacity, most of which has not entered the implementation stage. Moreover, this committee has recommended 1st Environment clearance (what is technically called Terms of Reference Clearance) for a capacity of unimaginable 57702 MW in the same period. This is indicative of the onslaught of hydropower projects which we are likely to see in the coming years.
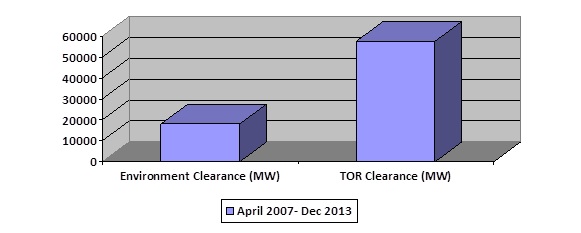
Table: Sector-wise & plan-wise number of & capacity of under construction HEPs
| Sector |
During 12th FYP |
After 12th Plan |
Total |
|||
| No of Projects | Installed capacity, MW | No of Projects | Installed capacity, MW | No of Projects | Installed capacity, MW | |
| Central |
11[6] |
5312 | 3 | 2615 | 14 |
7927 |
| State |
12 |
1506 | 3 | 736 | 15 |
2242 |
| Pvt |
12 |
3116 | 8 | 1721 | 20 |
4837 |
| Total |
35 |
9934 | 14 | 5072 | 49 |
15006 |
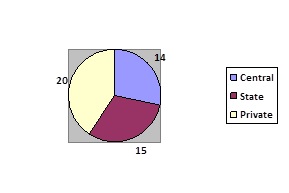
Among the three sectors, the largest number of under construction projects (20) are from private sector. However, among all sectors of under construction projects, central sector projects have the highest installed capacity (7927 or 53% of under construction capacity of 15006 MW).
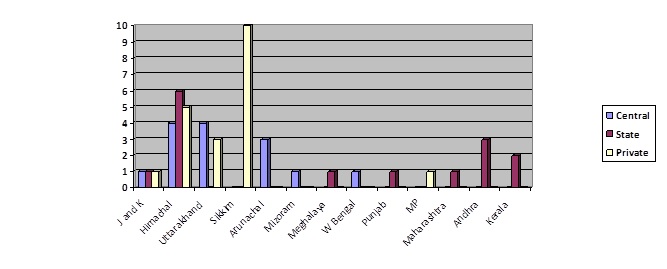
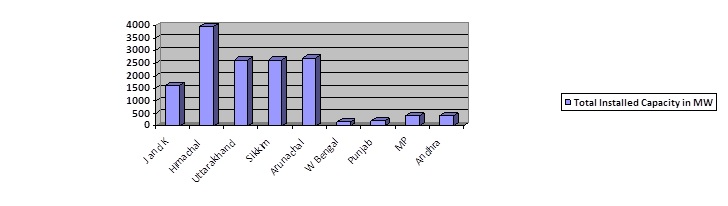
Vulnerable Himalayas are the target In the second table the state-wise and sector-wise break of numbers and capacity of under construction HEPs has been given. Himachal Pradesh has the highest number and highest installed capacity projects among all states. That state also has the highest installed capacity (8139 MW or over a fifth of operating HEP capacity at national level) of large operating hydropower projects. Sikkim, however, has the highest number and capacity of private sector hydropower projects under construction. In fact, half of the total national-level private sector projects which are under construction are in that tiny state. Their installed capacity is more than half the installed capacity of all the private sector hydropower projects under construction at national level. Ironically, the state also has the highest biodiversity in the country.

Himachal Pradesh and Uttarakhand also have 5 and 3 private sector HEPs under construction respectively. The 5 Himalayan states of Jammu & Kashmir (J&K), Himachal Pradesh, Uttarakhand, Sikkim and Arunachal Pradesh between them have 38 of the 49 under construction hydropower projects with total capacity of 13550 MW or over 90% of under construction capacity. In addition, the projects of Mizoram, Meghalaya, W Bengal (Teesta L Dam IV) and Punjab (Shahpur Kandi on Ravi River) are also in Himalayan zone.
Table: State-wise & sector-wise number and capacity of under-construction HEPs
| State |
Central Sector |
State Sector | Private Sector |
Total |
||||
| No of projects | Installed Capacity, MW | No of projects | Installed Capacity, MW | No of projects | Installed Capacity, MW | No of projects | Installed Capacity, MW | |
| J&K |
1 |
330 | 1 | 450 | 1 | 850 | 3 |
1630 |
| Himachal P |
4 |
2532 | 6 | 956 | 5 | 460 | 15 |
3948 |
| Uttarakhand |
4 |
2135 | – | – | 3 | 505 | 7 |
2640 |
| Sikkim |
– |
– | – | – | 10 | 2622 | 10 |
2622 |
| Arunachal P |
3 |
2710 | – | – | – | – | 3 |
2710 |
| Mizoram |
1 |
60 | – | – | – | – | 1 |
60 |
| Meghalaya |
– |
– | 1 | 40 | – | – | 1 |
40 |
| W Bengal |
1 |
160 | – | – | – | – | 1 |
160 |
| Punjab |
– |
– | 1 | 206 | – | – | 1 |
206 |
| Madhya Pr |
– |
– | – | – | 1 | 400 | 1 |
400 |
| Maharashtra |
– |
– | 1 | 80 | – | – | 1 |
80 |
| Andhra Pr |
– |
– | 3 | 410 | – | – | 3 |
410 |
| Kerala |
– |
– | 2 | 100 | – | – | 2 |
100 |
| Total |
14 |
7927 | 15 | 2242 | 20 | 4837 | 49 |
15006 |
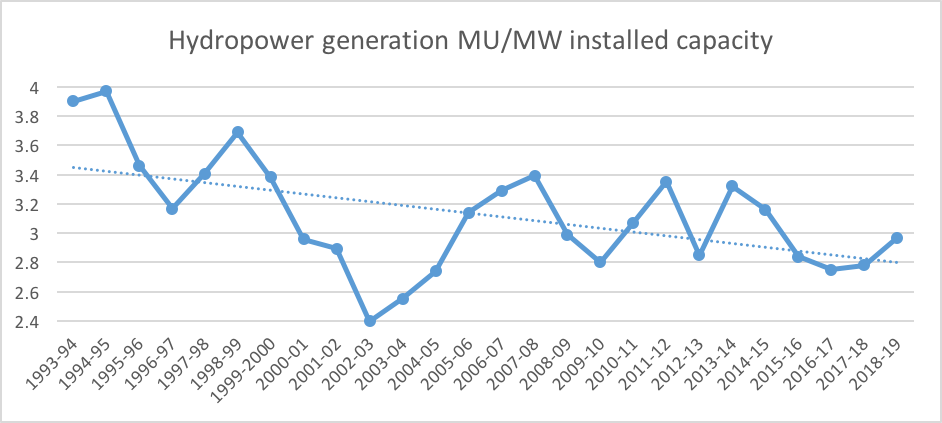
Diminishing Returns This blind rush for hydropower projects (which have serious and irreversible impacts on social and ecological systems) is difficult to understand and justify considering their poor generation performance, rising costs and availability of better options. To illustrate, in the graph below we can see how power generation per unit (MW) installed capacity has been steadily reducing over the last two decades. From 1993-94 to the latest year of 2013-14, there has been a huge drop of 16.5%.

Yawning gap between promised and actual generation of Hydro Projects Another way to look at performance of hydropower projects would be to compare the projected (as promised in Techno Economic Clearance) and actual generation (both at 90% dependability) of electricity by HEPs. This assessment shows that about 89% of India’s operating hydropower projects are generating at below the promised levels. Shockingly, half of under performing projects are generating at below 50% of promised generation levels.
How much Peaking Power are we generating? A third way to assess the hydropower generation is in terms of peaking power, a USP[7] of hydropower projects. However, no figures are available as to how much of the generation from hydropower projects are happening during peaking hours. No agency in India is even monitoring this or reporting this: including CEA, Central or State Electricity Regulatory Authority, National, Regional or State Load Dispatch Centers, Union or state Power Ministries or individual operators. In short, there is no case for justifying more hydro in the name of providing peaking power if we are neither monitoring nor optimizing hydropower generation during peaking hours. One expected CEA to do this job, but it seems they are busy lobbying for hydropower projects rather than functioning as India’s premier Technical Power sector agency.
Invitation to disaster? The consequences of such massive capacity addition are and will continue to be disastrous for the rivers, forests, biodiversity and people. The Uttarakhand disaster of June 2013 has shown the vulnerability of hydropower projects in Himalayas, as well as their impacts. The disaster and independent reports[8] also show how the construction and operation of these projects have contributed to compounding the proportion of the disaster. Climate Change is accentuating this situation and will continue to do so with increasing intensity as per the IPCC reports.
Role of HEPs in Uttarakhand disaster: CEA and CWC in denial mode This analysis of under construction hydropower projects as reported in the latest CEA bulletin shows that Himalayas is the target for overwhelming majority of hydropower projects being taken up India (& neighbouring countries like Bhutan, Nepal, Pakistan and Tibet). The Uttarakhand disaster showed how hydropower projects are increasing the existing vulnerabilities and disaster potential of the Himalayan region in times of natural calamities. An independent committee appointed by MoEF following Supreme Court orders of Aug 13, 2013 pointed out the role of hydropower projects in Uttarakhad disaster of June 2013.
It should be highlighted here that multiple hydropower projects should invite cumulative impact assessment. As Supreme Court order of Aug 13, 2013 highlighted, such cumulative impact assessment need to be done in a credible way and not the way AHEC of IITR did for the Bhagirathi-Alaknanda basin.
Strangely, instead of accepting this reality and taking this into account in decision making processes, Central Water Commission and Central Electricity Authority are in a denial mode! They collectively submitted a completely unscientific and unfounded report to Union Environment & Forests Ministry, advocating for hydropower projects rather than assessing their role in disaster, which was the mandate given by Supreme Court of India to MoEF. The CEA is clearly jeopardizing whatever credibility it has in joining hands with CWC. It would be better for both the agencies to accept and wake up to these realities.
Else, such onslaught of hydropower projects on Himalayas is likely to be an invitation to further disasters all across the Himalayas. All our decision makers and all others concerned need to take note of this urgently.
Himanshu Thakkar (ht.sandrp@gmail.com)
END NOTES:
[1] Defined as those projects having installed capacity above 25 MW
[2] In reality, there are many other large HEPs under construction, but his figure is based on CEA.
[3] http://cea.nic.in/reports/proj_mon/status_he_execution.pdf, CEA has been pretty irregular in putting up these bulletins, after Nov 2013, the next bulletin was available only now.
[4] In reality, this should be “below”, we have italicized the word since the error is in the original.
[5] Ending on March 31, 2017
[6] CEA projects that out of 2000 MW installed capacity of Lower Subansiri HEP in Arunachal Pradesh, 1000 MW will be commissioned in 12th Plan and the rest of 1000 MW thereafter.
[7] Unique Selling Proposition

Narmada dams’ levels depleted to generate more electricity: Threatening water security for Gujarat and Madhya Pradesh
An analysis of the available information on water levels and live storage % during February and March 2014 raises questions marks about the reasons for depletion of water levels in these dams when there was no apparent need. It prime facie seems to indicate that this has been done to generate more electricity in view of impending elections. However, this is likely to threaten water security of the people of Madhya Pradesh and Gujarat during coming summer months. It could also raise difficulties in post summer period if monsoon is deficit as seems to be indicated by the rapidly developing El Nino conditions. In table below we have given these figures for the Sardar Sarovar and Indira Sagar Dams, the biggest dams on Narmada in Gujarat and Madhya Pradesh.

Level change in SSP and NSP between Feb 6 and April 9, 2014
| Project | Particulars | Feb 6 | Feb 13 | Feb 20 | Feb 27 | Mar 6 | Mar 13 | Mar 20 | Mar 27 | Apr 9 |
| SSP | level m | 121.47 | 120.88 | 119.8 | 117.79 | 117.31 | 115.62 | 115.12 | 113.88 | 114.82 |
| % live storage | 95 (58) | 88 (55) | 76 (51) | 59 (48) | 53 (58) | 38 (60) | 33 (57) | 22 (53) | 31 (58) | |
| ISP | level m | 255.27 | 254.7 | 254.38 | 254.11 | 253.76 | 253.49 | 253 | 252.5 | 251.39 |
| % live storage | 47 (48) | 43 (47) | 41 (47) | 40 (46) | 37 (41) | 35 (39) | 34 (35) | 31 (34) | 26 (28) |
Note: figures in bracket with those % live storage levels are the figures for % live storage same date last year.
Source: CWC weekly reservoir level updates. Strangely, the Apr 3, 2014 bulletin does not provide the reservoir details, see: https://docs.google.com/folderview?usp=sharing&id=0B2IHafYlWNipTm1wVXhXelV4RDg
It is clear from the above figures that level and % live storage of water in Sardar Sarovar Project (SSP, on Narmada River in Gujarat, considered Gujarat’s lifeline by Gujarat politicians and government) has drastically reduced from 95% on Feb 6, 2014 to just 22% on March 27, to rise slightly to 31% on April 9. The level last year remained almost constant between 58% and 53% during the same period.

In case of upstream Indira Sagar Project (ISP) in upstream on Narmada River in Madhya Pradesh too the level has been drastically reduced from 47% on Feb 6, 2014 to 26% on April 9, 2014. There was no need for this depletion and water stored could have been of use during summer. Here too it seems level has been reduced to generate more power, again at the cost of water security for people of Madhya Pradesh and Gujarat.

It should be noted here that the storage gets depleted to the extent water is released from dams for hydropower generation and when water is released from 1200 MW River Bed Power House (RBPH) of SSP, it is not even useful for irrigation. Only water released through the 250 MW Canal Head Power House (CHPH) of SSP goes into canals and can be used for irrigation or water supply.

There was no need for this depletion and considering the impending summer and likelihood of deficit monsoon in view of developing El Nino conditions[1]. It seems the level has been depleted for generating extra electricity in view of ongoing elections, risking the water security for the Gujarat’s drought prone areas in coming summer. It should be disturbing that water level in SSP should reach such low level of 22% by March 27 this year when the monsoon was above average and water level at SSP reached its highest level till date in the monsoon. This mismanagement also punctures the hole in the oft repeated claim of the Gujarat government that Gujarat is suffering as it is not allowed to increase the dam height. If Gujarat cannot use water available at current dam height in optimal way, where is the case for increasing dam height?

Hydropower Generation The figures of electricity generation from these projects (and also Omkareshwar also on Narmada in Madhya Pradesh between ISP and SSP) from the official website of Central Electricity Authority (http://cea.nic.in/monthly_gen.html) for Feb and March 2014 and 2013 are given below.
| Project | Power stations | February | March | ||
| 2014 | 2013 | 2014 | 2013 | ||
| SSP | RBPH | 340.96 | 51.74 | 301.61 | 154.89 |
| CHPH | 48.48 | 17.09 | 44.3 | 47.92 | |
| Total | 389.44 | 68.83 | 345.91 | 202.81 | |
| NHDC | ISP | 230.76 | 120.67 | 242.94 | 223.21 |
| OHP | 106.23 | 68.08 | 109.18 | 116.75 | |
| Total | 336.99 | 188.75 | 352.12 | 339.96 | |
Note: All figures in Million Units (One Unit is one Kilowatt hour). All figures from Central Electricity Authority Website. The figures for March 2014 are tentative, but the final figures do not change much as past experience shows. RBPH: River Bed Power House; CHPH: Canal Head Power House; OSP: Omareshwar Hydropower Project; NHDC: Earlier known as Narmada Hydroelectric Development Corporation (http://www.nhdcindia.com/ a joint venture of Govt of Madhya Pradesh and NHPC Ltd)
It is clear from these figures that electricity figures at SSP and NHDC hydropower stations have certainly been much higher during Feb-March 2014 compared to the same months the previous year. For SSP, the total power generation during Feb March 2014 was 735.35 Million Units, compared to 271.64 MU during the same period last year, the increasing being huge 171% in 2014 compared to the same in 2013. In case of NHDC stations, the generation during Feb Mar 2014 was 689.11 MU, compared to 528.71 in Feb Mar 2013, increase in 2014 period being 30.33% higher in 2014. Thus it is clear that much higher amount of power has been generated during Feb Mar 2014 at SSP and NHDC stations compared to same period previous month, at the cost of depletion of water level in the SSP and ISP. The power benefits from SSP are shared in the ratio of 57: 27: 16 % for MP: Maharashtra: Gujarat.
While people in Gujarat and Madhya Pradesh are likely to suffer in coming summer and monsoon due to this unjustifiable depletion of these reservoirs, some people are already suffering. For example, as reported by newspapers[2], Badwani city water supply in Madhya Pradesh has already suffered as the water level in the river has gone the lowest intake level. The report says that Badwani does not even get regular electricity to lift water from the river for city water supply. So even as SSP and NHDC power stations are generating extra power, it is not being made available to such small towns. Worse days are in store, it seems. With electricity demand and rates in Feb and March being lower than in summer, it also raises the question as to how prudent it was to generate this power in winter and not in summer when demands and rates of electricity are higher.
As Energylineindia.com reported on April 14, 2014, “in February 2014, the PLF of thermal power plants was at 68.44% against the target of 71.3% on account of weak off-take of power… reason for lower thermal PLF is higher hydro generation. Hydel plants in February 2014 reported a 7.70% higher generation than what was programmed for the month. Hydel power generation is up by a whopping 25.98% in February 2014 as compared to the corresponding period in the previous year.” This also seems to be the case for March 2014. Thus, higher hydro generation during Feb-March 2014 actually led to backing down of thermal power plants, thus the Plant Load Factor of thermal power plans was lower in these winter months when electricity demands are not at peak. However, when electricity demand will be at peak in coming summer, these projects wont have water to generate power! Who will hold the operators of these projects accountable for this questionable decisions?
Reservoir storage at all India level At all India level, Central Water Commission provides storage situation for 85 reservoirs (37 of these reservoirs have hydropower component with installed capacity over 60 MW and total live storage capacity of 111.73 BCM) in its weekly bulletins, these reservoirs have total live storage capacity of 155.05 BCM (Billion Cubic Meters). On Feb 6, 2014, these reservoirs had a healthy 88.934 BCM in live storage, amounting to 57% of live storage capacity. By April 9, 2014 (the latest CWC bulletin), the storage in these reservoirs had dwindled to 59.581 BCM, just about 38% of live storage capacity. We hope these reservoirs are not further depleted in view of ongoing elections.
Not for the first time This is not happening for the first time in India[3]. During 2004 and 2009 elections too reservoir levels were unjustifiably depleted for additional electricity generation and people suffered in following monsoon when there were deficit monsoons. While in case of Narmada dams, the responsible agencies for reservoir operation decisions are state governments, Narmada Control Authority and Union Ministry of Water Resources in case of other dams, Central Water Commission is also responsible.
This again raises the recurring issue of more transparent, accountable and participatory reservoir management, which is completely absent in India. Without such a regime, politicians are likely to use the reservoir water as per their own agendas, to the detriment of the people and economy.
Rehmat M (Manthan Adhyayan Kendra, Badwani, r9300833001@gmail.com, 09300833001)
Himanshu Thakkar (SANDRP, Delhi, ht.sandrp@gmail.com, 09968242798)

END NOTES:
[1]http://articles.economictimes.indiatimes.com/2014-04-09/news/49000001_1_excess-rainfall-monsoon-forecast-normal-rainfall
[2] Dainik Bhaskar, April 9, 2014: http://epaper.bhaskar.com/detail/?id=546908&boxid=4902654906&ch=mpcg&map=map¤tTab=tabs-1&pagedate=04/09/2014&editioncode=363&pageno=1&view=image
[3] For exmaple, in case of Bhakra, the way the reservoir level was allowed to deplet in summer of 2012 had consequences in subsequent monsoon: https://sandrp.in/dams/PR_Why_precarious_water_situation_at_Bhakra_dams_was_avoidable_July_2012.pdf
[4] http://www.business-standard.com/article/economy-policy/indias-power-conundrumspot-power-prices-crash-to-lowest-ever-dipping-below-ntpcs-average-tariff-for-the-first-time-114041000455_1.html
ARTICLE IN HINDI TRANSLATED BY REHMAT OF MANTHAN ADHYAYAN KENDRA:
ज्यादा बिजली बनाकर नर्मदा का जलस्तर घटाया
मध्यप्रदेश और गुजरात में पेयजल सुरक्षा खतरे में
सरदार सरोवर और नर्मदा सागर बाँधों के जलस्तर और उनके उपयोगी भण्डारण (प्रतिशत में) के फरवरी और मार्च 2014 के आँकड़ों के विश्लेषण से इन बाँधों का जलस्तर घटाने पर गंभीर सवाल खड़े हुए हैं क्योकि जाहिर तौर पर ऐसी कोई जरूरत नहीं है। प्रथमदृष्टया यह आम चुनाव के मद्देनज़र ज्यादा बिजली उत्पादन के लिए किया जाना प्रतीत होता है। जलस्तर कम किए जाने से आगामी गर्मी में नर्मदा किनारे स्थित मध्यप्रदेश और गुजरात की शहरी आबादियों की जल सुरक्षा खतरे में पड़ने की संभावना है। यदि अल नीनो प्रभाव के कारण बारिश में कमी हुई तो गर्मी के बाद भी जलसंकट बना रह सकता है। इस स्थिति को स्पष्ट करने के लिए नीचे की तालिका में नर्मदा पर गुजरात और मध्यप्रदेश में बने सबसे बड़े बाँधों क्रमशः सरदार सरोवर और इंदिरा सागर के आँकड़े दिए गए हैं।
| 6 फरवरी से 9 अप्रैल 2014 के मध्य जलाशयों के जलस्तर में बदलाव | ||||||||||
| परियोजना का नाम | विवरण | 6फरवरी | 13फरवरी | 20फरवरी | 27फरवरी | 6 मार्च | 13मार्च | 20मार्च | 27मार्च | 9 अप्रैल |
| सरदार सरोवर | जलस्तर, मीटर में | 121.47 | 120.88 | 119.8 | 117.79 | 117.31 | 115.62 | 115.12 | 113.88 | 114.82 |
| उपयोगी जल भण्डार, प्रतिशत में | 95 (58) | 88 (55) | 76 (51) | 59 (48) | 53 (58) | 38 (60) | 33 (57) | 22 (53) | 31 (58) | |
| इंदिरा सागर | जलस्तर, मीटर में | 255.27 | 254.7 | 254.38 | 254.11 | 253.76 | 253.49 | 253 | 252.5 | 251.39 |
| उपयोगी जल भण्डार, प्रतिशत में | 47 (48) | 43 (47) | 41 (47) | 40 (46) | 37 (41) | 35 (39) | 34 (35) | 31 (34) | 26 (28) | |
| नोट – उपयोगी जल भण्डार के प्रतिशत वाली पक्ति में कोष्ठक में दिए गए आँकड़े पिछले वर्ष के इन्हीं तारीखों के हैं। इन आँकड़ों का स्रोत केन्द्रीय जल आयोग द्वारा साप्ताहिक जारी किए जाने वाले जलाशयों के स्तर संबंधी अपडेट है। आश्चर्यजनक रूप से 3 अप्रैल 2014 को जारी बुलेटिन में जलाशयों के कोई आँकड़े नहीं दिए गए हैं। इन बुलेटिनों को यहाँ देखा जा सकता है –https://docs.google.com/folderview?usp=sharing&id=0B2IHafYlWNipTm1wVXhXelV4RDg | ||||||||||
उपरोक्त आँकड़ों से स्पष्ट है कि सरदार सरोवर जलाशय (नर्मदा पर बने इस बाँध को गुजरात के राजनेता और सरकार गुजरात की जीवनरेखा बताते हैं) का उपयोगी जलभण्डारण 6 फरवरी से 27 मार्च 2014के मध्य 95% से घटकर मात्र 22% रह गया था जो 9 अप्रैल को हल्का सा बढ़कर 31% हुआ है। पिछले वर्ष इसी अवधि में ये आँकड़े 58 से 53% के मध्य स्थिर थे।
नर्मदा के ऊपरी क्षेत्र मध्यप्रदेश में बने इंदिरा सागर जलाशय में भी 6 फरवरी से 27 मार्च 2014 के मध्य जलभण्डारण 47% से घटाकर मात्र 27% कर दिया गया है। इस उपलब्ध जलभण्डारण को गर्मी के दिनों के लिए सुरक्षित रखने के बजाय अनावश्यक रूप से कम किया जा रहा है। ऐसा लगता है कि चुनावी फायदे के लिए अधिक बिजली उत्पादन कर जल भण्डारण में कमी कर मध्यप्रदेश और गुजरात के लोगों की जल सुरक्षा को दाँव पर लगा दिया गया है।
आसन्न ग्रीष्म ऋतु और अलनीनो प्रभाव के कारण अगले मानसून में कमी[i] की आशंका के मद्देनज़र भण्डारित जल में कमी करना उचित नहीं है। ऐसा लगता है कि वर्तमान में जारी लोकसभा चुनाव के कारण अतिरिक्त बिजली पैदा करने हेतु जलाशयों को खाली किया जा रहा है जिससे गुजरात के सूखा प्रभावित क्षेत्रों की जल सुरक्षा खतरे में पड़ गई है। आगामी मानसून में बारिश में कमी या देरी से नर्मदा जल पर आश्रित भोपाल और इंदौर जैसे शहरों में भी जल उपलब्धता प्रभावित हो सकती हैं। हाल ही में जोरशोर से प्रारंभ की गई नर्मदा-क्षिप्रा पाईप लाईन योजना भी नर्मदा में पानी की कमी के कारण अनुपयोगी हो सकती है। यह दुःखद है कि गर्मी का मौसम शुरू होने के पहले 27 मार्च को ही सरदार सरोवर में जलभण्डारण घटाकर मात्र 22% कर दिया गया था जबकि पिछले वर्ष पूरे देश में औसत से अधिक बारिश हुई है और मानसून में सरदार सरोवर जलाशय अपने उच्चतम स्तर तक भर गया था।
गुजरात सरकार दावा करती है कि सरदार सरोवर की ऊँचाई नहीं बढ़ाए जाने के कारण उनका राज्य पीड़ित है। लेकिन सरदार सरोवर के पानी के इस कुप्रबंधन से इस दावे की हवा निकल गई है। यदि गुजरात सरकार बाँध की वर्तमान ऊँचाई पर उपलब्ध जलभण्डार का ही महत्तम उपयोग करने में ही सक्षम नहीं है तो फिर बाँध की ऊँचाई बढ़ाने का सवाल ही कहाँ उठता है?
पनबिजली उत्पादन – केन्द्रीय विद्युत प्राधिकरण (http://cea.nic.in/monthly_gen.html) द्वारा जारी इन परियोजनाओं (औंकारेश्वर परियोजना सहित) से फरवरी-मार्च 2014 और 2013 के बिजली उत्पादन के आँकड़े निम्नानुसार है –
| परियोजना/कंपनी | बिजलीघर | फरवरी | मार्च | ||
| 2014 | 2013 | 2014 | 2013 | ||
| सरदार सरोवर परियोजना | नदी तल बिजलीघर | 340.96 | 51.74 | 301.61 | 154.89 |
| नहर मुख बिजलीघर | 48.48 | 17.09 | 44.3 | 47.92 | |
| योग | 389.44 | 68.83 | 345.91 | 202.81 | |
| नर्मदा हाईड्रोइलेक्ट्रिक डेवलपमेंट कार्पोरेशन(एनएचडीसी) | इंदिरा सागर परियोजना | 230.76 | 120.67 | 242.94 | 223.21 |
| औंकारेश्वर जलविद्युत परियोजना | 106.23 | 68.08 | 109.18 | 116.75 | |
| योग | 336.99 | 188.75 | 352.12 | 339.96 | |
| नोट-आँकड़े मिलियन यूनिट में है (एक यूनिट एक किलोवाट घण्टा के बराबर होता है)। सारे आँकड़े केन्द्रीय विद्युत प्राधिकरण की वेबसाईट से लिए गए हैं। मार्च 2014 के आँकड़े अनंतिम है लेकिन पिछले अनुभवों से स्पष्ट है कि अंतिम आँकड़ों में भी कोई खास बदलाव नहीं होता है। नर्मदा हाईड्रोइलेक्ट्रिक डेवलपमेंट कार्पोरेशन (http://www.nhdcindia.com/ )मध्यप्रदेश सरकार और राष्ट्रीय पनबिजली निगम का संयुक्त उपक्रम है। | |||||
उपरोक्त आँकड़ों से स्पष्ट है कि सरदार सरोवर और एनएचडीसी (नर्मदा हाईड्रोइलेक्ट्रिक डेवलपमेंट कार्पोरेशन) के पन बिजलीघरों से पिछले वर्ष के फरवरी-मार्च महीनों की अपेक्षा इस वर्ष के फरवरी-मार्च महीनों में विद्युत उत्पादन काफी अधिक था। सरदार सरोवर परियोजना से फरवरी-मार्च 2014 में 735.35 मिलियन यूनिट बिजली का उत्पादन किया गया जबकि पिछले वर्ष इसी अवधि में 271.64 मिलियन यूनिट था। इस वर्ष बिजली उत्पादन में 171% की भारी वृद्धि की गई है। एनएचडीसी के बिजलीघरों से फरवरी-मार्च 2014 में 689.11 मिलियन यूनिट बिजली उत्पादित की गई जबकि पिछले वर्ष इसी अवधि में 528.71 मिलियन यूनिट बिजली का उत्पादन किया गया था। इस प्रकार पिछले वर्ष की अपेक्षा यहाँ भी 30.33% बिजली उत्पादन बढ़ाया गया है। इस प्रकार स्पष्ट है कि सरदार सरोवर और एनएचडीसी के बिजलीघरों से इस वर्ष फरवरी-मार्च में पानी के भण्डारण की कीमत पर बहुत ज्यादा बिजली उत्पादन बढाया गया है। सरदार सरोवर से उत्पादित बिजली का लाभ मध्यप्रदेश, महाराष्ट्र और गुजरात को क्रमशः 57, 27 और 16% के अनुपात में मिलता है।
हालांकि जलभण्डारण में इस अनुचित कमी के कारण मध्यप्रदेश और गुजरात के लोग तो आगामी गर्मी और मानसून में प्रभावित होने वाले हैं ही लेकिन कुछ तो अभी से प्रभावित हो चुके हैं।[ii] सरदार सरोवर जलाशय के स्तर में अचानक कमी कर दिए जाने से बड़वानी की जलप्रदाय व्यवस्था बुरी तरह प्रभावित हुई है। बिजली की कटौती के कारण वैकल्पिक व्यवस्था में भी परेशानी आ रही है। सरदार सरोवर परियोजना और एनएचडीसी द्वारा भारी मात्रा में उत्पादित बिजली का लाभ भी बड़वानी जैसे छोटे कस्बों को नहीं मिल रहा है। लगता है आगे आने वाले दिन और अधिक मुश्किलों भरे होंगें। फरवरी-मार्च महीने में बिजली की माँग और राष्ट्रीय स्तर पर इसकी दरें गर्मी के दिनों के मुकाबले काफी कम होती है। यहाँ यह उल्लेखनीय है कि खेती में बिजली की माँग अभी तक शुरू नहीं हुई है। कपास की अगेती फसल (early crop)की बुआई मई के पहले सप्ताह से शुरू होती है और पानी की उपलब्धता के आधार पर जून के पहले सप्ताह तक चलती है। ऐसे में सवाल उठता है कि माँग और दरों में कमी के दौर में बिजली का भारी उत्पादन कौनसी बुद्धिमानी है?
राष्ट्रीय स्तर पर जलाशयों में भण्डारण – केन्द्रीय जल आयोग अपने साप्ताहिक बुलेटिन के माध्यम से राष्ट्रीय स्तर पर 85 जलाशयों (इनमें से 37 जलाशयों, जिनकी भण्डारण क्षमता 111.73 करोड़ घनमीटर है, में 60 मेगावाट से अधिक का पनबिजली घटक भी शामिल है।) के भण्डारण की स्थिति के बारे में जानकारी उपलब्ध करवाता है जिनकी कुल भण्डरण क्षमता 155.05 करोड़ घनमीटर है। 6 मार्च 2014 को इन जलाशयों में 88.934 करोड़ घनमीटर यानी कुल भण्डारण का 57% उपलब्ध था। लेकिन 9 अप्रैल आते तक भण्डरण मात्र 59.581 करोड़ घनमीटर यानी कुल भण्डारण का 38% ही बचा था। उम्मीद है कि ये इन जलाशयों का भण्डारण अब और चुनावी फायदों के लिए घटाया नहीं जाएगा।
ऐसा पहली बार नहीं हुआ – चुनावी लाभ के लिए ऐसा पहली बार नहीं हुआ है।[iii] वर्ष 2004 और 2009 के आम चुनावों के दौरान भी अतिरिक्त बिजली उत्पादन के लिए अनुचित तरीके से जलाशयों को खाली किया गया था और अगले मानसून में कमी के कारण लोगों को इसका खामियाजा भुगतना पड़ा था। नर्मदा पर बने बाँधों के मामले में जलस्तर का नियमन राज्य सरकारें, नर्मदा नियंत्रण प्राधिकरण और केन्द्रीय जल संसाधन मंत्रालय द्वारा किया जाता है। अन्य बाँधों के मामले में केन्द्रीय जल आयोग भी जिम्मेदार होता है।
अधिक पारदर्शी, जवाबदेह और सहभागी जलाशय प्रबंधन, जो भारत में नदारद है, का बारंबार उठने वाला सवाल यहाँ फिर उठता है। जब तक व्यवस्था में सुधार नहीं होता राजनेता जलाशयों के पानी का अपने एजेण्डे के अनुसार उपयोग करते रहेंगें और आम देशवासी और देश की अर्थव्यवस्था इसकी कीमत चुकाने को मजबूर रहेंगें।
– रेहमत (मंथन अध्ययन केन्द्र, बड़वानी, R9300833001@gmail.com, 09300833001)
– हिमांशु ठक्कर (दक्षिण एशियाई बाँधों, नदियों और लोगों का नेटवर्क, दिल्ली ht.sandrp@gmail.com, 09968242798)
टिप्पणियाँ
[i] इकॉनॉमिक टाईम्स, 9 अप्रैल 2014: http://articles.economictimes.indiatimes.com/2014-04-09/news/49000001_1_excess-rainfall-monsoon-forecast-normal-rainfall
[ii] दैनिक भास्कर, 9अप्रैल 2014: http://epaper.bhaskar.com/detail/?id=546908&boxid=4902654906&ch=mpcg&map=map¤tTab=tabs-1&pagedate=04/09/2014&editioncode=363&pageno=1&view=image
[iii] उदाहरण के लिए भाखड़ा बाँध के जलाशय का भण्डारण वर्ष 2012 की गर्मी में जिस तरह से घटाया गया उसके असर आगामी मानसून में दिखाई दिए : https://sandrp.in/dams/PR_Why_precarious_water_situation_at_Bhakra_dams_was_avoidable_July_2012.pdf

Insider view: BBMB is inefficient, slow, heavy, bureaucratic; Does not work to preserve its massive resources
Bhakra Beas Management Board (BBMB, http://bbmb.gov.in/english/index.asp) is the manager of India’s celebrated icons: Temples of Modern India as our first Prime Minister called it. In a rare occasion, when we get a candid account of insider’s view of this organisation, it is worth taking note of it.
Bhakhra Dam: Photo from BBMB
BBMB, created on Oct 1, 1967, has current annual budget of massive Rs 1000 crores and manages the Bhakra Nangal Project, the Beas Project I (Pandoh dam, the Beas Sutlej Link and the Dehar Power House) and the Beas Project II (Beas Dam and Pong power houses). With close to 3000 MW of installed capacity it generates about 12.5 billion units of power annually.
Mr Satish Loomba, who served as Financial Advisor to BBMB between 1996 and 2001 has just provided an interesting view about the functioning of BBMB in his article Need to corporatise BBMB in The Tribune of January 23, 2014: http://www.tribuneindia.com/2014/20140123/edit.htm#6. While the author, as the title suggests, is advocating a corporate restructuring of BBMB, what he has said in the process provides a valuable insights from an insider. Here are some snippets:
Þ “This organisation, which has become heavy, slow and bureaucratic…”
Þ “However, despite a façade of running smoothly, the BBMB, from the organizational standpoint, suffers from several infirmities, limitations and internal contradictions.”
Þ “At the core of the inadequacies in the BBMB are the… systems which do not promote efficiency, cost control and long term health of its vast assets… It has no concern with the value of its output…”
Þ “… capital of the BBMB is not being preserved in accordance with accepted principles…” In fact in recent years, the illegal dumping of humungous quantities of muck (even a 100 MW project creates several million meter cube of muck) by the numerous major, medium and small hydropower projects in upstream Sutlej (see: https://sandrp.in/basin_maps/Hydro_Electric_Projects_on_Sutlej_River_in%20HP.pdf) and Beas (see: https://sandrp.in/basin_maps/Hydropower_Projects_in_Beas_Basin.pdf) basins is leading to accelerated silting up of the Bhakra, Pong and Pandoh reservoirs, but no one, not even BBMB has shown the slightest concern.
Þ “For the ageing irrigation wing assets, which are colossal and could be in sudden need of massive recapitalization…”
Þ “… there is no account which summarises its results for a specific time period…”
This is a very serious indictment, not only of BBMB but also the way the “icons” of India are being managed by an organisation controlled by the Union Ministry of Power. Are these remediable infirmities or are these the implications of the kind and size of structures that BBMB manages? The author of the above article does not even pose this question, but is a very relevant one.
Declining Hydropower generation As per our analysis of hydropower generation from the three BBMB projects in Himachal Pradesh, namely Bhakra (1325 MW), Dehar (990 MW) and Pong (396 MW), with total installed capacity of 2711 MW, the generation per MW installed capacity has shown hugely declining trend with trend line declining by 18-20% in less than three decades. We also have graphs of individual BBMB hydropower projects that show similar trend line. This is a massive decline and in any responsible governance, questions would be asked as to why this is happening, but here, there are no questions.

Unravelling Bhakra In a comprehensive critique Unravelling Bhakra, (see: http://www.manthan-india.org/spip.php?rubrique1, available in both English and Hindi), author Shripad Dharmadhikary has shown that it is a myth to assume that Bhakra dams were the only or major reasons behind India’s food security, green revolution or irrigation in North West India. He has shown with facts and figures that are yet to be proven wrong that the contribution of Bhakra dams was limited.

Displaced people still awaiting justice Over five decades after commissioning of the Bhakra project, the people displaced by this most celebrated of Indian dams are still awaiting justice, as is clear from this latest news report (http://www.tribuneindia.com/2014/20140120/haryana.htm#10) in January 2014. This has been highlighted by many in the past including Govt of India’s Water Resources Minister in his autobiography, by SANDRP in 2002, by Shripad Dharmadhikary in above mentioned book and continuous media coverage. This also shows the callous attitude of BBMB and concerned state and central governments.
Ad hoc, callous reservoir operation It is no secret that even this irrigation system is in bad and declining health. This is due to many reasons, including due to lack of maintenance and participatory governance. Several times it has been pointed out how unaccountable and inefficient has been the operation of the Bhakra reservoirs. Two recent occasions when SANDRP pointed this out include the following:
Þ July 2012: Precarious situation of Bhakra dams: BBMB says emergency measures are imminent: Callous, ad-hoc reservoir operation again? Could this situation have been avoided? https://sandrp.in/dams/PR_Why_precarious_water_situation_at_Bhakra_dams_was_avoidable_July_2012.pdf
Þ Sept 2010: Bhakra reservoir is being operated in casual, adhoc manner? Need for clearly defined norms of accountability in reservoir operations https://sandrp.in/dams/Bhakra_and_Need_for_accountability_in_Reservoir_Operations_Sept_19_2010.pdf
Þ With general elections approaching in coming April May 2014, we have to wait and see if the Bhakra reservoirs will again be operated in an ad hoc manner like it happened before previous two national elections.
We hope right lessons will be learnt from this insider’s view of the alarmingly inadequate functioning of the BBMB and efforts will be made to make its functioning more participatory, transparent and accountable.
Himanshu Thakkar (ht.sandrp@gmail.com)
