
At least 49 large[1] hydropower projects are under construction in India today, with a cumulative capacity of 15006 MW[2]. As per the latest bulletin from Central Electricity Authority[3], “Status of Hydro Electric Projects under Execution for 12th Plan & beyond (Excluding projects above[4] 25 MW)” dated March 31, 2014, 35 of these projects (9934 MW) are expected to be commissioned in 12th Five Year Plan[5] and remaining 14 with installed capacity of 5072 MW would provide benefit beyond 12th Plan.
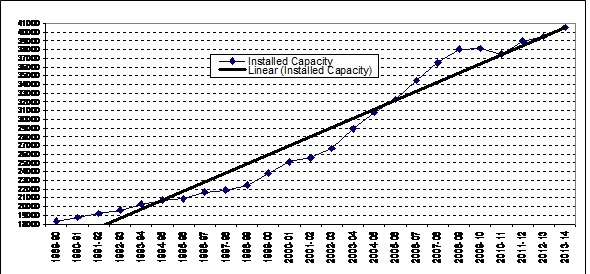
Considering that 1534 MW capacity has already been added in first two years of ongoing 12th Five Year Plan (during 2012-13 and 2013-14), CEA projections means that India hopes to add massive 11468 MW capacity during the current five year plan. This will be higher than capacity added in any other five year plan and 254% of the capacity addition during the last, 11th Five Year Plan (2007-12) when India added 4514 MW. The graph below shows how steeply our hydropower installed capacity is going up over the last 25 years.
The proponent of even more accelerated hydro capacity addition misleadingly talk about the need for having 40% of installed grid capacity as hydro.
In line with this, the CEA came out with plans to add 65000 MW in 13th Five Year Plan (2017-2022: 30 000 MW) and 14th Five Year Plan (2022-2027: 35 000 MW). (see http://www.energylineindia.com/ of May 6, 2014)
There is no science behind this advocacy. It is basically a suggestion possibly based on the general assumption that peaking demand is 40% higher than base-load demand. Hence if we have 40% installed capacity from hydro in the grid, this can take care of total demand optimally. However, this is based on assumption that hydro capacity is indeed used for peaking. This assumption is completely wrong in India, with no agency monitoring or even reporting how much of the hydro generation currently provide peaking power. Without such optimum use of current hydro capacity, where is the case for 60:40 grid capacity ratio for hydro? It goes without saying that when hydro projects are used for peaking power, there are additional social and environmental impacts in the downstream and upstream. These need to assessed and those who suffer are compensated.
On similar lines, one can answer the advocacy for claim that hydro is clean, green, renewable and cheap source of power or that run of the river or small hydropower projects are more environmentally benign. However, this blog is not attempting to answer all such fallacies here, it needs a separate blog.
While this is happening, the Expert Appraisal Committee of Union Ministry of Environment and Forests on River Valley Projects has been clearing projects at break a neck speed with almost zero rejection rate. Between April 2007 and Dec 2013, this committee recommended environment clearance to 18030.5 MW capacity, most of which has not entered the implementation stage. Moreover, this committee has recommended 1st Environment clearance (what is technically called Terms of Reference Clearance) for a capacity of unimaginable 57702 MW in the same period. This is indicative of the onslaught of hydropower projects which we are likely to see in the coming years.

Table: Sector-wise & plan-wise number of & capacity of under construction HEPs
| Sector |
During 12th FYP |
After 12th Plan |
Total |
|||
| No of Projects | Installed capacity, MW | No of Projects | Installed capacity, MW | No of Projects | Installed capacity, MW | |
| Central |
11[6] |
5312 | 3 | 2615 | 14 |
7927 |
| State |
12 |
1506 | 3 | 736 | 15 |
2242 |
| Pvt |
12 |
3116 | 8 | 1721 | 20 |
4837 |
| Total |
35 |
9934 | 14 | 5072 | 49 |
15006 |
Among the three sectors, the largest number of under construction projects (20) are from private sector. However, among all sectors of under construction projects, central sector projects have the highest installed capacity (7927 or 53% of under construction capacity of 15006 MW).

Vulnerable Himalayas are the target In the second table the state-wise and sector-wise break of numbers and capacity of under construction HEPs has been given. Himachal Pradesh has the highest number and highest installed capacity projects among all states. That state also has the highest installed capacity (8139 MW or over a fifth of operating HEP capacity at national level) of large operating hydropower projects. Sikkim, however, has the highest number and capacity of private sector hydropower projects under construction. In fact, half of the total national-level private sector projects which are under construction are in that tiny state. Their installed capacity is more than half the installed capacity of all the private sector hydropower projects under construction at national level. Ironically, the state also has the highest biodiversity in the country.

Himachal Pradesh and Uttarakhand also have 5 and 3 private sector HEPs under construction respectively. The 5 Himalayan states of Jammu & Kashmir (J&K), Himachal Pradesh, Uttarakhand, Sikkim and Arunachal Pradesh between them have 38 of the 49 under construction hydropower projects with total capacity of 13550 MW or over 90% of under construction capacity. In addition, the projects of Mizoram, Meghalaya, W Bengal (Teesta L Dam IV) and Punjab (Shahpur Kandi on Ravi River) are also in Himalayan zone.
Table: State-wise & sector-wise number and capacity of under-construction HEPs
| State |
Central Sector |
State Sector | Private Sector |
Total |
||||
| No of projects | Installed Capacity, MW | No of projects | Installed Capacity, MW | No of projects | Installed Capacity, MW | No of projects | Installed Capacity, MW | |
| J&K |
1 |
330 | 1 | 450 | 1 | 850 | 3 |
1630 |
| Himachal P |
4 |
2532 | 6 | 956 | 5 | 460 | 15 |
3948 |
| Uttarakhand |
4 |
2135 | – | – | 3 | 505 | 7 |
2640 |
| Sikkim |
– |
– | – | – | 10 | 2622 | 10 |
2622 |
| Arunachal P |
3 |
2710 | – | – | – | – | 3 |
2710 |
| Mizoram |
1 |
60 | – | – | – | – | 1 |
60 |
| Meghalaya |
– |
– | 1 | 40 | – | – | 1 |
40 |
| W Bengal |
1 |
160 | – | – | – | – | 1 |
160 |
| Punjab |
– |
– | 1 | 206 | – | – | 1 |
206 |
| Madhya Pr |
– |
– | – | – | 1 | 400 | 1 |
400 |
| Maharashtra |
– |
– | 1 | 80 | – | – | 1 |
80 |
| Andhra Pr |
– |
– | 3 | 410 | – | – | 3 |
410 |
| Kerala |
– |
– | 2 | 100 | – | – | 2 |
100 |
| Total |
14 |
7927 | 15 | 2242 | 20 | 4837 | 49 |
15006 |


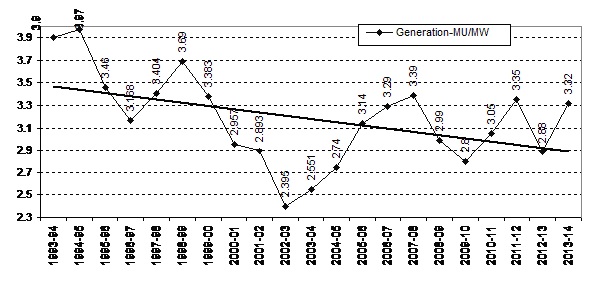
Diminishing Returns This blind rush for hydropower projects (which have serious and irreversible impacts on social and ecological systems) is difficult to understand and justify considering their poor generation performance, rising costs and availability of better options. To illustrate, in the graph below we can see how power generation per unit (MW) installed capacity has been steadily reducing over the last two decades. From 1993-94 to the latest year of 2013-14, there has been a huge drop of 16.5%.
Yawning gap between promised and actual generation of Hydro Projects Another way to look at performance of hydropower projects would be to compare the projected (as promised in Techno Economic Clearance) and actual generation (both at 90% dependability) of electricity by HEPs. This assessment shows that about 89% of India’s operating hydropower projects are generating at below the promised levels. Shockingly, half of under performing projects are generating at below 50% of promised generation levels.
How much Peaking Power are we generating? A third way to assess the hydropower generation is in terms of peaking power, a USP[7] of hydropower projects. However, no figures are available as to how much of the generation from hydropower projects are happening during peaking hours. No agency in India is even monitoring this or reporting this: including CEA, Central or State Electricity Regulatory Authority, National, Regional or State Load Dispatch Centers, Union or state Power Ministries or individual operators. In short, there is no case for justifying more hydro in the name of providing peaking power if we are neither monitoring nor optimizing hydropower generation during peaking hours. One expected CEA to do this job, but it seems they are busy lobbying for hydropower projects rather than functioning as India’s premier Technical Power sector agency.
Invitation to disaster? The consequences of such massive capacity addition are and will continue to be disastrous for the rivers, forests, biodiversity and people. The Uttarakhand disaster of June 2013 has shown the vulnerability of hydropower projects in Himalayas, as well as their impacts. The disaster and independent reports[8] also show how the construction and operation of these projects have contributed to compounding the proportion of the disaster. Climate Change is accentuating this situation and will continue to do so with increasing intensity as per the IPCC reports.
Role of HEPs in Uttarakhand disaster: CEA and CWC in denial mode This analysis of under construction hydropower projects as reported in the latest CEA bulletin shows that Himalayas is the target for overwhelming majority of hydropower projects being taken up India (& neighbouring countries like Bhutan, Nepal, Pakistan and Tibet). The Uttarakhand disaster showed how hydropower projects are increasing the existing vulnerabilities and disaster potential of the Himalayan region in times of natural calamities. An independent committee appointed by MoEF following Supreme Court orders of Aug 13, 2013 pointed out the role of hydropower projects in Uttarakhad disaster of June 2013.
It should be highlighted here that multiple hydropower projects should invite cumulative impact assessment. As Supreme Court order of Aug 13, 2013 highlighted, such cumulative impact assessment need to be done in a credible way and not the way AHEC of IITR did for the Bhagirathi-Alaknanda basin.
Strangely, instead of accepting this reality and taking this into account in decision making processes, Central Water Commission and Central Electricity Authority are in a denial mode! They collectively submitted a completely unscientific and unfounded report to Union Environment & Forests Ministry, advocating for hydropower projects rather than assessing their role in disaster, which was the mandate given by Supreme Court of India to MoEF. The CEA is clearly jeopardizing whatever credibility it has in joining hands with CWC. It would be better for both the agencies to accept and wake up to these realities.
Else, such onslaught of hydropower projects on Himalayas is likely to be an invitation to further disasters all across the Himalayas. All our decision makers and all others concerned need to take note of this urgently.
Himanshu Thakkar (ht.sandrp@gmail.com)
END NOTES:
[1] Defined as those projects having installed capacity above 25 MW
[2] In reality, there are many other large HEPs under construction, but his figure is based on CEA.
[3] http://cea.nic.in/reports/proj_mon/status_he_execution.pdf, CEA has been pretty irregular in putting up these bulletins, after Nov 2013, the next bulletin was available only now.
[4] In reality, this should be “below”, we have italicized the word since the error is in the original.
[5] Ending on March 31, 2017
[6] CEA projects that out of 2000 MW installed capacity of Lower Subansiri HEP in Arunachal Pradesh, 1000 MW will be commissioned in 12th Plan and the rest of 1000 MW thereafter.
[7] Unique Selling Proposition
