Climate Change · Dams · Hydropower

Dams are not Climate Friendly: Readings from IPCC WG II Report

Inter-governmental Panel on Climate Change’s (IPCC) Fifth Assessment is falling into place. On the 31st March 2014, the report titled ‘Climate Change 2014: Impacts, Adaptation, and Vulnerability’, from Working Group II[1] was issued in Yokohoma, Japan. Working Group II assesses “the vulnerability of socio-economic and natural systems to climate change, negative and positive consequences of climate change, and options for adapting to it. It also takes into consideration the inter-relationship between vulnerability, adaptation and sustainable development.”[2]

This can be called as one of the more incisive Working Group Reports from IPCC. It states unequivocally that the effects of climate change are already occurring on all continents and across the oceans and world is ill-prepared for risks from a changing climate. According to Co-Chair of Working Group II, Chris Field, “The report concludes that people, societies, and ecosystems are vulnerable around the world, but with different vulnerability in different places. Climate change often interacts with other stresses to increase risk”.[3]

The report consists of two volumes. First volume contains a Summary for Policymakers, Technical Summary, and 20 chapters assessing risks by sector and opportunities for response. The sectors include freshwater resources, terrestrial and ocean ecosystems, coasts, food, urban and rural areas, energy and industry, human health and security, and livelihoods and poverty. A second volume of 10 chapters assesses risks and opportunities for response by region. These regions include Africa, Europe, Asia, Australasia, North America, Central and South America, Polar Regions, Small Islands, and the Ocean.

The summary for policymakers paints a sombre picture: “Climate change over the 21st century is projected to reduce renewable surface water and groundwater resources significantly in most dry subtropical regions, intensifying competition for water among sectors. In presently dry regions, drought frequency will likely increase by the end of the 21st century under RCP8.5. In contrast, water resources are projected to increase at high latitudes. Climate change is projected to reduce raw water quality and pose risks to drinking water quality even with conventional treatment, due to interacting factors: increased temperature; increased sediment, nutrient, and pollutant loadings from heavy rainfall; increased concentration of pollutants during droughts; and disruption of treatment facilities during floods. Adaptive water management techniques, including scenario planning, learning-based approaches, and flexible and low-regret solutions, can help create resilience to uncertain hydrological changes and impacts due to climate change.”

“Risks are unevenly distributed and are generally greater for disadvantaged people and communities in countries at all levels of development.”

Links with water

Being an integral and cross cutting issue, water features prominently in all of Chapters of the Working Group Report. Sections on Freshwater Resources, Costal systems and low lying areas, Food Security, Inland systems, etc. include important findings. It is significant to note that dams, hydropower projects, infrastructure measures like channelization, embankments, etc., are also mentioned in nearly all the chapters of the report. Couple of references indicate dams as a possible adaptation measure, but overwhelming references point to the contrary.

The collective picture that is arising through these reference is very important. A collation and analysis of all specific references to water infrastructure projects, read in tandem with the report indicates that: 

1. Dams and infrastructure projects contribute significantly to “non-climate impacts” which, after interacting with changing climate, exacerbate the overall impact on human societies and ecosystems

o   Sediment Trapping by reservoirs, exacerbates impact of  sea level rise

o   Hydropower affects local options

o   Climate  change and dams together affect a greater eco-region

o   Increased flow fluctuations by dams exacerbate through climate change

2. In case of Flood Protection, dams and embankments may do more harm than good. Ecological measures would fare better.

3. Dams and Hydropower projects affect biodiversity, which is critical in facing climate change challenges.

4. In the tropics, global warming potential of hydropower may exceed that of Thermal Power

5. Dams increase vulnerability of weaker sections to climate change

6. Existing Dams have to be managed sustainably, with ecological considerations

7. Hydropower itself is vulnerable to Climate Change

~~~

The references used in WG II report are peer reviewed research from several authors.The specific references given below will play an important role in debunking the simplistic myth that dams and hydropower projects are climate friendly and can be considered as de facto adaptation measures to cope with Climate Change.

Some Relevant Extracts from Working Group II Report:

  1. Dams and infrastructure projects contribute significantly to “non-climate impacts” which, after interacting with climate impacts, exacerbate the overall impact of climate change on human societies and ecosystems 
  • Sediment Trapping by reservoirs, exacerbates impact of  sea level rise

“Most large deltas in Asia are sinking (as a result of groundwater withdrawal, floodplain engineering, and trapping of sediments by dams) much faster than global sea-level is rising.” (Chapter 24: Asia)

“Human activities in drainage basins and coastal plains have impacted the coastal zone by changing the delivery of sediment to the coast. Sediment trapping behind dams, water diversion for irrigation, and sand and gravel mining in river channels all contribute to decrease sediment delivery, whereas soil erosion due to land-use changes help increase it. It is estimated that the global discharge of riverine sediment was 16-–19 Gt/ yr in the 1950s before widespread dam construction and it has decreased to 12–13 Gt/ yr. Out of 145 major rivers with mostly more than 25-year record, only 7 showed evidence of an increase in sediment flux while 68 showed significant downward trends. The number of dams has increased continuously and their distribution has expanded globally. As of early 2011, the world has an estimated 16.7 million reservoirs larger than 0.01 ha. Globally, 34 rivers with drainage basins of 19 million km2 in total show a 75% reduction in sediment discharge over the past 50 years. Reservoir trapping of sediments is estimated globally as 3.6 Gt/ yr to more than 5 Gt/ yr (Syvitski et al., 2005; Walling, 2012; Milliman and Farnsworth, 2011). Human pressure is the main driver of the observed declining trend in sediment delivery to the coastline.(Chapter 5 Coastal systems and Low Lying areas)

“Attributing shoreline changes to climate change is still difficult due to the multiple natural and anthropogenic drivers contributing to coastal erosion.” (Chapter 5 Coastal systems and low lying areas)

“The combined impact of sediment reduction, relative sea level rise, land-use changes in delta and river management on channels and banks has led to the widespread degradation of deltas. The changes of sediment delivery from rivers due to dams, irrigation and embankments/dykes creates an imbalance in sediment budget in the coastal zones. Degradation of beaches, mangroves, tidal flats, and subaqueous delta fronts along deltaic coasts has been reported in many deltas (e.g. Nile and Ebro, Sanchez-Arcilla et al., 1998; Po, Simeoni and Corbau, 2009; Krishna-Godavari, Nageswara Rao et al., 2010; Changjiang, Yang et al., 2011; Huanghe, Chu et al., 1996; very high confidence). Deltaic coasts naturally evolve by seaward migration of the shoreline, forming a delta plain. However, decreasing sediment discharge during the last 50 years has decreased the growth of deltaic land, even reversing it in some locations (e.g. Nile, Godavari, Huanghe). Artificial reinforcement of natural levees also has reduced the inter-distributory basin sedimentation in most deltas, resulting in wetland loss.” (Emphasis added.)

“The major impacts of sea level rise are changes in coastal wetlands, increased coastal flooding, increased coastal erosion, and saltwater intrusion into estuaries and deltas, which are exacerbated by increased human-induced drivers. Ground subsidence amplifies these hazards in farms and cities on deltaic plains through relative sea level rise. Relative sea level rise due to subsidence has induced wetland loss and shoreline retreat (e.g. the Mississippi delta, Morton et al., 2005; Chao Phraya delta, Saito et al., 2007; high confidence).” (Chapter 5 Coastal systems and low lying areas)

“There have been local variations in precipitation and runoff since 1950, but changes in sediment load are primarily attributed to over 50,000 dams and vegetation changes.”  (Chapter 18: Detection and attribution of observed impacts)

  • Hydropower affects local options

“Hydropower dams along the Mekong River and its tributaries will also have severe impacts on fish productivity and biodiversity, by blocking critical fish migration routes, altering the habitat of non-migratory fish species, and reducing nutrient flows downstream. Climate impacts, though less severe than the impact of dams, will exacerbate these changes.”(Chapter 24: Asia)

  • Climate  change and dams together affect a greater eco-region

“For one climate scenario, 15% of the global land area may be negatively affected, by the 2050s, by a decrease of fish species in the upstream basin of more than 10%, as compared to only 10% of the land area that has already suffered from such decreases due to water withdrawals and dams (Döll and Zhang, 2010). Climate change may exacerbate the negative impacts of dams for freshwater ecosystems.” (Chapter 3: Freshwater resources)

  1. Flood Protection: Dams and embankments may do more harm than good. Ecological measures fare better.
  • “On rivers and coasts, the use of hard defences (e.g. sea-walls, channelization, bunds, dams) to protect agriculture and human settlements from flooding may have negative consequences for both natural ecosystems and carbon sequestration by preventing natural adjustments to changing conditions. Conversely, setting aside landward buffer zones along coasts and rivers would be positive for both. The very high carbon sequestration potential of the organic-rich soils in mangroves and peat swamp forests provides opportunities for combining adaptation with mitigation through restoration of degraded areas.” (Chapter 3 Freshwater Resources)
  • “Ecosystem based adaptation (EBA) can be combined with, or even a substitute for, the use of engineered infrastructure or other technological approaches. Engineered defenses such as dams, sea walls and levees adversely affect biodiversity, potentially resulting in maladaptation due to damage to ecosystem regulating services. There is some evidence that the restoration and use of ecosystem services may reduce or delay the need for these engineering solutions. EBA offers lower risk of maladaptation than engineering solutions in that their application is more flexible and responsive to unanticipated environmental changes. Well-integrated EBA can be more cost effective and sustainable than non-integrated physical engineering approaches (Jones et al., 2012), and may contribute to achieving sustainable development goals (e.g., poverty reduction, sustainable environmental management, and even mitigation objectives), especially when they are integrated with sound ecosystem management approaches.” (Chapter 3 and Also Chapter 15 Adaptation Planning and Implementation)
  1. Dams and Hydropower projects affect biodiversity, which is critical in facing climate change challenges
  • “Freshwater ecosystems are considered to be among the most threatened on the planet. Fragmentation of rivers by dams and the alteration of natural flow regimes have led to major impacts on freshwater biota.” (Chapter 4: Terrestrial and Inland Water Systems)
  • “Damming of river systems for hydropower can cause fragmentation of the inland water habitat with implications for fish species.” (Chapter 4 Terrestrial and Inland Water Systems)
  •  “Freshwater ecosystems are also affected by water quality changes induced by climate change, and by human adaptations to climate-change induced increases of streamflow variability and flood risk, such as the construction of dykes and dams”. (Chapter 3: Freshwater resources)
  • “Hydropower generation leads to alteration of river flow regimes that negatively affect freshwater ecosystems, in particular biodiversity and abundance of riverine organisms, and to fragmentation of river channels by dams, with negative impacts on migratory species. (Chapter 3: Freshwater Resources)
  • “Hydropower operations often lead to discharge changes on hourly timescales that are detrimental to the downstream river ecosystem.”
  • “Climate change and habitat modification (e.g., dams and obstructions) impact fish species such as salmon and eels that pass through estuaries.” (Chapter 5 Coastal Systems and low lying areas)
  1. In Tropics, global warming potential of hydropower may exceed Thermal Power
  • “In tropical regions, the global warming potential of hydropower, due to methane emissions from man-made reservoirs, may exceed that of thermal power; based on observed emissions of a tropical reservoir, this might be the case where the ratio of hydropower generated to the surface area of the reservoir is less than 1 MW/km2”.
  • “Reservoirs can be a sink of CO2 but also a source of biogenic CO2 and CH4” (Chapter 4 Terrestrial and Inland Systems)
  1. Dams increase vulnerability of weaker sections to climate change
  • “A number of studies recognize that not every possible response to climate change is consistent with sustainable development, since some strategies and actions may have negative impacts on the well-being of others and of future generations .For example, in central Vietnam some responses to climate change impact, such as building dams to prevent flooding and saltwater intrusion and to generate power, threaten the livelihood of poor communities. First, the relocation of communities and the inundation of forestland to build dams limit households’ access to land and forest products. Second, a government focus on irrigated rice agriculture can reduce poor households’ ability to diversify their income portfolio, decreasing their long-term adaptive capacity. Indeed, the consequences of responses to climate change, whether related to mitigation or adaptation, can negatively influence future vulnerability, unless there is awareness of and response to these interactions. Here, the role of values in responding to climate change becomes important from a variety of perspectives, including intergenerational, particularly when those currently in positions of power and authority assume that their prioritized values will be shared by future generations. (Chapter 20: Climate-resilient pathways: adaptation, mitigation, and sustainable development)
  •  “Some documented impacts on dams, reservoirs and irrigation infrastructure are: reduction of sediment load due to reductions in flows (associated with lower precipitation), positively affecting infrastructure operation (Wang et al., 2007); impacts of climate variability and change on storage capacity that creates further vulnerability; and failures in the reliability of water allocation systems (based on water use rights) due to reductions of streamflows under future climate scenarios” (Chapter 9: Rural Areas)
  • “Infrastructure (e.g. roads, buildings, dams and irrigation systems) will be affected by extreme events associated with climate change. These climate impacts may contribute to migration away from rural areas, though rural migration already exists in many different forms for many non-climate-related reasons.” (Chapter 9 Rural Areas)
  • “Changes in water use, including increased water diversion and development to meet increasing water demand, and increased dam building will also have implications for inland fisheries and aquaculture, and therefore for the people dependent on them” .
  • “In the case of the Mekong River basin, a large proportion of the 60 million inhabitants are dependent in some way on fisheries and aquaculture which will be seriously impacted by human population growth, flood mitigation, increased offtake of water, changes in land use and overfishing, as well as by climate change. Ficke et al. (2007) reported that at that time there were 46 large dams planned or already under construction in the Yangtze River basin, the completion of which would have detrimental effects on those dependent on fish for subsistence and recreation.” (Chapter 7 Food security and food production systems)
  1. Existing Dams have to be managed sustainably, with ecological considerations:
  • “Suggested strategies for maximizing the adaptive capacity of ecosystems include reducing non-climate impacts, maximizing landscape connectivity, and protecting ‘refugia’ where climate change is expected to be less than the regional mean. Additional options for inland waters include operating dams to maintain environmental flows for biodiversity, protecting catchments, and preserving river floodplains.” (Chapter 24:Asia )
  1. Hydropower itself is vulnerable to Climate Change
  • “Climate change affects hydropower generation through changes in the mean annual stream-flow, shifts of seasonal flows and increases of stream-flow variability (including floods and droughts) as well as by increased evaporation from reservoirs and changes in sediment fluxes. Therefore, the impact of climate change on a specific hydropower plant will depend on the local change of these hydro-logical characteristics, as well as on the type of hydropower plant and on the (seasonal) energy demand, which will itself be affected by climate change”
  • “Projections of future hydropower generation are subject to the uncertainty of projected precipitation and stream-flow. In regions with high electricity demand for summertime cooling, this seasonal stream-flow shift is detrimental. In general, climate change requires adaptation of operating rules which may, however, be constrained by reservoir capacity. Storage capacity expansion would help increase hydropower generation but might not be cost-effective.”
  • “Observations and models suggest that global warming impacts on glacier and snow-fed streams and rivers will pass through two contrasting phases. In the first phase, when river discharge is increased due to intensified melting, the overall diversity and abundance of species may increase. However, changes in water temperature and stream-flow may have negative impacts on narrow range endemics. In the second phase, when snowfields melt early and glaciers have shrunken to the point that late-summer stream flow is reduced, broad negative impacts are foreseen, with species diversity rapidly declining once a critical threshold of roughly 50% glacial cover is crossed.” (Chapter 3 Freshwater Resources)

Let us hope that these collated finding will be helpful in addressing the myth that dams and hydropower projects are climate friendly and can even be looked at as adaptation measures. Let us also hope that the Working Group III Report, which will come out in less than a week’s time from now, will have lessons for hydropower development in line with the above statements in the WG II report.

Issues with WG III, Special Report on Renewable Energy

Findings of WG II contrast strikingly with Special Report on Renewable Energy Sources and Climate Change Mitigation (SRREN) [4]brought out by Working Group III in 2011.

SRREOne of the two lead coordinating authors of this report was Dr. Arun Kumar, from AHEC, IIT Roorkee. Notably, Dr. Kumar was also a part of the team which worked on Cumulative Impact Assessment of Hydropower projects in Upper Ganga basin of Uttarakhand[5]. The state suffered huge flood and precipitation damages in June 2013 (long after the report came out) and commissioned and under–construction hydropower projects had a large role to play in compounding the impacts of the disaster[6]. Ministry of Environment and Forests as well as the Supreme Court of India rejected this report. SANDRP had published a detailed critique of this CIA report at the outset.

Amazingly, the Hydropower Section of the above mentioned IPCC Special Report on Renewable Energy severely downplays and ignores the impacts of hydropower. For example, it does not allude to peoples protests to projects, impacts of projects by blasting and tunneling, downstream impacts, impacts of peaking, associated deforestation and related development, cumulative impacts of projects in a cascade, increasing climate vulnerability of the population, seismic impacts, increased disaster vulnerability of the region, etc.,. In fact, these impacts have been some of the most-discussed issues in hydropower discourse in many countries at the moment. The report makes strange statements like “trans-boundary hydropower establishes arena for international cooperation”, when we see across the world that hydropower projects on internationally shared rivers further conflicts and strife between nations. It also downplays methane emissions from hydropower.

In all, the section appears biased towards hydropower and does not do justice to IPCC’s rigorous and objective standards. The section should not have been accepted as it stands now.

Now, the Working Group III is yet to submit its Assessment Report to the IPCC. It will be discussed by the IPCC between 7-11 April 2014, in Berlin. We hope there is true depiction of hydropower in the Working Group III report, looking at the above mentioned impacts and also keeping in mind strong statements from Working Group II report made public on March 31, 2014.

Parineeta Dandekar, parineeta.dandekar@gmail.com

~~~


[1] The IPCC Working Group I (WG I) assesses the physical scientific aspects of the climate system and climate change. Working Group II (WG II) assesses the vulnerability of socio-economic and natural systems to climate change, negative and positive consequences of climate change, and options for adapting to it. It also takes into consideration the inter-relationship between vulnerability, adaptation and sustainable development. The assessed information is considered by sectors (water resources; ecosystems; food & forests; coastal systems; industry; human health) and regions (Africa; Asia; Australia & New Zealand; Europe; Latin America; North America; Polar Regions; Small Islands). The IPCC Working Group III (WG III) assesses options for mitigating climate change through limiting or preventing greenhouse gas emissions and enhancing activities that remove them from the atmosphere. (https://www.ipcc.ch/working_groups/working_groups.shtml)

[2] https://www.ipcc.ch/

[3] https://www.ipcc.ch/pdf/ar5/pr_wg2/140330_pr_wgII_spm_en.pdf

[4] http://www.ipcc-wg3.de/special-reports/srren/special-report-renewable-energy-sources

[5] http://www.sandrp.in/hydropower/Pathetic_Cumulative_Impact_Assessment_of_Ganga_Hydro_projects.pdf

[6] https://sandrp.wordpress.com/2013/06/21/uttarakhand-deluge-how-human-actions-and-neglect-converted-a-natural-phenomenon-into-a-massive-disaster/

https://sandrp.wordpress.com/2013/06/23/uttarakhand-floods-disaster-lessons-for-himalayan-states/

https://sandrp.wordpress.com/2013/06/25/uttarakhand-and-climate-change-how-long-can-we-ignore-this-in-himalayas/

https://sandrp.wordpress.com/2013/08/14/uttarakhand-flood-disaster-supreme-courts-directions-on-uttarakhand-hydropower-projects/

https://sandrp.wordpress.com/2013/09/27/uttarakhand-floods-of-june-2013-curtain-raiser-on-the-events-at-nhpcs-280-mw-dhauliganga-hep/


Bhutan · Hydropower

Fish Ladder at Kurichhu Hydropower Project, Bhutan: Some thoughts

By Malika Virdi and Emmanuel Theophilus, Himal Prakriti

 While hydro-power is projected as clean energy, there is sufficient evidence to the contrary, on various counts. One of the major concerns about hydropower projects, is that the dams, whether they be impoundment dams or diversion dams (the latter going under the misleading euphemism nowadays of run-of-the-river structures), critically fragment a river. Regulation and release of water at extreme lows (often nil) and sudden releases apart, dams are an impassable barrier for migratory fish, progressively depleting populations past critical thresholds, eventually leaving rivers bereft of life. Dead rivers affect not only the freshwater aquatic realm, but also all terrestrial life dependent on rivers, including large human populations. The impacts are known to cascade down the entire river continuum down to the oceans. Not only does such river regulation have serious political implications in terms of equity and justice between proximate and faraway users, but far-reaching cultural repercussions as well.

Kurichhu HEP Photo: Druk Green

In the on-going discourse on the large-scale build-up of hydro-power projects in the Himalaya, which will soon be the most densely dammed region on earth, one encounters proposed part-solutions, often billed as mitigation measures. Ofcourse, every attempt at addressing the serious problems created by hydropower projects is desirable and welcome. However, which of these actually mitigate or provide solutions to the problems created by hydro-power projects, and which of them only serve to provide camouflage from public gaze, or a cover of legitimacy for mandatory approvals, does require to be looked at more closely.

We have been hearing for long about fish passes of various designs constructed on hydro-power dams in the US and in Europe, to allow the passage of many species of migratory fish, to travel to their breeding grounds in distant mountain rivers. None of the numerous hydro-power projects under construction in Uttarakhand have incorporated any provision for the passage of seasonal migratory fish, and this is puzzling. How are hydro-power projects cleared on environmental grounds and approved despite their disastrous impact on fish movement and subsequently on fish populations?

One instance of a proposed mitigation measure is what was proposed by WAPCOS for NTPC’s Rupsiabagar-Khasiabara HEP in the Gori river basin where we live. While the project has recently been denied Forest Clearance for diversion of forest land for the specific dam-site, it had earlier managed to secure overall Environmental Clearance on the basis of proposed mitigation measures, and is being cited here as a case in point. Addressing the problem of creating a barrier for movement of migratory fish, WAPCOS proposed an entire fish breeding-and-stocking programme. The proposal was for setting up facilities for producing seed of snow trout (Schizothorax richardsonii) at a cost of Rs. 16.05 million, for periodically stocking 3 cm long fingerlings with 100 fingerlings per km of river, for 10 km upstream and downstream of the dam structure, for 5 years. Serious money that could even sound like a serious effort. Only, anyone living close to the river knows that the proposed dam-site itself, let alone 10 km above it, is entirely uninhabited by any fish whatsoever. This was clearly a ‘mitigation measure’ proposed only to obtain environmental clearance. It is another matter that even WAPCOS’s species fish-list for the river was just a wish-list.

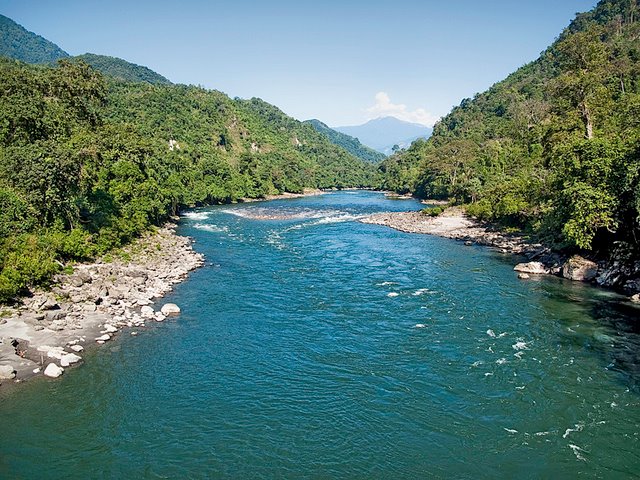
In the context of addressing the problem of fish-passage, we were informed of a fish-ladder constructed by the NHPC for the Kurichhu HEP in Mongar in Bhutan, so we undertook to visit and see the fish ladder design, and to speak to the hydro-power company to understand how effective it was. The Kurichhu is a medium sized Himalayan river in Eastern Bhutan, forming the upper main-stem of the Manas river which originates in Tibet. Access to it by road is long and circuitous, and after a year of trying to get away for long enough to visit, we finally reached there on the cloudy afternoon of 11th January 2014. Prior permission had been sought for the visit through contacts in India, and we were received and shown around with rare grace and courtesy by officials of DrukGreen, the company running the hydro-power project after handover to it by the NHPC of India. The sight of the ladder was thrilling, and we were even permitted take photos of the fish ladder.

Fish Ladder at Kurichhu HEP Photo : Authors


January is not the season for either upstream or downstream movement of fish in that zone, so we could not see fish movement in the ladder for ourselves. However, we gathered the following:

The dam is a 55 m high (from the foundation) concrete gravity dam located at an altitude of about 530 meters asl and is 285 meters across the beautiful, dark, blue-green Kurichhu river at Gyalpozhing. At full reservoir level 15.70 million m³ of water is impounded behind the dam. At the time of our visit, one of the four turbines was operational and there was a small release of water downstream of the dam. The fish ladder was in flow, releasing just 0.8 cumecs of water. The project authorities said that during such low-flows, this is the only flow from the dam, since there is no minimum flow required to be maintained by law in Bhutan. The ladder is a pool-and-weir type, with submerged orifices and centrally located notches.  A pool and weir design is one of the oldest styles of fish ladders. It uses a series of small dams and pools of regular length to create a long, sloping channel for fish to travel around the obstruction, in this case the dam. The channel acts as a fixed  lock to gradually step down the water level; and to head upstream, fish must either negotiate a slot, or jump over from box to box in the ladder.

The Kurichhu fish pass has a total of 98 baffles, each 1.5 m wide and 1.5 m deep, arranged at a distance of about 2.9 m. The total depth of each pool is 2 m. There are two exits (water entrances) to the fish pass, the lower exit placed 5 m lower than the other, to provide for flow at different draw-down levels. The vertical height between the water level of the ‘stilling basin’ (interesting name for a reservoir holding 15.7 million m³ of water) and the water entrance for fish from below the dam is 32 meters. To achieve this height, the fish-pass channel has to traverse a total distance of 320 m, leading to a slope of 1:10, and resulting in a drop in height per pool of 0.3-0.4 m. Quite impressive, except that the slot in the centre of each baffle does not exceed 25 cm in width. Clearly, no way for big fish, and Mahseer (Tor), the fish with the longest migration distance in this river, also happens to be the largest carp in the world.

We asked the project manager whether they know the fish ladder to be effective. He said that on a few occasions during the fish migration season, they had stopped the flow of water in the ladder and found some small fish in some of the drained pools. They did not know which species they were. We enquired whether there had been any systematic study of the efficacy of the fish ladder, in terms of comparing, with a baseline since commissioning the dam in 2002. Whether there was a change in species composition, or a significant change in upstream fish populations during this time? He replied that they had not.

Mahseer in Bhutan's Rivers. Photo with thanks from: http://yesheydorji.blogspot.in/
Mahseer in Bhutan’s Rivers. Photo with thanks from: http://yesheydorji.blogspot.in/

Discussion: It is understandable that project authorities in Bhutan were not familiar with names of fish species or other particularities, because people in Bhutan in general do not catch or eat fish. This could stem from Buddhist tradition, but also from funereal custom, where one of the traditional options is that the body of deceased adults is dismembered and consigned to the river for fish to consume.

On enquiring about any documentation with regard to the fish ladder design, they kindly shared a document titled ‘Feasibility Studies for fisheries development in Kurichhu reservoir, Bhutan’ prepared for NHPC, Faridabad, by CIFRI, Calcutta. While CIFRI has been hired by NHPC ostensibly for extending their expertise on fish, they could have spared us their use of tired narratives of ‘development’. It is clearly beyond their area of expertise. Prefacing their feasibility study on fish passes with statements such as “advancement of human civilization and distortion of natural habitat go hand in hand,” and “requirement of electricity is synonymous with the development of civilization”, and more, just exposes their fait accompli. We photographed relevant pages onsite, and along with discussions, have gathered the following:

Since every fish passage requires to be designed to cater to the specific behavioural propensities and physical capabilities of a particular set of fish species inhabiting the river in question, certain stretches of the river were sampled by CIFRI. The fish they caught can be grouped into three broad groups:

  • Snow trout, mahseers and minor carps: Schizothorax richardsonii. S. Progastus, Barbodes hexagonolepis, Labeo dolycheilus.
  • Loaches: Garra lyssorhinchus, G. gotyla,
  • Catfish: Glyptothorax coheni, G. brevipinnis, Pseudocheneis sulcatus.

CIFRI did not catch Tor during sampling, but during dam building many fish were caught by workers and staff from India, one 15 kg and another 20 kg fish near Kurizhampa bridge. Fish of this size cannot be Barbodes or Chocolate Mahseer, and seem to be Mahseer of the Tor genus (species tor or putitora).

The three functional categories of fish migration in general are: Reproductive (spawning) migration, feeding (trophic) migration and refuge migration. For this, hill-stream fish are known to migrate between three major habitats: A wintering habitat, a feeding habitat and their spawning habitat.

Dams and other diversions for river regulation are seen to impact fish in five major ways:

  • Obstruction in the ascent of fish in their migration for spawning.
  • Reservoirs can inundate spawning habitat, silting up gravels,
  • Changes in river water quality due to inter-basin transfers and stratification of water.
  • Natural flows downstream are radically altered. This includes abruptness of changes in flow, in volume, velocity and seasonality.
  • Prevention of young migratory fish and refuge migrants from descending to lower reaches.

In addition, adverse repercussions result from indirect effects such as the disruption of the food-webs downstream, stranding of fish during rapid flow fluctuations, and siltation in the reservoir above the dam. The chemical, trophic and thermal properties of a river are greatly  altered. Additionally, changes in slope, riverbed profile, structure of the bottom surface, submergence of gravel zones, and changes in the thermal and trophic regimes, affect the habitability of certain stretches of the river.

Designs of fish passages are many, and can be broadly categorized as follows:

  • Fish ladders. Pool and weir, baffle fishways, rock-ramp fishways, vertical slot.
  • Fish lift locks
  • Fish elevators
  • Fish trapping and hauling.
PoolWeir-Bonneville_Ladder
Pool and Weir Type Fish Ladder, Bonneville Dam, United States Photo: Wikipedia
Special Fish Ladder for Salmon in Sweden. Photo: Wikipedia

The basic information you need for designing a fish pass, is details about the species particularities such as normal cruising speed and burst speed of target species. Some important criteria are:

  • Provision of comfortable passage for all migratory species, including the poorer swimmers, over the entire length of the fish pass. To achieve this, provision for refuge against fast currents at regular intervals should be made.
  • Year-round functionality, under different flow regimes, temperatures and oxygen levels, notably to enable fish displaced by floods to return to their initial habitat.
  • Sufficient space or carrying capacity allowing massive upstream ascents during reproductive or trophic migration.
  • Positioning the entry of the fish pass so that it is readily identifiable and accessible to the migrants.
  • Attraction of fish to the fish pass entrance in the downstream (water exit) in case of upstream migration and deterring them from dead-ends and dangerous places.
  • Positioning of upstream outlet (fish exit) of fish passes far enough from spillways and turbines to minimize the risk of being swept downstream or being damaged.

Clearly, creating an artificial fish passage is complex and would not work if the multiple aspects are not considered and provided for. Ease of physical passage is just one important aspect. Migration is specifically timed to match various conditions, and even a delay in migration can nullify the purpose. For example, upwelling and excessive turbulence in the areas near the fish entrance are undesirable, as they can confuse migrating fish from finding the entrance. For this, the gates of the dam are required to be manipulated so that the heaviest spill is at the bank opposite the fish-way, with the result that the velocity barrier forms a diagonal lead, a traffic signal of sorts, across the river to the fish entrance. Apart from a sufficient ‘attraction flow’ at the entrance of a fish pass, projects elsewhere have experimented with directing fish traffic with the help of guiding screens, and the use of overblown ‘traffic signals’ such as acoustic arrays, strobe and mercury lights, and even electric fields.

At a fish passage such as the array at Kurichhu, it is critical that at the entrance of the fish-way, the gate is to be manipulated to ensure possible passage of fish. Depth and velocity to suit particular species need to be maintained. CIFRI recommended a ‘compromised’ depth of 25 cm to be sufficient to allow fish passage. In addition the gates should be regulated to ensure that all the baffles are submerged, allowing the fish to swim over them upstream comfortably. This was not the case, when we visited, the flow level did not allow for the baffles to be submerged, as visible in the photograph as well.

Even with a depth of 25 cm in the fish exit, the variable head-height as per the draw-down of the reservoir can create a higher velocity than desired. While CIFRI warns that this poses apprehensions regarding hindrance to fish migration, they dismiss these apprehensions summarily thereafter, stating that this high velocity is observed only for a short distance, which fish would be able to negotiate using burst speed (high speed, short duration). CIFRI mentions that it is only when the speed at the water entrance or any other point exceeds burst speed, (5-6 m per second) that fish would be unable to cross this speed barrier.

While variables such as water temperature and fish length are determinants of swimming speed of fish, CIFRI has assumed that Schizothorax  and Barbodes can swim at 3-5 and 2-4 m per second respectively. They have taken the flow speed of water with head height, and fitted it to the equation for determining the velocity through the orifices in or over the baffles, and they are estimated to be ranging from 2.69 to 2.80 m per second, which they say, ‘permits the fish to cruise through the fish-way comfortably.’

There are some doubts here. Even a short distance of one baffle, or at just the entrance is critical, because if that is unpassable, the entire fish-way is unsuccessful. Further, CIFRI has arrived at burst-speed of fish for this river not by actual studies on specific species, but by inference from studies on fish in other countries. What strikes as doubtful about this basis, is their assumption that all other things being equal, a fish of any species is capable of equal burst speed, provided it is of the same length. This does not match anything one sees as evidence in the occupation of different fish species in different river stretches, nor in their striking speed while feeding competitively.

In order to test whether the fish ladder was ‘working’, CIFRI officials operated the fish pass in March (the beginning of the migration season) for 3 days and then closed the sluice gates to check. They found Schizothorax richardsonii, Garra gotyla and G. lissorhinchus in the top-most pool. They did it again in June and found 8 species in the uppermost pool. While it is clear from this that some fish are making it up the channel right upto the top pool, they have no way of knowing for sure whether they were getting through the 25 cm gap at different draw-down levels.

The critical question here is not just whether some fish are making it up the channel, but which species, how many, and are breeding populations making it up on time? A relevant study cited on the April 2013 issue of the Yale Environment 360, titled ‘Fish and hydropower on the U.S. Atlantic coast: failed fisheries policies from half-way technologies’ by J.Jed Brown and 6 other co-authors (Conservation Letters, Vol 6. Issue 4, p 280-286, July/Aug 2013) is instructive. The discussion by co-author John Waldman is titled ‘Blocked Migration: Fish Ladders on US dams are not effective’, citing this study goes on to say that fishways on rivers in the U.S. Northeast are failing, with less than 3 percent of one key species making it upriver to their spawning grounds.

 Waldman says that “in most major rivers in the U.S., maintaining some semblance of the integrity of migratory fish runs past hydropower dams is dependent upon the fish using ladders and elevators”. They undertook a study of the success – or, rather, failure – of Atlantic salmon, American shad, river herring, and other species in migrating from the sea to their spawning grounds past a gauntlet of dams on three rivers in the northeastern U.S. – the Susquehanna, Connecticut, and Merrimack. Waldman says “what we found was grimmer than we expected. For one species, American shad, less than 3 percent of the fish made it past all the dams in these rivers to their historical spawning reaches.  The sobering aspect of these contemporary studies is that they are based on the insubstantial number of fish today as compared to earlier massive migrations of these species, which numbered in the many millions. For the international community, the record of fish passage on rivers in the northeastern U.S. is a cautionary tale”.

He goes on to say that “hydropower has often been billed as a clean source of renewable energy, and generating electricity without polluting the air or producing greenhouse gases is commendable. But ‘clean’ is in the eye of the beholder, and any claims to being sustainable ignore its multifarious aquatic effects, including blocking fish passage, fragmenting habitat, and undermining a river’s fundamental ecological services.”

What Brown and co-authors found was bleak. One metric used was the percentage of fish passing the first dam that also passed just the second dam. For shad, the numbers were 16 percent on the Merrimack, 4 percent on the Connecticut, and 32 percent on the Susquehanna. But on these rivers, Waldman says, the second dam is only the beginning of the journey, and these rivers have multiple dams blocking access to historical spawning reaches. It’s important to put these results in perspective because they are merely relative to the present paltry numbers of fish that even attempt to migrate up these rivers.

The study says that there are three absolute numbers that matter. One is how many ran annually before the dam was created, the second is the numbers targeted for restoration in fish passage programs, and the third are the numbers that actually show up each year. On all the rivers examined by the study, restoration goals were in the hundreds of thousands of fish – at least one, if not two, orders of magnitude less than historic, pristine runs. Yet run sizes obtained across three decades ranged annually from a high of about 10 percent to, more commonly, 2 percent or less of the stated goals.

There are two significant aspects worth taking note of here. First, the three absolute numbers that matter, as mentioned in the paragraph above. The construction of a fish ladder must come with quantified stated goals, in terms of the number of fish that are required to pass as minimum, to achieve the desired stability of fish populations. This requires an estimate of populations prior to building the dam, and an estimate of the number that migrate unimpeded, as well as specific population dynamics. Fish migrations in large rivers can be in the millions, as already cited here from Brown and Waldman’s study. Here at the Kurichhu, or any other fish-pass in India, population and migration estimates, let alone quantified goals are a far cry.

Secondly, the study clearly illustrates that every subsequent dam upstream has a cumulative  impact on the numbers of fish succeeding upstream, diminishing in orders of magnitude. This brings to the fore the critical importance of considering cumulative impact of multiple projects, despite ‘mitigation measures’, along an entire stream-length, before any clearance is given piece-meal.

While on the design for fish-passes on specific hydro-projects, there are many aspects other than physical passability provided by a fish-pass, that determine its success or failure. Changed flow, turbulence, and volumes can be disorienting for fish leading to serial delays, making it unlikely that the many fish make it to the spawning reaches at the optimal time in the river’s seasonal ecological cycle. The numbers of adults successfully returning downstream past the dams also sacrifice their future spawning potential. The flow out of an operating fish-ladder is often very small compared to the water going into the intake to the turbines, and fish will often choose the larger flow during descent, to their peril. At Kurichhu for example, the flow down the fish ladder is just 0.80 m³ a second, which is a fraction of the flows for the 4.75 m diameter intake of any one of the four 15 MW turbines.

There is also the larger question of flows in a river being regulated by series of dams, and sometimes being too low to provide the necessary cues for hormonal change and migration, puts paid to fish even reaching fish-ladders in the first place.

The study by Brown and colleagues in the US says that despite vast spending on modern technologies, contemporary shad migrations on these rivers are at least three to four orders of magnitude below the original unfettered run sizes, with similar results for salmon and river herring. While dams alone don’t explain these results; overfishing, habitat destruction, and alien species contribute – but there is widespread consensus among fish biologists that dams (such fish-passes notwithstanding) are a primary cause. Surely, a cautionary tale for India.

And here is another cautionary tale for India, where unlike Bhutan, fish are eaten, readily. Thirty-three years ago, standing on the Sutlej Barrage at Ropar in Punjab, I witnessed a strange sight. At the base of the barrage, there was some urgent movement in the cold blue waters of the Sutlej in early spring. Mahseer fish were attempting to migrate up and beyond the 10 meter high barrage. There, right along the buttress of the sloping spillway, one could see a living pyramid of thousands of fish upon fish, slithering up the side of the uni-dimensional triangle against the spillway, barely submerged in the leaking flow from one of the gates, and wriggling on top of and past each other, in a futile effort to make it over the barrage. While this may just have been a collective shoal strategy to get past smaller rapids, it was a death-trap for fish there, against a steep and high barrage. Some other men had already seen this, and I could see them wade up to the desperate and tenuous pyramid in knee deep water below the barrage, and carrying away fish in sack-loads.

Hydro-power projects in India may undertake to construct fish-ladders projected as mitigations measures to obtain environmental clearance, but that does not prevent the staff and others from making the best of the concentration of fish at the base of the fish-ladders and even at un-passable barrages and predating on them. The CIFRI study for the Kurichhu mentions that Indian workers hired by NHPC regularly fished at points of concentration during migration season, nullifying the purpose of the fish-pass. Clearly, the dam authorities will also need to be charged with the responsibility for protection of fish-passes, and other points of concentration even on dams without fish passes.

These are some of the aspects that require to be further investigated about fish-passes in our Indian context, and to be put on the table for discussion and closer scrutiny when mitigation measures are proposed by hydro-power projects.

Editor’s Note from SANDRP:

When the rivers in Himalayas are facing huge impacts of cascade hydropower projects, it is important to look at the role played by organisations like CIFRI ( Central Inland Fisheries Research Institute) which is supposed to be Asia’s “premier facility in the feild of inland fisheries research” CIFRI was hired as a consultant for recommending eflows for Teesta IV HEP in Sikkim and 780 MW Nyamjangchu HEP in Tawang, Arunachal Pradesh. In the case of Nyamjangchu, CIFRI recommended a flow of 3.5 cumces from the proposed barrage point, which is 14% lower than the lowest flows recorded (extrapolated) for that site. It is highly improbable that even CIFRI’s target species of snow trout will be able to sustain these drastic flow reductions. CIFRI has not raised a voice when multiple dams are being planned without fish ladders or realistic mitigation measures across the country when protecting riverine fish and fisheries is a part of its mandate.

In a strange contradiction, although India’s NHPC has built Kurichhu HEP and CIFRI has designed the fish ladder for a dam that is 55 mts high, the EAC of the MoEF in India unilaterally thinks that fish ladders do not work for dams, even as high as 42 meters, This EAC also includes representative from CIFRI.

Before concluding that fish ladders will or will not work in India, we need extensive studies on this subject for different rivers and projects. Unfortunately, none are being undertaken, in line with our overall apathy towards riverine fish diversity and fisheries. Good, scientific  studies will help in designing ladders which can be useful for species specifically found in Indian rivers, or will conclude that ladders will not work in specific cases, in which case, the irreversible impact of the project will have to be looked at in a perspective beyond ‘mitigation measures’.


Hydropower · Hydropower Performance · Western Ghats

Story of a free-flowing stretch of Kali River in Karnataka

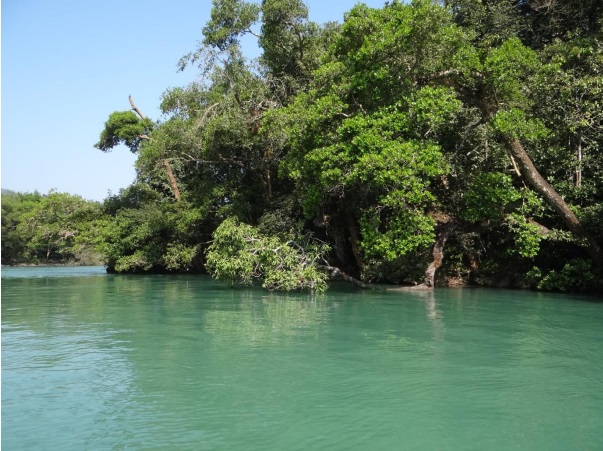
River Kali, before it enters Dandeli in Karnataka is a breathtaking sight..

Its waters are emerald green, flowing steadily. Its banks are thickly forested with a continuous canopy. Endemic species like Malabar Giant Squirrel, Malabar Pied Hornbills, Malabar Gray Hornbills are a common sight here. Down the river, a monitor lizard is stretched across a branch, low over the waters. Fishing eagles and several kinds of Kingfishers look for fish. Fisher folk hover along the banks in beautiful coracles, laying hooks in the riparian vegetation.

During our visit to the Kali, my six-year-old  swam in the river and could not believe that the river back in his home-town was once as clear as this!

Emerald waters of the Kali Photo: Author

It’s hard to imagine that it was a touch-and-go for this stretch of Kali…

If it were not for some brave, timely advocacy and strong local action, most of this stretch would have been submerged. Rest of the river would have been diverted through a tunnel or silenced in a steady pool of a reservoir: the way many Indian rivers are silenced. There would have been no river, no riparian forests and possibly no swimming.

Malabar Pied and Malabar Gray Hornbills on the banks of Kali Photo: Author

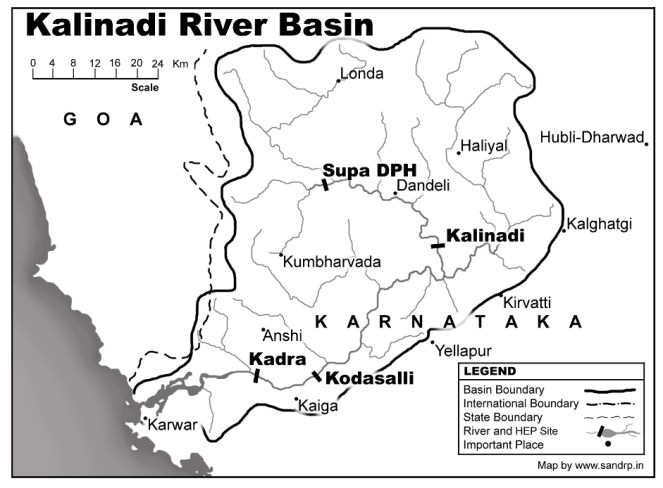
Dams on Kali: Kali has seen far too much damming. According to Kali Bachao Andolan, a network of organizations working to protect Kali River, more than 5 dams across the river have already submerged 32,000 acres of forests in the Western Ghats. According to Karnataka Power Corporation website, “The west flowing Kalinadi has its origin at an elevation of 900 m, near the DiggiVillage in the Western Ghats of Karnataka. Its 180-km long journey ends at the Arabian Sea near Karwar.”

Kalimap1

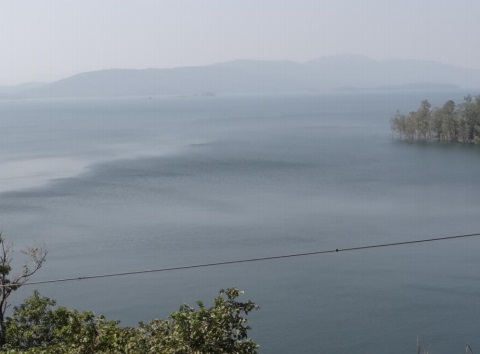
After its origin, it’s dammed at Supa in Joida Taluk of the Uttara Kannada District. The submergence of Supa Dam is a site to behold. Stretching endlessly like an ocean, this dam submerged more than 24 villages and hundreds of hectares of forests. One of the dam evictees, an old, frail man now tells me, “Even now in summers, when the waters recede, I can see my village and my temple. We try to go there some times. I can see all my past life there, for a brief period, before it all goes under water again”.

Extensive submergence of the Supa Dam Photo: Author

genrationKali

Downstream the 101 m-high Supa Dam (100 MW), the river flows down through Dandeli town, taking huge pollution from West Coast Paper Mills on the way. From here it is dammed at Bomanhalli Pick up Dam, from where it is diverted to Nagazhari Powerhouse (870 MW), then to Kodasalli Dam and powerhouse (120 MW) and then at Kadra Dam and powerhouse (150 MW).  If we look at the flow chart of Kali Nadi Dams, the river seems to be flowing from one reservoir into the next, with nearly no free flowing river stretch between two dams. Its main tributaries Kaneri and Tatihalla have been dammed too.[1] The power generation performance of Kali dams for the last 27 years is shown in the graph above.

There is a stretch downstream the Supa dam to Bomanhalli Pick up dam, where the Kali still flows. This again is controlled flow, regulated by the Supa Dam. But this is the precise stretch which was also targeted to be dammed in 2000’s. An 18 MW project by Murudeshwar Power Corporation Limited (MPCL) was proposed to come up at Mavlangi village downstream Supa Dam. According to Kali Bachao Andolan, it would have meant submergence of 210 hectares of land, including 70 hectares of forest land, next to the Dandeli Sanctuary. Kali Bachao Andolan, including Parisar Samrakshana Samiti, Sirsi and Environment Support Group (ESG), Bangalore, highlighted that Uttar Kannada District only needed 17 MW electricity (in 2000) while it was producing more than 1200 MW electricity and one more dam at a huge social and ecological costs cannot be justified. More importantly, ESG exposed that the Rapid EIA (Environment Impact Assessment) report done by reputed consultancy Ernst and Young for the proponent, was in fact a copy-paste of a different EIA, done by a different agency for a different river! A strong campaign was built around this, which garnered public and media support.

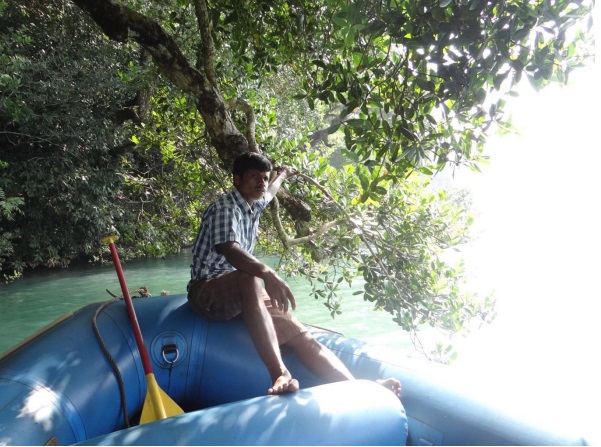
Guide from one of the homestay-resorts, a resident of Dandeli Photo: Author

In 2006, the Forest Advisory Committee of the MoEF rejected Forest Clearance for this project. The project was also strongly opposed internally within the Karnataka Government by the Department of Tourism. Surprisingly, MoEF did not book the EIA agent (Ernst and Young) or the proponent (MPCL) for submitting an entirely false report! Even more shockingly, this EIA was later done by TERI (The Energy Research Institute), which also completed the study in one month and came up with a dubious report based on secondary data. However, strong opposition from local groups, ESG, and even within Karnataka Government resulted in rejection of the proposal by a number of authorities, including the Department of Industries and Collectorate of Uttar Kannada. Since then, the project has tried to raise its head again, only to be opposed strongly.[2]

Fishing along the Kali in the early morning Photo: Author

Around 10 years down the line, what does this small stretch of free flowing river mean?

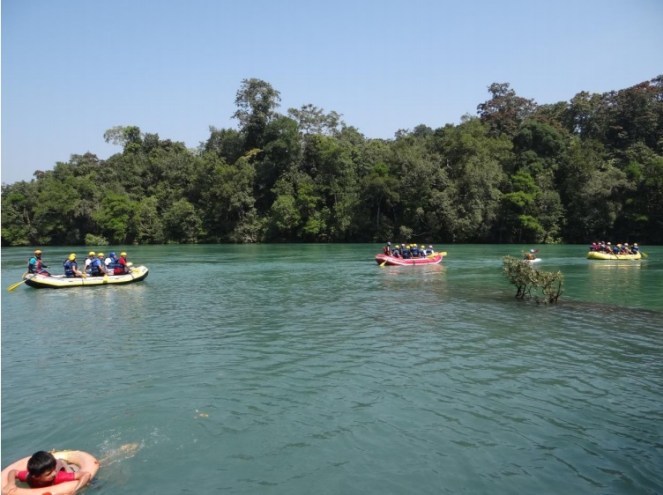
I traveled in Uttara Kannada as a tourist in November 2013. A thriving tourism industry now exists on the banks of Kali and the river is now world-renowned as one of the best rivers for white-water rafting in India. There is boating, canoeing, kayaking, swimming, fishing along this stretch of the river. Pools and islands in the river provide perfect habitats for various species as well as for naturalists and bird watchers. The range of recreational activities that take place along the river are endless. Fishermen still lay their nets across this stretch and catch some fish (though I was told that fish greatly reduced after Supa Dam was commissioned in 1985). Along the banks of the river in this stretch, a thick riparian forest flourishes, providing habitat and corridor to several species.

But more importantly, this tiny stretch is a reminder of how this great river once was. A humbling reminder.

According to Lal, now a boatman and guide from Dandeli, the river stretch which could have been dammed, now provides tourism related employment to around 1000 people from around the region. The region supports around 8 resorts and several homestays. It has created multiple employment opportunities for locals like naturalists, guides, white-water trainers, etc.  Some of the locals are descendants of the Supa Dam evictees. One of them says, “The relocated colony of Supa evictees is called Ramnagara, actually it is Vanvasanagara. If it were not for the tourism, I would have migrated to Goa or Belgaon.  We saw the fate of Supa dam displaced and would not allow one more dam, no matter how small or big, to affect us again.”

Many ways to enjoy a flowing river: Rafting, canoeing, swimming Photo: Author

The struggle against 18 MW mini hydel has been significant in a number of ways. EIA and public hearing for the project were the two events where protests were recorded. It was through these platforms that the extent of the impacts of the projects was known and could be opposed. However, after this, a newer version of EIA Notification was adopted in Sept 2006 which excludes hydel projects below 25 MW from its ambit! This has been a ecologically senseless move as projects which have severe impacts on the ecology do not even need a public hearing and an EIA now! We, and several experts and organizations, have raised this point a number of times with the MoEF, but MoEF is yet to respond.

One more strong point of the struggle was a more than 20-year-old order by Karnataka government categorically stating that since the Kali river is so heavily dammed (five major dams on this short 186 kilometre long river, destroying most of its forests and displacing thousands of tribal and forest dwelling communities), no more dams, big or small, shall be allowed further across this river. This has been a very significant order.

Even today, when more and more bumper to bumper dams in the Himalayas and Western Ghats are killing our rivers, our Ministry of Environment and Forests does not have a clear guideline for protecting certain stretches of rivers from dams or declaring them as no-dam stretches. There exists no such order protecting over-dammed, collapsing rivers.The only report which actually recommended that 24 dams in the Upper Ganga basin should be dropped due to their impact on ecosystems, has not been complied with by the MoEF. Dams are coming up in cascades, without leaving any free-flowing riverine stretch between two projects. Nothing is being done about this. The MoEF’s Expert Appraisal Committee on River Valley Projects now has a weak norm of leaving a bare kilometer of flowing river between projects. But this norm too gets twisted and violated.

Avay Shukla committee appointed by Himachal Pradesh High Court recommended that projects should have at least 5 kilometers of free flowing river between them. But MoEF does not seem to support this. In fact, a flowing river seems to have no value in our governance system.

However, as the Kali experience shows, a flowing river is good for ecology and is good for the people too.

Let us take this opportunity to thank the Kali Bachao Andolan and the local communities for protecting the last remaining free flowing stretch of Kali… so that we can catch a glimpse of how a free-flowing river looks like!

– Parineeta Dandekar

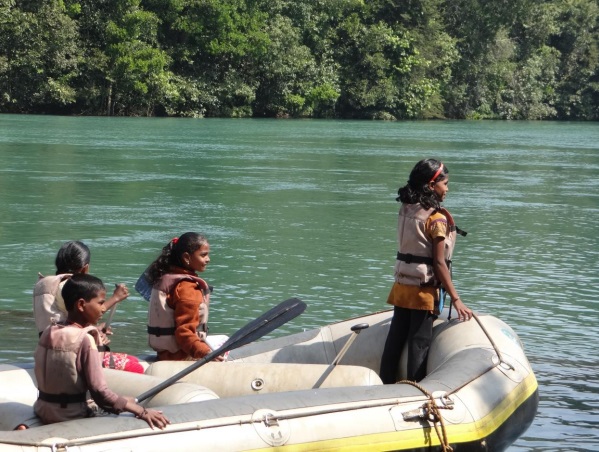
Local children rafting along the Kali Photo: Author
Hydropower · Uttarakhand

Expert Committee following SC order of 13 Aug 13 on Uttarakhand: Needs full mandate and trimming down

Over two months after the Supreme Court (SC) of India order of Aug 13, 2013[1], the MEF has now constituted an expert committee, see MEF order no: L-11011/14/2011-IA.I (Vol-II) dated Oct 15, 2013[2].

The constitution of the committee under the chairpersonship of Ravi Chopra is welcome, with the inclusion of some independent and expert members. At the same time, the committee is unwieldy with excessive inclusion of government members and members with conflict of interest. This raises doubts if the committee will be allowed to function in an independent way. The committee has not been given the full mandate as required by the Supreme Court order.

1. The MoEF order says in the very first para of the order, “Ministry of Environment & Forests hereby constitutes an Expert Committee to make a detailed study as to whether Hydroelectric power projects existing and under construction in the river basins of Alkananda, Bhagirathi and their tributaries”. It also says that the expert committee has been set up following Supreme Court orders dated Aug 13, 2013. But why limit to Alaknanda Bhagirathi (AB) basin and its tributaries? That leaves out a huge area of Uttarakhand that also suffered damages, including Ganga, Yamuna and Kali-Gori basins and where too hydropower projects are present and under construction. The SC order was not limited to AB basins, but was applicable to the entire UttarakhandState“Hydroelectric Power Projects existing and under construction have contributed to the environmental degradation, if so, to what extent and also whether it has contributed to the present tragedy occurred at Uttarakhand”. This committee’s mandate to look at only Alaknanda and BhagirathiBasins is limited does not comply with the SC order.

2. Mr BP Das, a member of this expert body, is former vice chair of Ministry of Environment and Forests’ (MoEF) EAC (Expert Appraisal Committee on River Valley Projects). He has been a member of EAC for many years and many of the projects cleared by the EAC that he was member of will now be reviewed by the committee this is clearly wrong. He has also presided over decisions to clear projects that WII had recommended be dropped. By making him member of this committee he will be now sitting on judgement over those same projects. Mr. B.P. Das has also been the head of committee constituted by MoEF which looked at environmental compliance of 330 MW Srinagar HEP of GVK company. To make Mr. Das a member of the committee is clearly inappropriate.

3. Similarly Mr G L Bansal has been a member of the EAC and hence his selection in this committee involves conflict of interest and should not have been done.

4. The second TOR of the committee says: “Examine, as observed by Wildlife Institute of India (WII) in its report, as to whether the proposed 24 projects in Uttarakhand are causing significant impact on the Biodiversity of Alaknanda & Bhagirathi river basins.” The Supreme Court order of Aug 13, 2013 had asked MoEF to take a view on these projects, which the ministry so far has refused to do. it has passed the hat to this committee.

This TOR too is very limited. It asks if the 24 projects are causing “significant impact” on biodiversity of AB basins. Do we need another expert committee to opine if big hydropower projects are causing significant impacts on biodiversity, when an expert body like WII has already concluded the impacts are so serious that the projects need to be dropped? This seems to be making fun of the WII report and attempt to not to respond to the SC order.

5. It seems some of the government members have been added just to make the committee loaded with government persons. Some such member includes Chief Engineer of Uttarakhand Water Resources Department, Expert representatives of NIRM, ICFRI, NDMA and CPWD. They were not part of the SC order. These bodies also do not have any expertise or direct involvement in hydropower projects. If the committee needed their expertise, they can in any case be asked to depose before the committee. Their presence is unnecessary and makes the committee unwieldy and difficult to manage.

6. Several respected women have been working on issues related to sustainable development, hydropower, its impacts on communities and ecosystems. However, the present committee does not have any representation from women. This is a serious concern.

This committee has a serious task ahead of it and for completing it effectively and in an unbiased manner, its mandate needs to be expanded to include whole of Uttarakhand as per the SC order. The constitution needs to be streamlined and members with conflict of interest as well as unnecessary government representation, as mentioned above need to be dropped.

SANDRP

Dams · Hydropower · Ministry of Environment and Forests · Sikkim

Hydro Power Projects Violating SC order in the Greenest State of India

Gangtok, 9 October 2013: Deemed as the greenest state in India, the government of Sikkim has drawn flak of the national board of wildlife (NBWL) for blatant violation of the environmental norms and the standing order of the Supreme Court in implementation of several hydro power projects under different stages of construction.

The background: In its 28th meeting held on 20th March 2013, the proposal for 520 MW Teesta Stage-IV Hydroelectric Power Project, on River Teesta in North Sikkim to be developed by NHPC Ltd, was placed before the SC-NBWL (Standing Committee-National Board of Wild Life) for consideration. The Member Secretary had informed the SC-NBWL that the project location falls 4 km away from the Fambonglho Wildlife Sanctuary and was recommended by the State Board for Wildlife.

photo 1
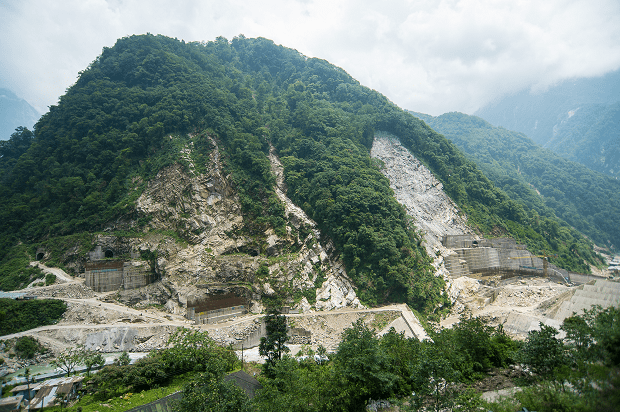
Photo from SC-NBWL committee report has this caption: Construction of the Teesta III project at Chungthang on the edge of Khangchendzonga National Park proceeding without SC-NBWL clearances. Note the extensive forest cover and large landslides at the site

Following discussions, the SC-NBWL decided that a team comprising Dr M.K.Ranjitsinh, Kishor Rithe, Dr A.J.T Johnsingh and Dr M.D. Madhusudan would carry out site inspection and submit a report to the committee for its consideration. Following this decision, the above committee visited the project site and nearby areas from 15th to 21st May 2013. The committee met the representatives from the Sikkim Government’s Forest, Environment and Wildlife Management Department (FEWMD), the user agency, NHPC Ltd, and people from local citizens’ groups. The report of the committee dated Aug 2013 is now available online (http://envfor.nic.in/division/wl-orders).

The report raises serious concerns about a number of hydropower projects in Sikkim under construction without wildlife clearance in contravention to the Supreme Court order[1] (in the Goa foundation case).  The Chamling government in Sikkim has allowed blatant violation of the Supreme Court order, a situation compared by the report with what had happened in Goa with respect to mines which were operating without wildlife clearance in violation of SC orders (the subject of the Shah Commission report). The Union Ministry of Environment and Forests is equally responsible for allowing continuing construction of these projects without legally mandatory clearances. The decision based on this report in the NBWL Standing Committee is still pending.

map 1
Map with locations of projects and protected areas from the SC-NBWL committee report

Both before and during site inspection, multiple stakeholders brought to the notice of the NBWL team that there were other proposed and ongoing hydel projects in the Teesta Basin located within the eco-sensitive zone (as defined by the Supreme Court in the Goa Foundation case), of the Khangchendzonga NP and Fambonglho WLS, which had not obtained the Supreme Court mandated clearance from the Standing Committee of the National Board for Wildlife.

Besides this,  the team in their journeys saw  two projects under active construction—the Dik Chu[2] and the Teesta III[3]—that were clearly within the Supreme Court mandated eco-sensitive area. For Dik Chu HEP, the report says, “However, the accompanying FEWMD officials informed us that these mandatory wildlife clearances from the SC-NBWL had, apparently, not been obtained.” For Teesta III HEP, FEWMD officials were not aware of the SC-NBWL clearance, and the committee noted, we “must therefore conclude, on the basis of information available with us, that such a clearance was not obtained… we are deeply concerned about the advisability of this project.”

Deeply concerned about the likelihood of various hydel projects coming up in violation of the Supreme Court’s order in the Goa Foundation case, the team has  requested the MoEF to write to the government of Sikkim, seeking a comprehensive list of completed, ongoing and proposed hydroelectric projects within the Supreme Court mandated 10-kilometre zone of the Khangchendzonga National Park (KNP) and Fambonglho Wildlife Sanctuary (FWLS). For each project,  details sought included:  (a) location (latitude-longitude) and distance from KNP and FWLS; (b) current status of the project; and (c) if and when they had obtained the required Environment, Forest and Wildlife Clearances. Even after waiting for 10 weeks, the NBWL team did not receive either an acknowledgment, or a response from the Pawan Chamling government to their query.

The committee, left with no option was compelled to use publicly available information on Environmental Clearances (EC) (http://environmentclearance.nic.in), submissions and information provided by other stakeholders, and to examine minutes from the SC-NBWL’s meetings, to ascertain if there was merit to the allegations made about the violations of the Supreme Court’s order of 12/2006.

Key recommendations Based on examination of available information on legal compliances required for the projects in the Teesta basin, the committee concluded that, with the notable exception of the Teesta IV project (which has currently approached the SC-NBWL for clearance), none of the other projects appear to have sought/obtained this compulsory SC-NBWL clearance, as mandated by the Supreme Court. While the SC-NBWL is fully aware that there are many more proposed/ongoing hydroelectric projects situated within the Supreme Court mandated 10-km eco-sensitive zone of wildlife sanctuaries and national parks in Sikkim, it has not been able to ascertain whether Supreme Court stipulations in their regard are being followed, or being violated, and if latter be the case, the MoEF should take due cognizance of the same urgently.

“We are of the unanimous considered opinion that it is absolutely essential to assess the overall impact of these projects, both from the recent past and those in the pipeline, rather than deal with them in a piecemeal fashion. Hence, we urge the Standing Committee not to consider the Teesta IV project’s request for clearance separately, but treat it as part of a larger set of hydroelectric projects in the Teesta Basin, with vast ecological, social and legal portents”, the committee has recommended.

It further recommend that the Standing Committee direct the MoEF to write to the Government of Sikkim asking them to immediately investigate and submit a detailed report listing hydroelectric projects in Sikkim that are being constructed prima facie in violation of Supreme Court’s order. Based on the list provided by the government of Sikkim, if it is indeed ascertained that the projects are proceeding in violation of the said Supreme Court ruling, it further adds that the MoEF initiate action by asking the State Government to suspend ongoing work on those projects immediately and to direct user agencies to formally seek clearance for these projects from the SC-NBWL. It adds that the MoEF and the Government of Sikkim thoroughly investigate the circumstances under which the seemingly widespread bypassing of Supreme Court orders in the construction of dams within the 10-km ecosensitive zone of Sikkim has taken place, fix responsibility for the transgressions and violations, and punish the guilty.

About Teesta IV proposal from NHPC, for which the committee visited Sikkim, the report recommends, “Finally, in the light of the devastating June 2013 Uttarakhand floods, we are deeply concerned about the wisdom of such large-scale manipulations of mountain river systems that are being implemented, against all reasonable scientific advice (and thedisregard of the CISHME’s recommendation against the construction of Teesta III, is a case in point)… Hence, we urge the Standing Committee not to consider the Teesta IV project’s request for clearance separately, but treat it as part of a larger set of hydroelectric projects in the TeestaBasin, with vast ecological, social and legal portents.”

The report also recommends  that projects already in the pipeline and that may be proposed in future in Sikkim, be placed before the Standing Committee, “chaired by a very senior official of the MoEF, Besides senior officials of the MoEF and the Sikkim Government, this committee must include legal experts as well as experts in hydrology/ geology/ seismology/ social science/ botany/ riverine ecology/wildlife ecology, from reputed research institutions and some representatives of local communities” whenever they fall within the purview of the Supreme Court-mandated 10 km eco-sensitive area around PAs. The committee report adds that much of the summary and recommendations section of Justice Shah’s report (pp. 189-200) is extremely relevant to the case of the hydroelectric dams in Sikkim, and that any committee constituted to examine hydroelectric dams in the eco-sensitive areas of Sikkim, pay close attention to this report.

No ecological flows from NHPC’s Teesta V What the report says about this subject makes disturbing reading: ”On 16th May 2013, driving upstream of the Teesta V powerhouse, we noted extremely low flow in the river, which was particularly so in the stretch of the river directly downstream of the Teesta V dam (Figure 1), where the river was diverted through a tunnel. Such low flows, where River Teesta has been diverted through tunnels, are a cause for serious concern in the context of maintaining the ecological function of a river. We enquired from NHPC officials about how details of ecological flows were determined, and learnt that ecological flow was not a parameter that was optimised in the planning process. We were told that downstream flows were effectively a consequence of maximising hydropower potential of various river basins as determined jointly by the Central Electricity Authority and the Central Water Commission. These values, in turn, were used as the basis for soliciting proposals for hydroelectric power projects. In other words, we learnt to our great dismay that absolutely no ecological consideration whatsoever was used in the process of determining the hydropower potential of river basins.”

Violations galore, government unresponsive In a submission made by Tseten Lepcha in his capacity as the then Honorary Wildlife Warden of North Sikkim to Jayanthi Natarajan in 8th October 2011, Lepcha had contended that how the 1750 MW Demwe Lower by the Athena group is being considered by the SC-NBWL for wildlife clearance, when a project by the same promoters (1200 MW Teesta III) is under construction in violation of Supreme Court orders (without wildlife clearance). The current NBWL report confirms that the 1200 MW Teesta III is under construction illegally, violating SC orders. In an earlier submission he had made to the SC-NBWL on April 19, 2011 he mentioned violation of the WLPA (killing of a Serow – Schedule I species) in the 1200 MW Teesta III project being developed by the Athena group. The developer of the project, Teesta Urja Ltd (a special purpose vehicle of M/S Athena Pvt. Ltd.), through its sub-contractor, SEW Infrastructure Ltd, was involved in the death of a Serow (Capricornis sumanntraensis), a Schedule I animal, at the project site on June 4, 2008.

photo 2
Photo from SC-NBWL com report with this caption: The Teesta V dam showing the virtual absence of flow in the river downstream of the dam, which can have devastating consequences for river-dwelling and river-dependent species

Several attempts by this correspondent, to contact the PCCF –cum-Secretary of the FEWM department of Sikkim Mr. Arvind Kumar on his cell phone, and his official e-mail address to get the Sikkim government’s official version on the controversy, remained unanswered.

How IPPs are cheating by flouting norms Sikkim Bhutia Lepcha Apex Committee (SIBLAC) convenor Tseten Tashi Bhutia, while speaking to this correspondent expressed immense joy at the NBWL report. “We have been protesting cultural and religious genocide being committed by the Sikkim government in the name of developing hydro power, apart from severely degrading the environment, this is a moral boost. I hope GOI takes strong action”, he said. Bhutia added that there are violations of the Places of Worship (special provisions) Act 1991, extended to Sikkim, and the gazette notifications of the Chamling government, in allowing the Tashiding project on holy river Rathong Chu.

SIBLAC along with another apolitical group Save Sikkim on September 28th, 2013 filed FIRs against an IPP, Shiga Energy Pvt ltd, developer of the 97 MW Tashiding hydro power project for alleged cheating, distortion of facts and violation of environmental norms and the SC order. This is in addition to an ongoing PIL at the Sikkim High Court.

The facts revealed by Tseten Tashi Bhutia in his FIR are startling and shocking. As per the requirement of the Environment Ministry (MoEF, Government of India), the executing agency i.e. Shiga Energy Private Limited, is required to submit a Six-monthly compliance report[4] on the status of the 97 MW Tashiding HEP to the stipulated environmental conditions in a prescribed format .However, while going through the latest Six monthly report dated 22.11.2012[5] submitted by the executing agency to the concerned authority i.e. North Eastern Region Office, Ministry of Environment & Forest, Government of India , it is found that as against the IX necessary conditions required in the prescribed format, the executing agency have intentionally deleted Stipulation No. VIII, jumping to the next condition.

The Monitoring report of MEF regional office (signed by DR S C KATIYAR, SCIENTIST ‘D’) dated Oct 2012[6] says about Stipulation VIII: “the proposed site is about 5 Km away from the buffer zone of the Khangchendzonga Biosphere Reserve as per Supreme Court order clearance from NBWL may be obtained (if required).”  Status of Compliance: “Not complied with” and further writes; “the project also falls within 10 Kms from the Fambomgla Wildlife Sanctuary, as such; NBWL clearance needs to be obtained.”

Thus the agency has not complied to nor has obtained NBWL clearance yet as evident from the Monitoring Report on the Implementation Status of Conditions of Environmental Clearance dated Oct 4th, 2012. In other words, the executing agency has simply and swiftly been misleading and cheating the authorities till date by submitting wrong report to Ministry of Environment and Forest, Govt. of India. More surprising is to witness the lack of action by the MoEF on these manipulations and lack of action even after the Monitoring Report clearly reports non compliance.

Rathongchu is a sacred river according to the Denjong Neyig and Nesol texts having its source at various secret and sacred lakes at Khangchendzonga, Sikkim’s supreme guardian deity and runs independently till it meets River Rangit at the lower reaches; This sacred Rathongchu is the source to the annual Tashiding Bumchu ceremony which is held in the first lunar month, corresponding to the months of February and March. In fact, this Bumchu (Sacred Water) ceremony has been continuing for centuries and attracts thousands of devotees and pilgrimages from far across including Bhutan, Nepal, and entire Himalayas.

Ironically, a one-man Professor P S Ramakrishnan committee, of the JNU School of Environmental Sciences, submitted a report titled Ecology and Traditional Wisdom,  on October 9th 1995, to the government of Sikkim where he categorically stated, “on social, cultural, and religious considerations, apart from the rich bio-diversity and fragile ecology of the Yuksom valley region, I strongly recommend that no hydro power or other projects should be allowed on River Rathongchu, deemed extremely sacred by Buddhists”. Under the circumstances, how was the Tashiding HEP allotted to the Shiga Energy Ltd by the Sikkim Government and cleared by the MoEF is moot question.

Some of the other proposed projects that are mentioned in the SC-NBWL committee that are also coming up requiring the SC-NBWL clearance include the 300 MW Panan HEP, the Ting Ting HEP, besides the ones mentioned above, see the accompanying map from the SC-NBWL report. Other hydropower projects of Sikkim that are being considered by the MoEF for clearances and that are also close to the protected areas include: 63 MW Rolep HEP on Rangpo river in E Sikkim (5-6 km from Pangolakha and Kyongnosla WLS), 126 MW Ralong HEP (4.05 km from Kangchendzonga Biosphere Reserve and 1.8 km from Maenam Wildlife Sanctuary), 96 MW Chakung Chu HEP inn North Sikkim district (1.8 km from Kangchendzonga Biosphere Reserve). Other such possible projects include: 71 MW Sada Mangder, 60 MW Rangit III, among others.

Let us hope now following the SC-NBWL report, the MoEF will promptly order stoppage of illegally ongoing construction of the guilty HEPs, not waiting for the SC-NBWL committee to meet, since the new Standing Committee of the NBWL remains to be constituted after the term of the earlier committee ended. The evidence provided by the SC-NBWL committee is sufficient to take prompt action. The fact that the MoEF has not take action yet, weeks after submission of the SC-NBWL report speaks volumes about the possible collusion of the MoEF in this murky affair.

Soumik  Dutta (duttauni@gmail.com, with inputs from SANDRP)

END NOTES:


[1] WP 406/2004, Goa Foundation vs. Union of India, Order dated 04/12/2006: “The MoEF would also refer to the Standing Committee of the National Board for Wildlife, under Sections 5 (b) and 5 (c) (ii) of the Wild

Life (Protection) Act, the cases where environment clearance has already been granted where activities are within 10 km. zone

[2] Strangely, the Environment clearance letter for the project does not even mention the need for SC-NBWL clearance, see: http://environmentclearance.nic.in/Auth/openletter.aspx?EC=5766

[3] The Six monthly compliance report for Teesta III dated June 2013 also is quite on the issue of compliance with SC-NBWL clearance, see: http://environmentclearance.nic.in/writereaddata/Compliance/57_Teesta%20HEP-III%20_june2013.pdf, the condition for this was mentioned in the MoEF letter dated 30-04-2010 with additional condition: “Considering the proximity of Khangchendzonga National Park from the project site, clearance from the Standing Committee of theNational Board for Wildlife (NBWL) should be obtained”.

[4] For latest version of the compliance report, see: http://environmentclearance.nic.in/writereaddata/Compliance/34_Tashiding%20Six%20Monthly%20Compliance%20Report_May%202013.pdf. In this report, the column before the condition VIII says: NA (not available).

Dams · Hydropower · Uttarakhand

Uttarakhand Floods of June 2013: Curtain Raiser on the Events at NHPC’s 280 MW Dhauliganga HEP

box 2Days after walking down the Gori, we go to the Sub-Divisional Magistrate of Dharchula sub-division, Pramod Kumar, who is busy coordinating rescue and relief on a war-footing, but still has the courtesy to meet. On being asked by me regarding the sudden release of water by the 280 MW National Hydro-Power Corporation (NHPC) Dhauliganga Hydro-Electric Project (HEP, see below the layout of the project given on NHPC website) at Chirkila and the ensuing damage downstream, he confirms that he received an emergency call on the night of 16th June, 2013 from the NHPC, asking that they be permitted to release the impounded water in their reservoir, because it was in danger of breaching. Under normal circumstances they do not need his permission. He also confirms that he had refused, because the water level in the Mahakali main-stem was already flowing at danger-mark. NHPC went right ahead and opened their gates at full on the night of 16th June, without authorization or any prior warning to anybody[1] but their own office-residence complex 20 km downstream, at Dobat.

Map of Dhauliganga Dam Source: NHPC
Map of Dhauliganga Dam
Source: NHPC

Was this really an emergency, or was this purely opportunistic on the part of NHPC to take this opportunity early in the season to flush their reservoir that had been filled almost to half with bed-load and silt? We went looking for clues and information. I went to the NHPC office complex at Dobat, and met Bhuvan Chand Joshi, their Public Relations Officer. After giving me the spiel on how safe, and how green this so called run-of-the-river (ROR) project was, constructed by no less than the Japanese, the Germans and the Koreans put together[2], he admitted that their underground power-station was entirely flooded. Housed in a gigantic underground cavern about 100 meters long, four-storeys high at 40 meters and about 16 meters wide, river water had filled it right upto the control-room on the fourth floor. I had already been told by Kesar Singh Dhami, taxi owner of Dharchula, that on the 16th June itself, when he was ferrying the first batch of Kailash yatris to the road-head on their way up to Tibet, he had noticed the reservoir was filled high already with flood-waters, with large uprooted trees and other woody debris floating at the damsite. He confirms that water was being released, but only a small release, despite the dam being fuller than he had ever seen it.

I was also told by another employee of NHPC (who did not wish to be named) that what had gone wrong was that despite the high flows on the 15th and 16th June, the power-station continued with production of electricity as usual. In what seems to be an unbelievably short-sighted and poor design, the Tail-race Tunnel, from where water is released back into the river after having turned the turbines, is flushed into a tributary stream, the Ellagad. It was when Ellagad also pulsed, that it sent a train of bed-load debris down its lower reaches, effectively blocking the exit of the Tail-race Tunnel coming out of the powerhouse. The power house continued to take in water from the Head-race Tunnel intake to work their turbines, unaware that the exit for water had been blocked. It is only when the water blocked in the Tail-race Tunnel surged back up, burst through the turbine units and began flooding the powerhouse, that NHPC even know that something was wrong. It was then that the massive curved steel gates of the intake were slid shut, and the powerhouse evacuated. This was further confirmed by Joshi, PRO, who also said that the ‘matter was under investigation’ by their own team for organizational detail. The General Manager and the Chief Engineer of the Dhauliganga HEP had meanwhile been transferred out. It is not clear yet how soon after the powerhouse was flooded, that they opened the sluice gates at the bottom of the reservoir. Draining it was clearly beneficial for NHPC, but catastrophic for roads, bridges and habitations downstream, both in India and Nepal.

Dhauliganga before the disaster, with zero water flow downstream from the dam, killing a perennial river. Source: Author

If you look closely enough, there are two separate events here. The flooding of the powerhouse, and the ’emergency’ release of reservoir water. The powerhouse was not flooded because of too much water in the reservoir, but because it was in operation when its tail-race exit seven km downstream, is blocked-off because of poor short-sighted design[3]. They are then forced to close the gates of the intake, and abandon the powerhouse where water has reached the control-room on the fourth floor. The intake gates are now shut, but the flood waters continue to fill the reservoir further. They have already allowed the dam fill to a very high level, and here is the other curious factor.

The design of the Dhauliganga dam, is such that the dam has no provision for water to ‘overflow’ the dam safely, should undesired (even if foreseeable) levels be reached as they did this year. Or say if giant boulders block the narrow sluice gates at the bottom of the reservoir. Or in the real-time situation of what actually happened this year, the blocking of the tail-race tunnel leading to flooding of the powerhouse, hence requiring the shutting off of the intake, and losing the option of reducing reservoir levels more gradually and safely through two simultaneous releases. They then open the flood-gates. Clearly, one of two things have led to this decision:

One, letting the reservoir fill to a very high level is not out of the ordinary for NHPC; they do it every monsoon, as they had done on 16th June as well. It is not for many months in the year that they have enough water to run all four turbines. Despite the run-of-the-river label, Joshi confirmed that they were unable to let any water to continue to flow un-diverted in the river-channel during the winter-spring months (we have photographic evidence of this as well), or they would not have water to turn even one turbine! The mandatory requirement that every hydro-power dam in Uttarakhand be required to release at least 10% of the river’s minimum flows at all times (as greatly insufficient as such a small flow is for downstream life), it seems neither a consideration while justifying the economics of such projects, and neither is it complied to here. The use of the term run-of-the-river here, is plain deception.

The Dhauliganga Hydro-power dam, after being flushed of bed-load sediment Source: Author
The Dhauliganga Hydro-power dam, after being flushed of bed-load sediment
Source: Author

Their regular annual schedule for flushing the reservoir of bed-load and sediment is normally the 15th of July and the 31st of July every year. Here again, when the reservoir is full, and there is enough water to provide the pressure for increased and accelerated flow to flush the reservoir on a twice-annual basis. Both flushing schedules follow each other closely at peak-flow season, so that the flushing is as complete as possible, and there is enough of a monsoon season ahead to fill the reservoir up again before the winter-lean. The probable reason for preponing the flushing could be the chance of flushing some of the unusually high accumulation of bed-load debris that had come down in this years flood. What this meant to the efficiency of the power-station is one thing, but what it means to all life in and along the river, is quite another.

Two, that the faulty design of the dam, both in location of its tail-race exit as well as no provision for over-topping, in combination with the carelessness of allowing the reservoir to fill to such levels at the start of the monsoon, was responsible for the ’emergency’ catastrophic release.

Stitched photo of the bed of the drained Dhauliganga reservoir  Source: Author
Stitched photo of the bed of the drained Dhauliganga reservoir
Source: Author

The Dhauliganga HEP is located on the Darmayangti river, re-christened the Dhauliganga  river, just a couple of kilometers upstream of the confluence with the Mahakali at Tawaghat. In these two kilometers, the rivers flows (twice a year when it is allowed to, for a few hours) down steeply to the confluence which it meets at right-angles. With the Mahakali already in spate, coupled with the sudden release of more than 6 million cubic meters of stored water (Gross Storage Capacity), plus the flow of the river in flood (steadily increasing from 398 cubic meters a second on 15th June), as well as millions of tonnes of bed-load boulders and sediment, the damage downstream is clear to see. If you look at the fresh scour-level on the banks downstream of the dam, it is in places more than 15 meters higher than the flood-level flow of the DhauliRiver. The river added thousands of tonnes of even more debris when, because of the flood level it reached, it tore through, plucking high at the talus-cones on either bank, and at every turn. At the confluence at Tawaghat, there must have been something of a back-flood for some time (a common flood phenomenon where the high-flowing main-stem creates a temporary water-dam), because the water-level seems to have risen very high, taking away the bridge that connects the entire Kuti valley and the trade route to Tibet,   tearing away almost the entire village-market complex at Tawaghat, and destroying the road as well. The flood waters had clearly reached the top of the road because of the deposition of river-sand on it. When I walked this section days later, the river was only less than a meter below danger mark. Even so, it was flowing about 12 meters below the road! Further downstream, the destruction was more serious.

In order to understand the magnitude of this flood event, I ask Joshi of NHPC for flow-data of the Dhauli river between the 12th and the 18th of June. He goes off for some time and returns with a sheet of paper that has hand-scrawled 6 hourly flow volumes from 12th June, but stops short at 15th June. All the flow volumes between the 12th and the 15th were below 150 cubic meters a box 1second (cumecs), and at 12 am, on the night of the 15th June it jumps up to 389.92 cumecs. This is just the start of the flood. Joshi seems to balk right here, and says that they have not received data for the 16th June yet (the day I speak to him was the 8th of July), and that he may get it after a week or so. And anyway, he says, the powerhouse was abandoned from the night of the 16thJune, so getting data beyond that would be out of question. It is clear that Joshi was unwilling to give me flow-data for the duration of the flood-pulse. He had only minutes before informed me of how automated the whole operation was, and that it was possible for them to even operate the power-house sitting in their Dobat office-complex itself. The real scenario will be clear when we get flow data for the 16th and 17th of June.

According to NHPC, the Peak Flood Design for the Dhauliganga HEP is 3,210 cumecs, at a return interval of 100 years. That is the flow volumes that the dam is designed to be able to take without damage, at flood levels expected at least every hundred years. It is unlikely that flow volumes had reached almost 10 times the flow volumes of the flood on the 15th June at the damsite (389.92 cumecs). NHPC gets its flow data from an automated level-gauge at the reservoir, so it did not require anyone to take readings manually, even prior to abandoning the station. If unprecedented levels had indeed been reached, then why had they held on to water in the reservoir right till the night of the 16th June?  Please see the accompanying photographs, of the dam reservoir, empty of water. You can see at least two levels of cut-away terraces. The lower ones are alluvial terraces, consisting clearly of coarser gravels and cobbles deposited by the flowing river. The higher terraces, more visible high on the upper true-left bank in the photo, are remnant lacustrine (lake-bed) terraces, consisting of finer silts and sand, deposited by the stilled waters in the reservoir when it was full. This was the highest point of sediment accumulation in the reservoir prior to being flushed out. Clearly, at least 45% the reservoir was full of debris and sediment before NHPC flushed it. And if you look at the brown line on the concrete face of the dam, you see the level that the reservoir was allowed to fill upto, marked by the ‘bath-tub ring’ of floating bark and woody debris stuck there after draining.

Joshi tells me that when a delegation of people from Nepal came to NHPC to talk about the possible role that NHPC’s sudden release of water might have had on the flood that devastated Khalanga bazar at Darchula, he had told them that to the contrary, the dam had saved Nepal from great damage. “See how much debris is still behind our reservoir!” This was bare-faced misinformation. There are two aspects being denied here. One, that great masses of debris were actually flushed out from the lower-end of the reservoir on the night of 16th June, leading to greatly increased flood levels as well as erosive potential downstream, especially on the Nepal bank at Darchula, which bore the brunt of flushed debris centrifuged on the curve. As is evident from the photo of the dam-site above, most of the debris that has been flushed, is from the front-end of the reservoir only. And two, that all dams and reservoirs, despite some being able to flush out debris from a section of the reservoir, do actually hold back a great deal of bed-load as well as suspended sediment in the upper end of the reservoir. They impede the very essential flow of sediment down to the oceans. Look now at the geometry of bed-load debris in the stitched photo. Distortions from the wide-angle lens apart, it clearly shows a gradual slope, and a filling up of the bed-rock channel to form a wide, sloping flood-plain. Had it not been for the dam, the bed-load would have continued to fill up the bed-rock channel downstream at about the same angle, slowing the entire flow of water and entrained debris. It would not have been washed down catastrophically all the way down to Darchula, without the force of an additional 6 million m³ of stored water released suddenly.

Emmanuel Theophilus (etheophilus@gmail.com)


[1]    NHPC never gives warning of sudden releases. There is a notice painted on a board at Tawaghat, the first river-side habitation downstream, that warns people not to go anywhere near the river, because water may be released anytime.

[2]    Kajima Construction Corporation Ltd of Japan, Daewoo Engineering and Construction Company of Korea, and Bauer Maschinen of Germany.

[3]    How a tail-race exit could be planned on the Ellagad stream which is very steep and unstable, full of debris from a service tunnel, and highly ‘flashy’, is indicative of poor design and of lax design approval mechanisms.

Arunachal Pradesh · Environment Impact Assessment · Expert Appraisal Committee · Hydropower

Subansiri Basin Study – Another Chapter of Environment Subversion in Northeast

The Study The study has been done by IRG Systems South Asia Private Limited (http://www.irgssa.com/, a subsidiary of US based IRG Systems) and http://www.eqmsindia.com/[i]. It is supposed to be a Cumulative Impact Assessment of 19 HEPs planned in the basin, out of which PFRs of 7 are available, DPR of two, and one of which, the 2000 MW Subansiri Lower HEP is under construction.

Subversion of Environment Governance in the Subansiri basin While looking at this basin study, the subversion of environment governance in Subansiri basin this very millennia should be kept in mind. A glimpse of it is provided in Annexure 1. In fact, one of the key conditions of environmental clearance to the 2000 MW Lower Subansiri HEP was that no more projects will be taken up in the basin upstream of the Lower Subansiri HEP, which essentially would mean no more projects in the basin, since LSHEP is close to the confluence of the Subansiri River with Brahmaputra River. That condition was also part of the Supreme Court order in 2004. The need for a carrying capacity study was also stressed in the National Board of Wild Life discussions. We still do not have one. In a sense, the Subansiri basin is seeing the consequences of that subversion.

Map of Subansiri RIver Basin  Source: https://sandrp.in/basin_maps/Subansiri_River_Basin.pdf
Map of Subansiri RIver Basin
Source: https://sandrp.in/basin_maps/Subansiri_River_Basin.pdf

Information in public domain not known to consultants The report does not even state that Middle Subansiri dam have also been recommended TOR in 41st EAC meeting in Sept 2010. This project will require 3180 ha of land, including 1333 Ha forest land, and 2867 ha area under submergence. Even about Upper Subansiri, the consultants do not know the area of forest land required (2170 ha). So the consultants have not used even the information available in public domain in EAC meetings.

Study based on flawed and incomplete Lohit Basin Study The Study claims that it is based on Lohit Basin Study done by WAPCOS. Lohit Basin Study is an extremely flawed attempt and does not assess cumulative impacts of the cascade projects. Civil society has written about this to the EAC and the EAC itself has considered the study twice (53rd and 65th EAC Meetings), and has not accepted the study, but has raised several doubts. Any study based on a flawed model like Lohit Basin Study should not be acceptable.

A house in the upstream of Subansiri River  Source: http://cooperfreeman.blogspot.in/2012/12/the-wild-east-epic.html
A house in the upstream of Subansiri River
Source: http://cooperfreeman.blogspot.in/2012/12/the-wild-east-epic.html

No mention of Social impacts Major limitation of the study has been absolutely no discussion on the severe social impacts due to cumulative forest felling, flux of population, submergence, livelihoods like riparian farming and fishing, etc. Though this has been pointed out by the TAC in its meeting and field visit, the report does not reflect this.

Some key Impacts Some of the impacts highlighted by the study based on incomplete information about HEPs are:

Þ    The length of the river Subansiri is 375 km up to its outfall in the Brahamaputra River. Approximately 212.51 km total length of Subansiri will be affected due to only 8 of the proposed 19 HEPs in Subansiri River basin.

Þ    Total area brought under submergence for dam and other project requirements is approx. 10, 032 ha of eight proposed HEPs. The extent of loss of forest in rest of the 9 projects is not available.

Þ    62 species belonging to Mammals (out of 105 reported species), 50 Aves (out of 175 reported species) and 2 amphibians (out of 6 reported species) in Subansiri Basin are listed in Schedules of Wildlife Protection Act, 1972 (as amended till date).

Þ    99 species belonging to Mammals (out of 105 reported species), 57 species belonging to Aves (out of 175 reported species), 1 Reptilian (out of 19 reported species), 2 Amphibians (out of 6 reported species), 28 fishes (out of 32 reported species), 25 species belonging to Odonata of Insecta fauna group (out of 28 reported species) are reported to be assessed as per IUCN’s threatened categories.

Even this incomplete and partial list of impacts should give an idea of the massive impacts that are in store for the basin.

Cumulative impacts NOT ASSESSED Specifically, some of the cumulative impacts that the report has not assessed at all or not adequately include:

1. Cumulative impact of blasting of so many tunnels on various aspects as also blasting for other project components.

2. Cumulative impact of mining of various materials required for the projects (sand, boulders, coarse and fine granules, etc.)

3. Cumulative impact of muck dumping into rivers (the normal practice of project developers) and also of also muck dumping done properly, if at all.

Subansiri River in the Upper Reaches  Source: Lovely Arunachal
Subansiri River in the Upper Reaches
Source: Lovely Arunachal

4. Changes in sedimentation at various points within project, at various points within a day, season, year, over the years and cumulatively across the basin and impacts thereof.

5. Cumulative impact on aquatic and terrestrial flora and fauna across the basin due to all the proposed projects.

6. Cumulative impact of the projects on disaster potential in the river basin, due to construction and also operation at various stages, say on landslides, flash floods, etc.

7. Cumulative dam safety issue due to cascade of projects.

8. Cumulative change in flood characteristics of the river due to so many projects.

9. Cumulative impacts due to peaking power generation due to so many projects.

10. Cumulative sociological impact of so many projects on local communities and society.

11. Cumulative impact on hydrological flows, at various points within project, at various points within a day, season, year, over the years and cumulatively across the basin and impacts thereof. This will include impacts on various hydrological elements including springs, tributaries, groundwater aquifers, etc. This will include accessing documents to see what the situation BEFORE project and would be after. The report has failed to do ALL THIS.

12. Impact of silt laden water into the river channel downstream from the dam, and how this gets accumulated across the non-monsoon months and what happens to it. This again needs to be assessed singly and cumulatively for all projects.

13. Impact of release of silt free water into the river downstream from the power house and impact thereof on the geo morphology, erosion, stability of structures etc, singly and cumulatively.

14. Impact on Green House Gas emissions, project wise and cumulatively. No attempt is made for this.

15. Impact of differential water flow downstream from power house in non-monsoon months, with sudden release of heavy flows during peaking/ power generation hours and no releases during other times.

16. Cumulative impact of all the project components (dam, tunnels, blasting, power house, muck dumping, mining, road building, township building, deforestation, transmission lines, etc.,) for a project and then adding for various projects. Same should also be done for the periods during construction, operation and decommissioning phases of the projects.

17. Cumulative impact of deforestation due to various projects.

18. Cumulative impact of non compliance of the environment norms, laws, Environment clearance and forest clearance conditions and environment management plans. Such an assessment should also have analysed the quality of EIA report done for the Subansiri Lower hydropower project.

Wrong, misleading statements in Report There are a very large number of wrong and misleading statements in the report. Below we have given some, along with comment on each of them, this list is only for illustrative purposes.

Sr No

Statement in CIA

Comment

1 “During the monsoon period there will be significant discharge in Brahmaputra River. The peaking discharge of these hydroelectric projects which are quite less in comparison to Brahmaputra discharge will hardly have any impact on Brahmaputra.” This is a misleading statement. It also needs to be assessed what will be the impact on specific stretches of Subansiri river. Secondly, the projects are not likely to operate in peaking mode in monsoon.
2 “However, some impact in form of flow regulation can be expected during the non-monsoon peaking from these projects.” This is not correct statement as the impact of non-monsoon peaking is likely to be of many different kinds, besides “flow regulation” as the document describes.
3 “Further, during the non-monsoon period the peaking discharge release of the projects in upper reaches of Subansiri basin will be utilized by the project at lower reaches of the basin and net peaking discharge from the lower most project of the basin in general will be the governing one for any impact study.” This is again wrong. What about the impact of such peaking on rivers between the projects?
4 “The construction of the proposed cascade development of HEPs in Subansiri basin will reduce water flow, especially during dry months, in the intervening stretch between the Head Race Tunnel (HRT) site and the discharge point of Tail Race Tunnel (TRT).” This statement seems to indicate that the consultants have poor knowledge or understanding of the functioning of the hydropower projects. HRT is not one location, it is a length. So it does not make sense to say “between HRT and the discharge point of TRT”.
5 “For mature fish, upstream migration would not be feasible. This is going to be the major adverse impact of the project. Therefore, provision of fish ladder can be made in the proposed dams.” This is simplistic statement without considering the height of the various dams (124 m high Nalo HEP dam, 237 m high Upper Subansiri HEP dam, 222 m high Middle Subansiri HEP dam), feasibility of fish ladders what can be optimum design, for which fish species, etc.
6 “…water release in lean season for fishes may be kept between 10-15% for migration and sustaining ecological functions except Hiya and Nyepin HEP. Therefore, it is suggested that the minimum 20% water flow in lean season may be maintained at Hiya and Nyepin HEP for fish migration.” This conclusion seems unfounded, the water release suggested is even lower than the minimum norms that EAC of MoEF follows.

Viability not assessed The report concludes: “The next steps include overall assessment of the impacts on account of hydropower development in the basin, which will be described in draft final report.”

One of the key objective of the Cumulative Impact assessment is to assess how many of the planned projects are viable considering the impacts, hydrology, geology, forests, biodiversity, carrying capacity and society. The consultants have not even applied their mind to key objective in this study. They seem to assume that all the proposed projects can and should come up and are all viable. It seems the consultant has not understood the basic objectives of CIA. The least the consultant could have said is that further projects should not be taken up for consideration till all the information is available and full and proper Cumulative impact assessment is done.

The consultants have also not looked at the need for free flowing stretches of rivers between the projects.

Section on Environmental Flows (Chapter 4 and 9): The section on Environmental flows is one of the weakest and most problematic sections of the report, despite the fact that the Executive summary talks about it as being one of the most crucial aspects.

The study does not use any globally accepted methodology for calculating eflows, but uses HEC RAS model, without any justification. The study has not been able to do even a literature review of methodologies of eflows used in India and concludes that “No information/criteria are available for India regarding requirement of minimum flow from various angles such as ecology, environment, human needs such as washing and bathing, fisheries etc.”

This is unacceptable as EAC itself has been recommending Building Block Methodology for calculating eflows which has been used (very faultily, but nonetheless) by basin studies even like Lohit, on which this study is supposedly based. EAC has also been following certain norms about E flow stipulations. CWC itself has said that minimum 20% flow is required in all seasons in all rivers. BK Chaturvedi committee has recently stipulated 50% e-flows in lean season and 30% in monsoon on daily changing basis.

The assumption of the study in its chapter on Environmental Flows that ‘most critical reach is till the time first tributary meets the river” is completely wrong. The study should concentrate at releasing optimum eflows from the barrage, without considering tributary contribution as an excuse.

First step of any robust eflows exercise is to set objectives. But the study does not even refer to this and generates huge tables for water depths, flow velocity, etc., for releases ranging from 10% lean season flow to 100% lean season flow.

After this extensive analysis without any objective setting, the study, without any justification (the justification for snow trout used is extremely flawed. Trouts migrate twice in a year and when they migrate in post monsoon months, the depth and velocity needed is much higher than the recommended 10% lean season flow) recommends “In view of the above-said modeling results, water release in lean season for fishes maybe kept between 10-15% for migration and sustaining ecological functions except Hiya and Nyepin HEP. Therefore, it is suggested that the minimum 20-25% water flow in lean season may be maintained at all HEP for fish migration and ecological balance.”

The study does not recommend any monsoon flows. Neither does it study impact of hydro peaking on downstream ecosystems.

Shockingly, the study does not even stick with this 20-25% lean season flow recommendation (20-25% of what? Average lean season flow? Three consecutive leanest months? The study does not explain this). In fact in Chapter 9 on Environmental Flows, the final recommendation is: “Therefore, it is suggested that the minimum 20-25% water flow in lean season may be maintained at Hiya and Nyepin  HEP or all other locations for fish migration.” (emphasis added)

So it is unclear if the study recommends 20-25% lean season flows or 10-15% lean season flows. This is a very flawed approach to a critical topic like eflows.

The study keeps mentioning ‘minimum flows’ nomenclature, which shows the flawed understanding of the consultants about e-flows.

The entire eflows section has to be reworked, objectives have to be set, methodology like Building Block Methodology has to be used with wide participation, including from Assam. Such exercises have been performed in the past and members of the current EAC like Dr. K.D. Joshi from CIFRI have been a part of this. In this case, EAC cannot accept flawed eflows studies like this. (DR. K D. Joshi has been a part of a study done by WWF to arrive at eflows through BBM methodology for Ganga in Allahabad during Kumbh: Environmental Flows for Kumbh 2013 at Triveni Sangam, Allahabad and has been a co author of this report)

Chocolate Mahseer in Subansiri  Source: http://www.flickr.com/photos/8355947@N05/7501485268/
Chocolate Mahseer in Subansiri
Source: http://www.flickr.com/photos/8355947@N05/7501485268/

Mockery of rich Subansiri Fisheries Subansiri has some of the richest riverine fisheries in India. The river has over 171 fish species, including some species new to science, and forms an important component of livelihood and nutritional security in the downstream stretches in Assam.

But the study makes a mockery of this saying that the livelihoods dependence on fisheries is negligible. The entire Chapter on Fisheries needs to be reworked to include impacts on fisheries in the downstream upto Majuli Islands in Assam at least.

No mention of National Aquatic Animal! Subansiri is one of the only tributaries of Brahmaputra with a resident population of the endangered Gangetic Dolphin, which is also the National aquatic animal of India (Baruah et al, 2012, Grave Danger for the Ganges Dolphin (Platanista ganegtica) in the Subansiri River due to large Hydroelectric Projecthttp://link.springer.com/article/10.1007/s10669-011-9375-0#).

Shockingly, the Basin Study does not even mention Gangetic Dolphin once in the entire study, let alone making recommendations to protect this specie!

Gangetic Dolphin is important not only from the ecological perspective, but also socio cultural perspective. Many fisher folk in Assam co-fish with the Gangetic River Dolphin. These intricate socio ecological links do not find any mention in the Basin study, which is unacceptable.

Agitation Against Lower Subansiri Dam in Assam Source: SANDRP
Agitation Against Lower Subansiri Dam in Assam
Source: SANDRP

Lessons from Lower Subansiri Project not learnt A massive agitation is ongoing in Assam against the under construction 2000 MW Subansiri Lower HEP. The people had to resort to this agitation since the Lower Subansiri HEP was going ahead without studying or resolving basic downstream, flood and safety issues. The work on the project has been stopped since December 2011, for 22 months now. In the meantime several committee have been set up, several changes in the project has been accepted. However, looking at this shoddy CIA, it seems no lessons have been learnt from this ongoing episode. This study does not even acknowledge the reality of this agitation and the issues that the agitation has thrown up. There is no reflection of the issues here in this study that is agitating the people who are stood up against the Lower Subansiri HEP. The same people will also face adverse impacts of the large number of additional projects planned in the Subansiri basin. If the issues raised by these agitating people are not resolved in credible way, the events now unfolding in Assam will continue to plague the other planned projects too.

Conclusion From the above it is clear that this is far from satisfactory report. The report has not done proper cumulative assessment on most aspects. It has not even used information available in public domain on a number of projects. It does not seem to the aware of the history of the environmental mis-governance in the SubansiriBasin as narrated in brief in Annexure 1. For most projects basic information is lacking. Considering the track record of Central Water Commission functioning as lobby FOR big dams, such a study should have never been given to CWC. One of the reasons the study was assigned by the EAC to the Central Water Commission was that the CWC is supposed to have expertise in hydrological issues, and also can take care of the interstate issues. However, the study has NOT been done by CWC, but by consultants hired by CWC, so CWC seems to have no role in this except hiring consultant. So the basic purpose of giving the study to CWC by EAC has not been served. Secondly the choice of consultants done by the CWC seems to be improper. Hence we have a shoddy piece of work. This study cannot be useful as CIA and it may be better for EAC to ask MoEF for a more appropriate body to do such a study. In any case, the current study is not of acceptable quality.

South Asia Network on Dams, Rivers & People (https://sandrp.in/https://sandrp.wordpress.com/)

ANNEXURE 1

Set Conditions to be waived Later – The MoEF way of Environmental Governance

In 2002, the 2,000 MW Lower Subansiri hydroelectric project on the Assam-Arunachal Pradesh border came for approval to the Standing Committee of the Indian Board for Wildlife (now called the National Board for Wildlife) as a part of the Tale Valley Sanctuary in AP was getting submerged in the project. The total area to be impacted was 3,739.9 ha which also included notified reserved forests in Arunachal Pradesh and Assam.  The Standing Committee observed that important wildlife habitats and species well beyond the Tale Valley Sanctuary, both in the upstream and downstream areas, would be affected (e.g. a crucial elephant corridor, Gangetic river dolphins) and that the Environmental Impact Assessment studies were of a very poor quality. However, despite serious objections raised by non-official members including Bittu Sahgal, Editor, Sanctuary, Valmik Thapar, M.K. Ranjitsinh and the BNHS, the Ministry of Environment & Forests (MoEF) bulldozed the clearance through in a May 2003 meeting of the IBWL Standing Committee. Thus a project, which did not deserve to receive clearance, was pushed through with certain stringent conditions imposed (Neeraj Vagholikar, Sanctuary Asia, April 2009).

Lower Subansiri HEP Source: The Hindu
Lower Subansiri Dam
Source: The Hindu

The EC given to the project was challenged in Supreme Court (SC) by Dr L.M Nath, a former member of the Indian Board for Wildlife. Nath pleaded, these pristine rich and dense forests classified as tropical moist evergreen forest, are among the finest in the country. Further the surveys conducted by the Botanical Survey of India and the Zoological Survey of India were found to be extremely poor quality. The Application mentions that the Additional DG of Forests (Wildlife) was of the view that the survey reports of the BSI and ZSI reports were not acceptable to him because these organisations had merely spent five days in the field and produced a report of no significance.

The SC gave its final verdict on 19-4-2004, in which the Court upheld the EC given by MoEF to NHPC but with direction to fulfill some important conditions. Out these conditions there were two conditions which were very significant – “The Reserve Forest area that forms part of the catchment of the Lower Subansri including the reservoir should be declared as a National Park/ Sanctuary. NHPC will provide funds for the survey and demarcation of the same.”, and “There would be no construction of dam upstream of the Subansri River in future.” These conditions were also mentioned in the original EC given to the project in 2003.

In May 2005, two years after the EC was given the Arunachal Pradesh govt and NHPC approached the SC to waive or modify the above two conditions. The state government calimed that following these conditions would imply loss of opportunity to develop 16 mega dams in the upstream of Lower Subansiri (this including 1,600 MW Middle Subansiri and 2,000 MW Upper Subansiri to be developed by NHPC). The SC sent it back to National Board for Wildlife to review the conditions.

The petition was done strategically. “The strategy of the dam proponents is simple. They raised no objection to the terms until the construction of the Lower Subansiri project had proceeded beyond a point when it could have been cancelled. Armed with this fait accompli, they asked for a review of the clauses on the very basis on which the original clearance – laid down by members who were subsequently dropped from the wildlife board – was granted.”[ii]

Then nonofficial members of NBWL expressed their dissent to the proposal. In a May 2008 communication to the Chairman of the NBWL Standing Committee, member Dr. Bibhab Talukdar observed: “If the Standing Committee agrees to waive the conditions, we would be setting a dangerous precedent and sending a wrong signal regarding the credibility of decision-making by us. This would mean that projects impacting rich wildlife habitats can receive clearances based on stringent conditions, only to be up for review later. Such an approach is undesirable both from a perspective of good governance as well as the long-term interest of wildlife in the country.”

Dr. Asad Rahmani of the BNHS, who was part of a sub-committee of the NBWL Standing Committee conducting a site visit to the project area, stated in his report: “Under no circumstances should new projects be allowed in the Subansiri river basin until an advance cumulative assessment of proposed projects and a carrying capacity study of the Subansiri river basin are completed.”

In the December 12 2008 meeting of NBWL Standing Committee, even after these dissenting opinions from nonofficial members MoEF managed to do a dilution of the above two conditions. Assam that time was witnessing a major protest concerning the downstream impacts of Lower Subansiri HEP but it was not even consulted. Shockingly the “no dam upstream” condition was removed and it was decided that “any proposal in the upstream of the SubansiriRiver would be considered independently on its merit by the Standing Committee as and when submitted by the proponents”.

Now the Arunachal Pradesh government needs to declare a smaller area of 168 sq. km. as a sanctuary and “make serious efforts” to bring an additional 332 sq. km. reserved forest under the category of Conservation Reserve (CR) in consultation with the MoEF. The latter part of the condition (declaration of CR) is non-enforceable because of the choice of words. Even the demand to at least conduct an advanced cumulative impact assessment of proposed projects and a carrying capacity study of the Subansiri river basin has been ignored[iii].

As Bittu Sahgal, Editor, Sanctuary Asia says, “The Lower Subansiri is one such, where the PMO has placed a very dubious role in forcing clearances, agreeing to clearance conditions and then starting the project, only to loosen the environmental conditions. In this whole scam the Zoological Survey of India and the Botanical Survey of India have been co-conspirators that have suppressed the ecological value of the forests to facilitate the building of the dam, which will drown pristine elephant, tiger and clouded leopard forests and cause havoc downstream as well.”

The above sequence of events are very pertinent to remember as we see the Subansiri basin study.

END NOTES:


[i] Website says: “More than 200 successful environmental Impact Assessment Clearance from Ministry of Environment & Forests, Government of India for Industry, Infrastructure & Construction projects” Sounds strange from an EIA consultant.

[iii] For more details please see – “Forest Case Update”, Issue 1, June 2004 and “The Subansiri Subversion” by Neeraj Vagholikar published in Sanctuary Asia, April 2009 issue

Assam · Dam Induced Flood Disaster · Dams · Expert Appraisal Committee · Hydropower

Lower Kopili HEP: Oustanding issues that must be resolved before EAC can consider the project

The Lower Kopili Hydro Electric Project(HEP) will be considered for TOR clearance in the forthcoming Expert Appraisal Committee(EAC) meeting on September 23-24, 2013. This project was first discussed in the 63rd EAC meeting held on 12-13th October, 2012. It was again discussed in the 65th meeting of the EAC held on 26-27th December, 2012 for approval of Terms of Reference (TOR) for the Environmental Impact Assessment (EIA). EAC had sent back the project proposal seeking additional information/clarification on several issues. There were several critical issues which were not raised by the EAC. We have made a submission to EAC pointing out issues which need urgent attention.

Background of Hydroelectricity Generation on Kopili River

The Kopili River: Kopili is a south bank tributary of Brahmaputra which originates in the Borail range mountains in Meghalaya at an altitude of about 1600 m and has a total length of 290 km up to its confluence with Brahmaputra. Its basin is bound by the Jaintia Hills in the west and the South Cachar and Mikir Hills in the east. Kharkor, Myntriang, Dinar, Longsom, Amring, Umrong, Longku and Langkri are its major tributaries in its upper reaches.

After entering Assam the Kopili separates the Karbi Anglong district from the Dima Hasao North Cachar Hills district up to its confluence with Diyung River on its right at 135 km. After the confluence with Diyung, Kopili flows into the Nagaon district in a north-westerly direction. The Jamuna River with a catchment of 3960 km2 flows to the Kopili at Jamunamukh. The river then flows in western direction, and further downstream, the Umkhen-Borapani River which rises in the Shillong plateau and drains an area of 2038 km2 joins Kopili at a distance of 254 km from the left. The Killing River, known as Umiam in its upper reaches draining an area of about 1445 km2, flows into Kopili from the left at about 280 km. The Kopili River finally flows to Kalang, a spill channel of Brahmaputra, near Hatimukh after traversing a distance of 290 km2. The total catchment of Kopili River is about 16,421km2.

Kopili HEP: The Kopili Hydro Electric Project (HEP) has two dams, one on the Kopili River and one on its tributary Umrang stream. This project was developed by NEEPCO (Northeast Electric Power Corporation Ltd.). The first dam with 66 m height on the Kopli River is known as Khndong dam and the second one with 30 m height is known as Kopili dam located at Umranso.  Water from the Khandong reservoir is utilised in the Khandong power station through a 2852 m long tunnel to generate 50 MW (2 X 25 MW) of power. The tail water from this powerhouse is led to the Umrong reservoir. The water from Umrong reservoir is taken through a 5473 m long tunnel to the Kopili power station to generate 200 MW (4 X 50 MW) of power. An additional 25MW was added to the Khandong dam in the Stage two of the Kopili HEP, making the total power generation 275 MW. Both Khandong and Kopili dams are concrete gravity dams. The first unit of this Kopili HEP was commissioned in March 1984. Additional unit under stage two was commissioned in July, 2004.

Proposed Lower Kopili HEP: The proposed Lower Kopili HEP is coming up in Boro Longku village in Dima Hasao district. The project is developed by Assam Power Generation Corporation Limited (APGCL). The Lower Kopili dam will be a concrete gravity dam with 70.13 m high dam wall. This project will also have two power houses and the first power house, or the main power house will have an installed capacity of 110 MW (2X55MW). An auxiliary Power House with an installed capacity of 10 MW (2×2.5 MW+1×5 MW) has been planned  at  the  toe  of  the  dam  for  utilizing  the  mandatory  releases  for  ecological purposes, making the total installed capacity 120 MW. The Head Race Tunnel(HRT) of the project will be 7.25 m in diameter and 3.6 km long. The total land required for this project will be 1577 ha out of which according to the revised PFR and Form-I 552 ha will fall under submergence. But the old PFR and Form-I had mentioned the size of the submergence area as 620ha. The  free flowing river  stretch  between  Full Reservoir Level  (FRL) of  Lower  Kopili  HEP  and  Tail Water Level (TWL) of upstream  Kopili  HEP  is  about  6  km.

The water available at Lower Kopili dam site will consists of the following components:

1.   Tailrace releases from Kopili Power Station (4 x 50 MW)

2.   Inflow from intermediate catchment between Khandong and Longku Dam site

3.   Spill from Khandong and Umrong Reservoir.

Projects in Cascade on Kopili River

Some Key Issues Requiring Urgent Attention

After thoroughly going through Pre Feasibility Report (PFR) and Form-I of the proposed Lower Kopili HEP we have found that following issues have not been adequately dealt with by the project authorities. Infact some of them have not even been mentioned at all. EAC should not give TOR clearance to the project without satisfactory resolution of these issues.

Dam induced Flood: Experiences of the people living in downstream suggest that floods have become more recurrent after construction of the dam. The Kopili dam has changed the character of flood in the river downstream for the worse. Before the construction of Kopili dam, floods occurred mainly during monsoon season. Increase in water volume due to heavy rains used to be the reason for flood. These were normal floods which occurred not more than two or three times a year. But after the construction of the dam, number of artificial floods occurring in a year has gone upto 5- 6 times. These floods mainly occurred from the month of August to the first one or two weeks of November. Government of Assam never made an attempt to investigate the source of these floods (this information is from a field visit done to the area). 

In the catastrophic floods of 2004, out of 140 revenue villages of Kampur circle of Nagaon district 132 were affected by floods with area of 135.12 sq. miles. Due to these floods 1,92,000 people were temporarily displaced. These floods also took the lives of 4 people. Even government had confirmed that the main reason for the devastation in these Nagaon and Morigaon districts was the release of the water from the NEEPCO’s Kopili project. The team that was deputed by the government found that water level of the Khandong reservoir went up to 727.70 meters against the FRL of 719.30 meters on 18th July 2004, which rolled down and led to catastrophic disaster. Flood release from the dam happened without prior warning and affected the whole valley. Kampur is one of the towns located in the downstream of Kopili dam where people were give only 2 hours to evacuate the area and move to nearby relief camps.  July 18 is less than midway through the monsoon and questions arise why was the dam allowed to be filled up so soon which had led to such disaster. Had the dam operations were conducted properly the disaster could have possibly been avoided.

The issue of flash floods in Kopili River was raised in the Assam state assembly. On 8th November, 2010 former Chief Minister of Assam Mr. Prafulla Kumar Mahanta, an MLA from Nagaon district made a call attention motion in the Legislative assembly on the issue flash floods in Kopili. He stated the NEEPCO is responsible for the flash floods in the Kopili River.[1] Then Water Resource Minister Prithvi Majhi in his reply accepted this claim by saying that “the government would take up the matter of providing prior warning before release of excess water with the NEEPCO authorities.”  From the above experiences of flood in Kopili River, it is clear that after the construction of the Kopili HEP (Hydroelectric Project) flood ferocity had increased in the downstream. In such situation construction of another dam in the immediate downstream of previous dam can worsen the flood scenario.

Besides, The Kopili reservoir of the Khandong dam is located at 82.5 km downstream from the origin of Kopili River. A major tributary Myntang with 512 sq kmcatchment joins Kopili at 86 km from origin[2]. This is one of the tributaries in the upstream of proposed Longku dam site. In rainy season excess of rains in the catchment of these streams can also lead to spillovers in the proposed dam itself. The PFR does not look into the cumulative impact of the operation of the two dams on the downstream riverine area.

Spillway Capacity Inadequate at Lower Kopili HEP: As per the PFR, the design spillway capacity of the proposed Lower Kopili project with catchment of 2106 sq km is 16110 cumecs. Compare this with the spillway capacity of the upstream Khandong dam on the same Kopili river with catchment area of 1256 sq km being 15471.3 cumecs. It is clear that the design spillway capacity of the proposed Lower Kopili Project is inadequate.

Acid Contamination due to Opencast Mining threatens Viability of Lower Kopili: In the item 9.9 of the Form-I it has been mentioned that the acidic mine discharge in the upper reaches of the Kopili catchment is posing serious threats to the existing Kopili HEP. The PFR states “The identified acid mine discharge has been reported to cause constant erosion/ corrosion of critical hydropower equipments leading to frequent outages of the power plants under Kopili HEP.” The minutes of 9th TCC (Technical Coordination Committee) & 9th North East Region Power Committee Meetings held on 11-12th August, 2010, stated “The Kopili HE Plant has faced an extraordinary and unprecedented situation owing to acidic nature of the reservoir water. Prima facie, the acidification of the reservoir water is caused due to unscientific coal mining in the catchment area as revealed by study through GSI, NER, Shillong. The increased wear and tear on the underwater metal parts of the Plant due to corrosive action of the acidic water has led to the increase in the number of breakdowns.” The minutes also mentioned “It is pertinent to mention here that, although massive repairing work has been carried out by NEEPCO as temporary measures; an integrated, interdisciplinary approach for preventing / tackling acidification at source must be opted for survival of the Plant.” The acidic contamination due to open cast mining is such that no living organisms could be found in the downstream of Kopili river up to Kheroni.[3] The situation is quite alarming as the PH value of the water has come down from 5.5 to 3.2 due to acidic contamination which is unfit for human consumption. State Power Minster was very much aware of the situation and expressing concerns over this he had asked the center to take up this issue with Meghalaya.[4] The PFR should have given detailed account of implication of this on the proposed Lower Kopili HEP and further downstream, but has not done that.

PFR overlooks Kopili Fault Line: The PFR of the proposed Lower Kopili HEP does not mention about the Kopili fault line[5]. In recent studies done in the Kopili river basin it has been found that the Kopili fault extends  from  western  part  of  Manipur  up  to  the  tri-junction  of  Bhutan,  Arunachal Pradesh  and Assam, covers  a  distance  of about  400 km. During the last 140 years, the Kopili fault has experienced 2 earthquakes of magnitude greater than 7 in R.S., three of magnitude 6 to 7 in R.S. and several of magnitude 4.5 to 6 in R.S.[6]   The study concludes that the North East region, more specially the Kopili Fault area is a geologically unstable region, surrounded by faults and lineaments and seduction zones in the east.  But the PFR of Lower Kopili, overlooking this issue states that there are only two minor faults in this area and both of them are much beyond the project area. This clearly wrong and misleading on the part of Lower Kopili PFR.

Besides, some of the EAC statements are not complete and stand in contradiction to each other. The EAC said that as the site specific seismic study had been completed by IIT Roorkee and considered it appropriate for 120 MW project. But it also mentioned “The project specific geo-morphological and neo-tectonic mapping has not been done so far. As the project area falls under the active seismic zone where the Disang-Naga Thrust and Dhauki fault merge which triggers high seismic risk, the proponent is to monitor the MEQ studies by installing a 3-4 seismograph network for a period of one year.” When EAC is aware of these site specific details, allowing an additional big dam in the area will only to increase disaster potential in the area. EAC needs to keep this in mind while considering this new dam.

Issues Tribal Land Relations: In the item 2.1 of the Form 1 the project authorities have stated that the 620 ha that will be submerged due to this project consists of medium to high density vegetation, scrubs open and barren land etc. But Dima Hasao people have expressed their fears of not getting proper rehabilitation.[7] The project seems to ignore this fact in the form 1. There can another reason also for the stating the submerged land as government land because the land holdings may not same as the ‘patta’ lands.[8] Besides, the area which has been considered for the construction of the dam is inhabited by Dimasa people who mainly depended on the system of shifting cultivation.[9] It is to be noted that in shifting cultivation there a cultivator cannot exercise permanent ownership over the land.

Defining ‘Other Forests’: The project as stated in item 1.1 of form 1 will also submerge 65 ha cultivation land. In the same item it is mentioned that an area of 585 ha will be submerged and this area has been mentioned as ‘other forests’. But the Form 1 did not define what this ‘other forests’ are or what they consists.

Impact on the Local People: In a memorandum submitted jointly by the Karbi Students’ Association (KSA), Sominder Kabi Amei (SKA) and Karbi Nimso Chingthur Asong (KNCA), to the State Power Minster Mr. Praduyut Bordoloi, the association demanded first preference in terms of employment should be given to the locally affected people. But the track record of dam building companies is very poor in this regard. The local people did not get promised employment and other benefits the in the Kopili project which came up in 1970s, 1980s and 1990s. On 20th March 2012, the Dimasa Students’ Union, Dimasa Welfare Association, Karbi Students’ Association and Sengia Tularam Club called for a 48 hours Umrangso bandh seeking “60 per cent of technical and non-technical posts in the project should be reserved for the local tribal populace, 100 per cent reservation for local tribal youths for Grade III and Grade IV posts, free electricity for locals, free treatment facilities in NEEPCO-run hospitals and so on.”[10] This is very crucial issues but surprisingly it finds no place in the PFR document.

Why the size of forest area significantly reduced: In the revised Form I and PFR, submitted on 23 August 2013, Section 1.1 mentioned that out of 1577 ha which is the total land required for the project, 552 ha will fall under submergence and 340 ha forest land will  be submerged in the reservoir. But the previous Form I and PFR, submitted on 14th November 2012, stated in the same section that the land falling under submergence and land converted into reservoir area is same i.e. 620 ha. The revised document does not give any rationale for reducing size of submergence area and reservoir area. It is also surprising to note that in the revised document, under the section “Impacts due to damming of river” in page 55, the old figures of submergence has been reiterated – “The  damming  of  river  Kopili  due  to  the  proposed  hydroelectric  project  in  creation  of  620  ha  of submergence  area.” So the new documents submitted in Aug 2013 have serious contradictions.

Issues Need to be Included in EIA report

Since several critical issues were not included in the previously submitted document, we have listed out the following issue which should be included in the Environment Impact Assessment (EIA) study of the proposed Lower Kopili HEP. Without detail analysis of all these issues EIA cannot be considered as complete.

Downstream Impact Assessment:  Downstream impact assessment is a burning problem in Assam. The state has already witnessed huge protests against dams due to lack of proper downstream impact assessment. In case of proposed Lower Kopili HEP, the EIA document should do a proper downstream impact assessment. In order to do a thorough downstream impact assessment, the EIA will have to go beyond the 10 km radius and assess the full downstream area. In case of Lower Kopili, going beyond 10 km downstream becomes all the more significant because major part of the Kopili river basin is in the downstream of the dam. The downstream impact assessment should specifically focus on the impacts of the dam on fisheries and livelihood of the people who are dependent on fisheries, change in character of flood and impacts thereof, change in sedimentation and impacts thereof, change in geomorphological issues, change in groundwater recharge, among others. The EIA should find which section of people will be affected the most by the dam and how to compensate those people.

It has been reported that bank erosion by the Kopili River has increased after the construction of the Kopili dam. The EIA report of Lower Kopili HEP, should do an analysis to find what will be impacts of the new project on river bank erosion.

Impacts Peaking Power Operations: The EIA should do a detail assessment of impacts of peaking power operation during non-monsoon months. Due to peaking power generation in non-monsoon months the river stretch downstream from power house will have very little water for most hours of a day with sudden flows in the river only for a few hours. This flow fluctuation leads to many severe impacts including on aquatic bio-diversity, on safety, on river bed cultivation, on erosion, among others. This has severe socio economic impacts along with issues of safety of the people and their livestock in this stretch of the river. Therefore the EIA should do a detail assessment of impacts of peaking power generation.

Assessment of Optimum Reservoir Operation: The EIA should do an assessment to prepare an optimum reservoir operations plan for the project in order to minimize the downstream impacts if a disaster occurs. It is also highly recommended that the local people should be made a part of the reservoir operations process. Then only the dam authorities can be expected to be more responsible to in reservoir operations.

Impacts of Silt Management operations: The EIA should include detail analysis impact of changing silt flows downstream from desilting chamber, from silt flushing in monsoon, on the downstream areas. The EIA study should give detailed account of how the silt from the dam will be flushed out annually and what will be the impact of this in the downstream. The EIA should also include how the desilting chamber will be operated and what will be its impacts.

Detailed and Thorough Options Assessment: The EIA should do a thorough options assessment for the project. There can be several other cost effective options for power generation in that area and options assessment should look into al those.

Here we can take the case of solar power. A recent example of proposed 1000 MW solar power generation in Rajastan[11] has showed that for 1 MW installed capacity only 2 Ha of land is required and the cost per megawatt installed capacity will be 7.5 crores and electricity will be provided at Rs 6.5 per unit. Another proposed 25 MW solar power project in Assam[12] has similar figures.

At this rate, for a 120 MW (the target capacity of the proposed Lower Kopili HEP) solar power plant, the land required will be 240 ha. But for Lower Kopili HEP the land required is 1557 ha of land out of which nearly 900 ha will be used for the project even if we subtract 680 ha projected to be used for compensatory afforestation. This implies that for 1 MW installed capacity for the proposed dam the land requirement will be about 7.5 ha, about 3.75 times the land required for solar project of same capacity. Besides, the total cost for the Lower Kopili project is expected to be Rs. 1489.64 crores implying cost per MW installed capacity will be Rs. 12.41 crores, compared to Rs 7.5 cr for solar plant. Even if we were to put up 240 MW installed capacity of solar project, it would require 480 ha land, will not have impacts on the river, on people’s livelihoods, on forests, on climate change, and so on.

Increased Costs: It is important to note here that EAC in its 65th meeting in March 2013 discussing this projects had noted “In  comparison  to  other  HEPs  being  examined  recently,  the  cost  per  unit  of installed capacity of this project is almost double!” and this was said when the cost per megawatt installed capacity was Rs. 9.79 crores. Now in the revised document, the cost has gone up further to Rs 12.41 cr, the project proponent need to explain this further escalation from the earlier already high cost.

Groundwater Depletion in Downstream areas: People in the downstream of Kopili dam have reported that there has been depletion of groundwater in the downstream areas of Kopili dam. From a field visit done in the downstream areas of Kopili dam, it was reported that the ground water level at certain areas had reduced to 140 feet. River like Borapani, Kopili and Nisari dry up in the winters affecting the winter cultivations. Besides, wetlands which are known as Beel or Duba locally have disappeared. The reduction in groundwater can also be due to reduced groundwater recharge due to the dam. Impact of the dam on groundwater recharge should be a part of the EIA study.

Impacts of Tunneling and Blasting: The EIA should analyze the impacts of tunneling and blasting as these activities can increase in risk of landslide and disaster in a hilly area. Blasting in hilly area also will have impacts on water and people. These impacts should be thoroughly assessed by the EIA of the proposed project.

Impacts of Mining: The project will require large quantities of sand, coarse and fine granules and boulders. These are likely to be mined from the nearby areas. The EIA should include a study on the impacts of mining on the people as well on the local environment. Mining for the project will be done in the nearby areas and it will have severe impact on people as well as on the river, bio-diversity, hills, flora-fauna and aquatic bio-diversity etc. The study on the impacts of mining should include all these issues.

Impacts of Backwater Effects: The PFR of proposed Lower Kopili HEP states that Maximum Water Level (MWL) of the river is 229.60m where as the FRL of the reservoir is 226.0m. The MWL is thus 3.6m higher than FRL and this will have serious back water effects during the times of monsoon. The EIA must do an assessment of the submergence at MWL level and backwater effect measured at MWL and follow it up with an impacts analysis.

Detailed analysis about the existence of wetlands, watercourses and other water bodies: The revised PFR in page 17 under section ‘Environment Sensitivity’ states that there are no wetlands, watercourses and other waterbodies reported within the 15 km of the project. This statement seems incorrect. The EIA should do a detailed and thorough analysis regarding the existence wetlands, watercourses and other water bodies within 15 km of the project site.

 Impacts of Climate Change: The EIA of the proposed Lower Kopili dam should do a study of  possible impact of the climate change on the dam as well as on the Kopili river. Besides, it should also include the impacts of the dam on adaptation capacity of the local people.

Smaller Size Documents should be Uploaded for Public Dissemination: The EIA and other documents which would be uploaded on the internet should be about the size of 10 MB or less. The Revised Form I and PFR which uploaded on the MoEF website was 114 MB and it was difficult to download such a huge document even in a metropolis. These heavy documents will nearly be impossible to download from a small town or a village. The MoEF should insist from projects proponents that PP should be careful about this and should reduce the size (less than 10MB) documents for uploading from next time.


Parag Jyoti Saikia

with inputs from Himanshu Thakkar and Pooja Kotoky

Email – meandering1800@gmail.com

South Asia Network on Dams, Rivers & People (https://sandrp.in/https://sandrp.wordpress.com/)


[2] Patowary, A., “The Kopili Hydroelectric Project, Downstream People Rise in Struggle” published in “Water Conflicts in Northeast India – A Compendium of Case Studies” edited by Das, Partha J. et. all, 2013

[5] Mahanta,  K. and et all (2012): “Structural Formation & Seismicity of Kopili Fault Region in North-East India and Estimation of Its Crustal Velocity” International Journal of Modern Engineering Research,Vol.2, Issue.6, Nov-Dec. 2012 pp-4699-4702

[6] ibid

[8] It is to be noted that in many of the tribal areas of Assam and India’s north eastern states, the tribal law of land is community of ownership of land and there are no government ‘patta’ system.

Floods · Hydropower · Uttarakhand

Gangani Hydroproject on Yamuna in Uttarakhand: Small Project, Huge Flood Damages

IMPACT OF UTTARKHAND FLASH FLOODS IN MID JUNE 2013 ON LOCAL PEOPLE AT KHARADI VILLAGE (BARKOT BLOCK) IN UTTARKASHI DISTRICT RESULTING FROM A DIVERSION/ REDIRECTION OF THE YAMUNA RIVER TOWARDS POPULATED BANK OF THE RIVER DUE TO THE 8 MW GANGANI HEP. IMPACT IS ALSO THERE ON THE HEP INFRASTRUCTURE ITSELF PUTTING A QUESTION MARK ON ITS QUALITY OF CONSTRUCTION AS ON ITS SUSTAINABILITY.

YAMUNA JIYE ABHIYAAN, JULY 2013
Text by Manoj Mishra

Kharadi is a small road side market place on river Yamuna, some 40 km short of the holy shrine of Yamunotri. It is also a popular night halt site on the Char Dham Yatra route. Resultantly over the period of time a number of hotels and residential properties have come up along the road and the river side.

Gangani1
Redirection of the river to the left due to the project head. All Photos taken on 20 July 2013, by Bhim Rawat, Yamuna Jiye Abhiyaan

Some time in 2008-09 works, started by a pvt firm called Regency Gangani Energy Private Limited, immediately upstream of the Kharadi village for the construction of a 8 MW run of the river HEP. The works involved a diversion head, laying of pipes to convey the diverted river water and a power house around 5 km down stream of Kharadi at a place called Gangani. It is notable that the planned HEP is on the proper river Yamuna

By the year 2012, construction works had progressed to a considerable extent, when on the night of 3 August 2012 a cloud burst at Hanuman Chatti area resulted in a flash flood in the river Yamuna. Flow of Yamuna was obstructed by the diversion head of the HEP and was diverted towards its more populated left bank. This diversion swept away of around 9 hotels and residential properties of the local people at Kharadi. It also resulted in damages to the pipes laid in and near the river bed by the HEP.

If the above was not enough then on 17 June 2013, another cloud burst and heavy rains over most of higher reaches of Uttarakhand led to yet another diversion of the river and sweeping away of around 28 properties (see list at the end of this report) in the market village of Kharadi.

Washing away of structures in Kharadi some 500 m downstream from the river diversion head of the Gangani HEP by the flash flood in the river Yamuna on 17 June 2013

The Project also applied for Clean Development Mechanism (CDM) status under United Nations Framework Convention on Climate Change to get Carbon Emission Reduction Credits. Yamuna Jiye Abhiyaan and others have objected to this application at the Validation stage earlier and at registration stage now in August 2013 as the project is not only unsustainable, but its application was full of contradictions and misleading claims. The project is in any case not a sustainable Development Project, is business as usual project and hence non additional as per UNFCCC criteria. The project is also not sustainable development project, but India’s National CDM Authority, namely the Union Ministry of Environment and Forests, has never done credible assessment of this, and never rejected any application of CDM hydro projects!

Road and structures washed away by the flash flood in the Yamuna river downstream from diversion head of the Gangani HEP.
Damaged pipes (meant to carry the river water to the Gangani HEP power plant some 3 km d/s from the diversion head) and the damaged approach bridge on the river

List of Hotels and residential properties destroyed in Kharadi village by the flash floods in river Yamuna made worse due to the diversion head of the HEP upstream of the Kharadi village on the night of 16 and morning of 17 June 2013 and on the night of 3 August 2012 around 11 PM made worse (as per local people) due to the Gangnani HEP structure (head) in the river upstream of the village

Property/Hotel Owner Name Father’s Name Village Name No. of Rooms
1 Neel Kanth Hukum Singh Rawat, Sri Lal Singh Khanera Three Storey, 20 rooms
2 Unnamed Jagdish, Chandar Mohan, Ajay Sri Attar Singh Khanera 2 rooms + Provision Shop
3 Yamuna Darshan Jaidev Singh Rana Sri Jandar Singh Khanera 25 rooms
4 Bhupendar Place Rajendar Singh Chouhan, Sri Narendar Singh Syalna 12 Rooms
5 Bhupendar Palace (Joint) Gajendar Singh , Sri Narendar Singh Syalna 04 Rooms
6 Bhupendar Palace (Joint) Arjun Singh, Kesar Singh Syalna 04 Rooms
7 Amit Restaurant Jogindar singh, Sri Chandan Singh Bhansadi 05 Rooms
8 Govind Palace Janak Singh Sri Ranjor Singh Khanera 12 rooms
9 Him Darshan (August 12) Atol Singh, Sri Jai Singh Chouhan Nagon Gaon 22 Rooms
10 Naveen Palace Jag Mohan Chouhan, Sri Jhoon Singh Khanera 06 Rooms
11 Naveen Palace Man Mohan Singh, Sri Jhoon Singh Khanera 04
12 Naveen Palace Dharmendar , Sri Jhoon Singh Khanera 04
13 Vijay Restaurant Vijay Chouhan, Sri Jhoon Singh Khanera 1 Hall, 1 Cottage
14 Naveen Palace Darmyan Singh, Sri Kamal Singh Syalna 07
15 Provision Singh Jagveer Singh chouhan Sri Surveer Chouhan Khanera Provision Shop
16 Ravindar Palace Ravindar Singh Sri Budhi Singh Khanera 04 Rooms
17 Kahniya Palace Shailendar Singh Sri Shiv Singh Khanera 04 Rooms + Restaurant
18 Rana Place Kitab Singh Rana Sri Surb Singh Rana Khanera 04 Rooms
19 Residence Gabar Singh Sri Sultan Singh Khanera 04 Rooms
20 Residence Bijendar Singh Sri Sabal Singh Khanera 07 Rooms
21 Residence Brij Mohan Sri Jogolia Khanera 06 Cottages
23 Residence Chojen Lal Sri Kuta Singh Syalna 04 Rooms
24 Residence Basant Lal Sri Khelan Singh Khanera 03 Rooms
25 Residence Trepan Lal Sri Sadhu Lal Syalna 02 Rooms
26 Residence Jogi Lal Sri Jhapuliyan Khanera 02 Rooms
27 Aneesh Place Aneesh Sri Janbeer Khanera 06 Rooms
28 Residence Jendar Singh Sri Keval Singh Khanera 02 Rooms
29 Residence Praveen Singh Sri Jandar Singh Khanera 02 Rooms
30 Residence Jagendar Singh Sri Keval Singh Khanera 02 Rooms
31 Narayan Place Kendar Singh Payal Sri Ram Singh Syalna 05 Rooms
32 Residence Chain Singh Sri Rompal Singh Syalna 04 Rooms
33 Residence Ispal Singh Sri Khajan Singh Syalna 04 Rooms
34 Narayan Palace (Joint) Ranbeer Singh Sri Ghayan Chand Syalna 04 Cottage
35 Narayan Palace (Joint) Chain Singh Sri Daya Ram Singh Khanera 02 Rooms + Canteen= 02 cottage (About to fall)
36 Giri Ashram Saint Giri Kharadi
37 Trishul Hotel Kandra Singh Payal Sri Ram Singh Syalna Verandah Damaged
Bold entry relates to properties washed away in Aug 2012.

NOTE:
About 25 additional Households have now (after June 2013 floods) come with in the slip zone, which can now slip or get washed away any time in the event of high rainfall or another flood.
Entire Kharadi village has now been declared as disaster affected by the District Administration.

YAMUNA JIYE ABHIYAAN, JULY 2013
(Text by Manoj Mishra)

Disasters · Hydropower · Uttarakhand

Uttarakhand: Existing, under construction and proposed Hydropower Projects: How do they add to the state’s disaster potential?


As Uttarakhand faced unprecedented flood disaster and as the issue of contribution of hydropower projects in this disaster was debated, questions for which there have been no clear answers were, how many hydropower projects are there in various river basins of Uttarakhand? How many of them are operating hydropower projects, how many are under construction and how many more are planned? How many projects are large (over 25 MW installed capacity), small (1-25 MW) and mini-micro (less than 1 MW installed capacity) in various basins at various stages?

This document tries to give a picture of the status of various hydropower projects in various sub basins in Uttarakhand, giving a break up of projects at various stages, As per available information in July 2013.

River Basins in Uttarakhand Entire Uttarakhand is part of the larger Ganga basin. The Ganga River is a trans-boundary river, shared between India and Bangladesh. The 2,525 kms long river rises in the western Himalayas in the Indian state of Uttarakhand, and flows south and east through the Gangetic Plain of North India into Bangladesh, where it empties into the Bay of Bengal. The Ganga begins at the confluence of the Bhagirathi and Alaknanda rivers and forms what we have called Ganga sub basin till it exits Uttarakhand. Besides Bhagirathi, Alaknanda and Ganga sub basin, other river basins of Uttarakhand include: Yamuna, Ramganga (Western Ramganga is taken as Ramganga basin in this document, eastern Ramganga is considered part of Sharda basin) and Sharda. Sharda sub basin includes eastern Ramganga, Goriganga, Dhauliganga, Kaliganga and part of Mahakali basin.

Destroyed 400 MW Vishnuprayag HEP on Alaknanda. Photo: Matu Jan Sangathan

Existing hydropower projects in Uttarakhand In the table below we have given the sub basin-wise list of existing hydropower projects in Uttarakhand along with their capacities. The list has been prepared based on various sources including Central Electricity Authority, Uttarakhand Jal Vidhyut Nigam (UJVNL), Uttarakhand Renewable Energy Development Authority (UREDA) and Report of Inter Ministerial Group on Ganga basin.

Existing Hydropower projects in Uttarakhand


Projects

Installed Capacity  (MW)

Projects in Alaknanda River Basin

1. Vishnu Prayag (P)

400

2. Tilwara

0.2

3. Soneprayag

0.5

4. Urgam

3

5. Badrinath II

1.25

6. Rajwakti (P)

3.6

7. Tapowan

1

8. Jummagad

1.2

9. Birahi Ganga (P)

7.2

10. Deval (P Chamoli Hydro P Ltd on Pinder)

5

11. Rishiganga (P)

13.5

12. Vanala (P Hima Urja P Ltd Banala stream)

15

13. Kaliganga I (ADB)

4

Alaknanda Total

455.45

Projects in Bhagirathi River Basin

14. Maneri Bhali-1 (Tiloth)

90

15. Maneri Bahli-2

304

16. Tehri St-I

1000

17. Koteshwar

400

18. Harsil

0.2

19. Pilangad

2.25

20. Agunda Thati (P Gunsola hydro Balganga river)

3

21. Bhilangana (P – Swasti)

22.5

22. Bhilangana III (P – Polyplex)

24

23. Hanuman Ganga (P – Regency Aqua)

4.95

Bhagirathi Total

1850.9

Projects in Ganga River sub basin downstream of confluence of Bhagirathi and Alaknanda

24. Chilla

144

25. Pathri

20.4

26. Mohamadpur

9.3

Ganga sub basin Total

173.7

Projects in Ramganga basin

27. Ramganga

198

28. Surag

7

29. Loharkhet (P Parvatiya Power P Ltd Bageshwar)

4.8

30. Kotabagh

0.2

31. Sapteshwar

0.3

32. Gauri

0.2

Ramganga Total

210.5

Projects in Sharda River Basin

33. Dhauliganga

280

34. Tanakpur

94.2

35. Khatima

41.4

36. Chirkilla

1.5

37. Taleshwar

0.6

38. Suringad

0.8

39. Relagad

3

40. Garaon

0.3

41 Charandev

0.4

42. Barar

0.75

43. Kulagad

1.2

44. Kanchauti

2

Sharda Total

426.15

Projects in Yamuna River Basin

45. Chibro

240

46. Dhakrani

33.75

47. Dhalipur

51

48. Kulhal

30

49. Khodri

120

50. Galogi

3

51. Tharali

0.4

Yamuna Total

478.15

Grand Total

3594.85

Note: (P) in the bracket suggests the project is in private sector, throughout this document. The eastern Ramganga river, which is part of Sharda basin, is included in Sharda basin. Where-ever Ramganga river is mentioned in this document, it refers to Western Ramganga, which is a tributary of Ganga.

Alaknanda flowing beyond the destroyed 400 MW Vishnuprayag Project Photo: Matu Jan Sangathan

In the next table we have given available list of existing mini and micro hydropower projects in Uttarakhand, based on UREDA information.

List of projects up to 1 MW under operation:


SN Project

Ins Cap (MW)

Dist Basin
1 Milkhet

0.1

Chamoli Alaknanda
2 Bamiyal

*

Chamoli Alaknanda
3 Bursol

0.2

Chamoli Alaknanda
4 Choting

0.1

Chamoli Alaknanda
5 Ghagaria

0.1

Chamoli Alaknanda
6 Ghagaria Extension

*

Chamoli Alaknanda
7 Ghes

0.1

Chamoli Alaknanda
8 Gulari

0.2

Chamoli Alaknanda
9 Niti

0.025

Chamoli Alaknanda
10 Sarma

0.1

Chamoli Alaknanda Nandakini/ Maini Gad
11 Wan

0.05

Chamoli Alaknanda
12 Bank

0.10

Chamoli Alaknanda Pinder
13 Gamsali Bampa

0.05

Chamoli Alaknanda Dhauliganga/Ganesh Ganga
14 Kedarnath II

0.2

Rudraprayag Alaknanda
15 Badiyakot

0.1

Bageshwar Alaknanda
16 Kunwari

0.05

Bageshwar Alaknanda
17 Borbalada

0.025

Bageshwar Alaknanda Pindar/ Chhiyaldi Gad
18 Dokti

0.02

Bageshwar Alaknanda
19 Dior IInd Phase

*

Pauri Alaknanda/ Ganga
20 Chandrabhaga Gad

*

Tehri Bhagirathi
21 Jakhana

0.1

Tehri Bhagirathi Bhilangana/Balganga
22 Gangotri-I

0.1

 UttarKashi Bhagirathi Kedar Ganga
23 Kanwashram

0.1

Pauri Ganga
24 Bilkot

0.05

Pauri Ramganga
25 Dior Ist Phase

0.1

Pauri Ramganga
26 Gogina II

0.05

Bageshwar Ramganga
27 Sattshwar

0.05

Bageshwar Ramganga
28 Toli

*

Bageshwar Ramganga
29 Ramgarh

0.1

Nainital Ramganga
30 Lathi

0.1

Bageshwar E Ramganga/Sharda
31 Liti

0.05

Bageshwar E Ramganga/Sharda
32 Liti-II

0.05

Bageshwar E Ramganga/Sharda
33 Ratmoli

0.05

Bageshwar E Ramganga/Sharda
34 Baghar

0.05

Bageshwar E Ramganga/Sharda
35 Baicham

0.1

Bageshwar E Ramganga/Sharda
36 Jugthana

0.1

Bageshwar E Ramganga/Sharda
37 Kanol gad

0.1

Bageshwar E Ramganga/Sharda
38 Karmi

0.05

Bageshwar E Ramganga/Sharda
39 Karmi -III

0.05

Bageshwar E Ramganga/Sharda
40 Karmi-II

0.05

Bageshwar E Ramganga/Sharda
41 Bhikuriya Gad

0.5

Pithoragarh Sharda
42 Kanchauti

*

Pithoragarh Sharda
43 Lamabager

0.20

Bageshwar Sharda Saryu
44 Lamchula

0.05

Bageshwar Sharda Saryu
45 Tarula

0.10

Almora Sharda Saryu/Jataya Ganga
46 Taluka

0.025

Uttarkashi Yamuna Tons/ Gattu Gad
47 Bhadri Gad

0.02

Tehri Yamuna

From http://ahec.org.in/, capacity of some of the projects is as per the UJVNL website. The capacity comes to 3.815 MW for the 41 projects for which capacity is available, for six mini-micro HEPs in Uttarakhand listed above, this information is not available..


5 MW Motigad Project in Pithorgarh District destroyed by the floods. Photo: Emmanuel Theophilus, Himal Prakriti

Based on above two tables, in the following table we have provided an overview of operating hydropower projects and their capacity, with basin wise and size wise break up.

Uttarakhand has total of 98 existing hydropower projects, with total installed capacity of close to 3600 MW. At least eleven of these projects are in private sector with total capacity of over 503 MW. An additional about 1800 MW capacity is in central sector. It means that majority of the power generation capacity in the state is not owned by the state and there is no guarantee how much of that power would be available to the state.


Basin wise number of operating hydro projects in Uttarakhand


Basin Large Hydro projects (above 25 MW) Small Hydro projects (1-25 MW) Mini-micro Hydro projects (below 1 MW) Total Hydro projects
No of projects Capacity, MW No of Projects Capacity, MW No of Projects Capacity, MW No of Projects Capacity, MW
Alaknanda

1

400

10

54.75

21

2.22

32

456.97

Bhagirathi

4

1794

5

56.7

4

0.4

13

1851.1

Ganga Sub basin

1

144

2

29.7

1

0.1

4

173.8

Ramganga

1

198

2

11.8

9

1.05

12

210.85

Sharda

3

415.6

4

7.7

21

4.45

28

427.75

Yamuna

5

474.75

1

3

3

0.445

9

478.195

TOTAL

15

3426.35

24

163.65

59

8.665

98

3598.665


Here we should note that as per the Union Ministry of New  and Renewable  Energy sources, in Uttarakhand, by March 2013, 98 small hydro schemes has been installed with total capacity of 170.82 MW. If we add the small and mini-micro projects in above table, we have 83 operating schemes with installed capacity of 172.315 MW. This mis-match is not possible to resolve since MNRE does not provide full list of operating SHPs in Uttarakhand.


Under Construction Hydropower projects in Uttarakhand In the table below we have given available list of under construction hydropower projects in Uttarakhand. Actual list of under construction projects is likely to be larger than this, since clear and uptodate information is not available on official website. Please note that this does not include the list of mini and micro hydropower projects that are under construction. Even in case of small hydro projects (1-25 MW capacity), the list is not complete. According to this list, 41 projects with 2378.115 MW capacity are under construction in Uttarakhand. 6 of them are large hydropower projects and rest 35 are small or mini-micro hydro projects. Of the 6 large hydropower projects, three are in private sector and three are in central sector, none in state sector.


Mountains of Muck generated by under construction 330 MW Shrinagar Hydel Project

List of under construction projects:


SN Project Ins Cap (MW) Dist Sub-Basin
1 Srinagar

330

Pauri Alaknanda
2 Phata- Byung

76

Rudraprayag Alaknanda
3 Singoli-Bhatwari

99

Rudraprayag Alaknanda
4 Lata Tapovan

171

Chamoli Alaknanda
5 Tapovan Vishnugad

520

Chamoli Alaknanda
6 Madhmaheshwar (ADB)

10

Rudrprayag Alaknanda
7 Kaliganga-II (ADB)

6

Rudrprayag Alaknanda
8 Bgyunderganga (P)

24.3

Chamoli Alaknanda
9 Birahi Ganga-I (P)

24

Chamoli Alaknanda
10 Devali (P)

13

Chamoli Alaknanda
11 Kail ganga

5

Chamoli Pinder Alaknanda
12 Khiraoganga (P)

4

Uttarkashi Alaknanda
13 Sobla I

8

Pithoragarh Alaknanda
14 Hafla

0.2

Chamoli  Alaknanda Hafla Gad
15 Nigol Gad

0.1

Chamoli  Alaknanda Nigal Gad
16 Wachham

0.50

Bageshwar Alaknanda Pindar/SunderDhunga Gad
17 Tehri stage-II

1000

Tehri Bhagirathi
18 Asiganga-I

4.5

Uttarkashi Bhagirathi
19 Asiganga-II

4.5

Uttarkashi Bhagirathi
20 Suwarigad

2

Uttarkashi Bhagirathi
21 Limchagad

3.5

Uttarkashi Bhagirathi
22 Kaldigad (ADB)

9

Uttarkashi Bhagirathi
23 Balganga-II

7

Tehri Garhwal Bhagirathi
24 Jalandhari Gad (P)

24

Uttarkashi Bhagirathi
25 Kakora Gad (P)

12.5

Uttarkashi Bhagirathi
26 Kot-Buda Kedar (P)

6

Tehri Bhagirathi
27 Siyangad (P)

11.5

Uttarkashi Bhagirathi
28 KotiJhala

0.2

 Tehri Bhagirathi Bal Ganga
29 Pinsward

0.05

 Tehri Bhagirathi Bal Ganga
30 Dunao

1.5

Pauri Ganga sub basin
31 Gaudi Chida

0.25

Pauri Ganga sub basin E Nayar
32 Rotan

0.05

Pithoragarh Sharda E Ramganga/Rotan
33 Duktu

0.025

Pithoragarh Sharda Kali/ Nati Yanki
34 Nagling

0.05

Pithoragarh Sharda Kali/ Nagling Yanki
35 Sela

0.05

Pithoragarh Sharda Dhauli Ganga/ Seal Gad
36 Kutty

0.05

Pithoragarh Sharda Kali
37 Napalchu

0.05

Pithoragarh Sharda Kali/ Piear Yanki
38 Bundi

0.05

Pithoragarh Sharda Kali/ Pulung Gad
39 Rongkong

0.05

Pithoragarh Sharda Kali/ Dangiang Yanki
40 Chiludgad

0.10

Uttarakashi Yamuna Supin/Chilude Gad
41 Khapu Gad

0.04

Uttarakashi Yamuna Supin/Khapu Gad

Total Under Construction               2378.115 MW

Note: Projects like Loharinag Pala, Pala Maneri, Bhairoghati and other projects along Bhagirathi upstream of Uttarkashi along the Eco Sensitive zone have been dropped from this list. Rest of the list is from the IMG report or from UJVNL website. P in the bracket indicates the project is in the private sector. ADB in the bracket indicates that the project is funded by the Asian Development Bank.


Proposed hydropower projects in Uttarakhand In following tables we have provided available list of proposed hydropower projects in the Alaknanda, Bhagirathi, Yamuna, Sharda and Ramganga basins in Uttarakhand. The list is likely to be longer than the list in these tables since full and upto-date information is not available. Also there are different agencies  involved in proposing, sanctioning and executing these projects and there is no single agency which can provide comprehensive picture of what is happening in the basin. However, even this available list is frightening.


List of proposed projects in Alaknanda Basin


SN Project Ins Cap (MW) Dist Sub-Basin Status
1 Vishnugad Pipalkoti (WB)

444

Chamoli Alaknanda Construction to be started
2 Kotli Bhel (IB)

320

Pauri Alaknanda EAC ok/FAC u/consideration
3 Alaknanda (P Badrinath)

300

Chamoli Alaknanda EC & FC ok IA not signed
4 Devsari Dam

252

Chamoli Alaknanda EC & FC ok CEA concrnce?
5 Kotli Bhel II

530

Pauri Ganga sub basin EAC ok/FAC u/consideration
6 Bowla Nandprayag

300

Chamoli Alaknanda EAC TOR Approved
7 Tamak Lata

280

Chamoli Alaknanda EC ok, DPR under revision
8 Nand Prayag

100

Alaknanda DPR returned
9 Jelam Tamak

108

Chamoli Alaknanda EAC ok in June 2013
10 Maleri Jelam

55

Chamoli Alaknanda PFR prepared
11 Rishiganga I

70

Chamoli Alaknanda PFR prepared
12 Rishiganga II

35

Chamoli Alaknanda PFR prepared
13 Gohana Tal

60

Chamoli Alaknanda PFR prepared
14 Rambara

24

Rudraprayag Alaknanda IMG report
15 Birahi Ganga-II (P)

24

Chamoli Alaknanda DPR under revision
16 Melkhet (P)

56

Chamoli Alaknanda Pinder Proposed
17 Urgam-II

3.8

Chamoli Alaknanda Under S&I
18 Bhyunder Ganga

243

Chamoli Alaknanda FC under consideration
19 Nand Pyayag Langasu

141

Chamoli Alaknanda EAC TOR Approved
20 Rambara

76

Rudraprayag Alaknanda EAC TOR u/consideration
21 Bagoli

90

Chamoli Alaknanda Proposed
22 Bangri

44

Chamoli Alaknanda Pinder
23 Madhya Maheshwar

350

Chamoli Alaknanda Proposed
24 Ming Nalgaon

114

Chamoli Alaknanda Pinder
25 Padli

66

Chamoli Alaknanda Proposed
26 Thapli

44

Chamoli Alaknanda Proposed
27 Utyasu-I

70

Chamoli Alaknanda Proposed
28 Utyasu-II

205

Chamoli Alaknanda Proposed
29 Utyasu-III

195

Chamoli Alaknanda Proposed
30 Utyasu-IV

125

Chamoli Alaknanda Proposed
31 Utyasu-V

80

Chamoli Alaknanda Proposed
32 Utyasu-VI

70

Chamoli Alaknanda Proposed
33 Rampur Tilwari

25

Rudraprayag Alaknanda Proposed
34 Chunni semi

24

Rudraprayag Alaknanda Proposed Mandakini
35 Kosa

24

Chamoli Alaknanda Dhauliganga
36 Vijay nagar- Rampur

20

Rudraprayag Alaknanda Proposed
37 Nandakini-III

19.5

Chamoli Alaknanda Proposed
38 Nayar

17

Pauri Ganga sub basin Nayar
39 Alaknanda I

15

Chamoli Alaknanda Proposed
40 Buara

14

Bageshwar Alaknanda Pindar
41 Duna Giri

10

Chamoli Alaknanda Dhauliganga
42 Alaknanda II

10

Chamoli Alaknanda Proposed
43 Balkhila-II

10

Chamoli Alaknanda Proposed
44 Mandani Ganga

10

Rudraprayag Alaknanda Mandakini Mandani ganga
45 Rishiganga

8.25

Chamoli Alaknanda Proposed
46 Subhain

8

Chamoli Alaknanda Dhauliganga
47 Son

7

Rudraprayag Alaknanda Mandakini son gad
48 Kalp ganga

6.25

Chamoli Alaknanda Proposed kalpganga
49 Lustar

6

Rudraprayag Alaknanda Mandakini Lustar
50 Madhya maheshwar -II

6

Rudraprayag Alaknanda Mandakini madmaheshwar
51 Hom 6

6

Chamoli Alaknanda Dhauliganga
52 Amrit ganga

6

Chamoli Alaknanda Amrit ganga balsuti gadera
53 Gaddi

5.25

Chamoli Alaknanda dhauliganga Gaddi Gadera
54 Deval

5

Chamoli Alaknanda Proposed
55 Ghrit Ganga

5

Chamoli Alaknanda Proposed
56 Jumma

5

Chamoli Alaknanda Proposed
57 Ringi

5.5

Chamoli Alaknanda Dhauliganga
58 Tamak

5

Chamoli Alaknanda Proposed
59 Balkhila-I

5.5

Chamoli Alaknanda Proposed Balkhila
60 Basti -I

4

Rudraprayag Alaknanda Proposed
61 Basti -II

4

Rudraprayag Alaknanda Proposed
62 Laxmanganga

4

Chamoli Alaknanda Proposed
63 Nil ganga

3

Chamoli Alaknanda Proposed
64 Santodhar – I

2

Pauri Ganga sub basin W Nayar
65 Santodhar – II

2

Pauri Ganga sub basin W Nayar
66 Birahiganga

4.8

Chamoli Alaknanda Proposed
67 Byaligaon

2.25

Pauri Ganga sub basin E Nayar
68 Ghirit Ganga

1.3

Chamoli Alaknanda Proposed
69 Jummagad

1.2

Chamoli Alaknanda Proposed
70 Kailganga

3

Chamoli Alaknanda Proposed
71 Kakra

1

Rudraprayag Alaknanda Proposed
72 Kali Ganga

3

Chamoli Alaknanda Proposed
73 Garud Ganga

0.6

Chamoli Alaknanda Proposed
74 Gansali Bampa

0.05

Chamoli  Alaknanda Dhauliganga/Ganesh Ganga
Alaknanda Total

5199.25


List of proposed projects in Bhagirathi Basin


SN Project Ins Cap (MW) Dist Sub-Basin Status
1 Kotli Bhel (IA)

195

Pauri Bhagirathi EC/FAC stage 1
2 Jhalakoti (P)

12.5

Uttarkashi Bhagirathi Proposed dharamganga
3 Bhilangana II A

24

Uttarkashi Bhagirathi Proposed
4 Karmali

140

Uttarkashi Bhagirathi IMG, on Eco-sensitive zone?
5 Jadhganga

50

Uttarkashi Bhagirathi IMG: PFR prepared
6 Bhilangana IIB

24

Tehri Bhagirathi Under S&I
7 Bhilangana IIC

24

Tehri Bhagirathi Under S&I
8 Pilangad-II

4

Uttarkashi Bhagirathi Proposed
9 Bhela Tipri

100

Uttarakashi Bhagirathi Proposed
10 Nelong

190

Uttarakashi Bhagirathi Proposed
11 Asiganga-III

9

Uttarkashi Bhagirathi Proposed
12 Gangani (P)

8

Uttarkashi Bhagirathi Proposed
13 Balganga-I

5

Tehri Garhwal Bhagirathi Proposed
14 Khirao ganga

4

Uttarkashi Bhagirathi Proposed
15 Lagrasu (P)

3

Tehri Garhwal Bhagirathi Proposed
16 Songad

3

Uttarkashi Bhagirathi Proposed
17 Jalandhari Gad

3

Uttarakashi Bhagirathi Proposed
18 Jalkurgad I

2

Tehri Garhwal Bhagirathi Proposed jalkur gad
19 Rataldhara

0.4

Tehri Garhwal Bhagirathi Proposed Jalkur Gad
20 Lamb Gaon

0.4

Tehri Garhwal Bhagirathi Proposed Jalkur gad
21 Dhatirmouli

0.4

Tehri Garhwal Bhagirathi Proposed Jalkurgad
22 Gangi-Richa

0.2

Tehri Tehri Bhagirathi Bhilangana/ Re Gad
Bhagirathi Total

801.9


List of proposed projects in W Ramganga Basin


Golden Mahseer in Ramganga
SN Project Ins Cap (MW) Dist Sub-Basin Status
1 Babas Dam

88

Almora Ramganga Proposed
2 Khati

63

Bagehwar Ramganga Proposed
3 Lumi

54

Bagehwar Ramganga Proposed
4 Kuwargarh

45

Bagehwar Ramganga Proposed
5 Bawas Gaon

34

Nainital Ramganga Proposed
6 Jamrani Dam

30

  Ramganga Proposed
7 Khutani

18

Bageshwar Ramganga Proposed
8 Sarju Stage-II (P)

15

Bageshwar Ramganga Proposed
9 Sarju Stage-III (P)

10.5

Bageshwar Ramganga Proposed
10 Sheraghat

10

Almora Ramganga Kho
11 Baura

14

Bageshwar Ramganga Proposed
12 Sarju Stage-I (P)

7.5

Bageshwar Ramganga Proposed
13 Balighat

5.5

Bageshwar Ramganga Proposed
14 MehalChaura-I

4

Pithoragarh Ramganga Proposed
15 MehalChaura-II

3

Pithoragarh Ramganga Proposed
16 Agarchatti

2

Pithoragarh Ramganga Proposed
17 Kho I

2

Pauri Ramganga Kho
18 Kho II

2

Pauri Ramganga Proposed
19 Harsila

0.7

Bageshwar Ramganga Proposed harsila gad
20 Kalsa

0.3

Nainital Ramganga Proposed
Ramganga Total

408.5


List of proposed projects in Sharda Basin


SN Project Ins Cap (MW) Dist Sub-Basin Status
1 Mapang Bogudhiyar (P)

200

Pithoragarh Sharda EAC TOR Approved
2 Bogudhiyar Sarkaribhyol (P)

170

Pithoragarh Sharda EAC TOR Approved
3 Sarkaribhyol Rupsiabagar

210

Pithoragarh Sharda EAC TOR Approved
4 Rupsiabagar Khasiabara

260

Pithoragarh Sharda EAC Ok / FAC Rejected
5 Bokang Baling

330

Pithoragarh Sharda Proposed THDC
6 Chungar Chal

240

Pithoragarh Sharda Proposed NHPC
7 East Ram Ganga Dam

30

Pithoragarh Sharda Proposed
8 Khartoli Lumti Talli

55

Pithoragarh Sharda Proposed
9 Budhi

192

Pithoragarh Sharda Mahakali
10 Garba Tawaghat

610

Pithoragarh Sharda-Mahakali Proposed NHPC
11 Garbyang

131

Pithoragarh Sharda Mahakali
12 Lakhanpur

160

Pithoragarh Sharda Proposed
13 Malipa

138

Pithoragarh Sharda Mahakali
14 Pancheshwar

6000

Pithoragarh Sharda Indo Nepal Project
15 Purnagiri Dam

1000

Champawat Sharda Indo Nepal Project
16 Tawaghat – Tapovan

105

Pithoragarh Sharda Mahakali
17 Taopvan Kalika

160

Pithoragarh Sharda Mahakali
18 Tapovan Chunar

485

Pithoragarh Sharda Proposed
19 Sela Urthing

230

Pithoragarh Sharda Proposed
20 Urthing Sobla (P)

340

Pithoragarh Sharda Proposed
21 Sobla Jhimjingao

145

Pithoragarh Sharda Proposed
22 Kalika – Baluwakot

120

Pithoragarh Sharda Mahakali
23 Kalika Dantu

230

Pithoragarh Sharda Proposed
24 Dhauliganga Intermediate

200

Pithoragarh Sharda Proposed NHPC
25 Gauriganga III A & B

140

Pithoragarh Sharda Proposed NHPC
26 Madkini (P)

39

Pithoragarh Sharda Proposed
27 Burthing – Purdam

5

Pithoragarh Sharda Proposed Jakula
28 Jimbagad

7.7

Pithoragarh Sharda Proposed
29 Suringad-II

5

Pithoragarh Sharda Proposed
30 Tanga (P)

5

Pithoraharh Sharda Proposed
31 Tankul

12

Pithoragarh Sharda Proposed
32 Motighat (P)

5

Pithoraharh Sharda Proposed
33 Painagad

9

Pithoragarh Sharda Proposed
34 PhuliBagar- Kwiti

4

Pithoragarh Sharda Proposed Jakula
35 Kumeria- Garjia (Bawas)

12.5

Nainital Sharda Kosi
36 Balgad

8

Pithoragarh Sharda E Ramganga
37 Kuti SHP

6

 Pithoragarh Sharda Maha Kali/ Kuti yangti
38 Palang SHP

6.5

 Pithoragarh Sharda Maha Kali/ Plang gad
39 Najyang SHP

5.5

 Pithoragarh Sharda Maha Kali/ Najyang gad
40 Simkhola SHP

8.75

 Pithoragarh Sharda Maha Kali/ Simkhola gad
41 Birthi

1

Pithoragarh Sharda Balchinn
42 Baram

1

Pithoragarh Sharda Dhauli Ganga/ Baram Gad
43 Unchiya

0.05

Pithoragarh Sharda Dhauli Ganga/ Khari Gad
44 Murtoli

0.02

Pithoragarh Sharda Goriganga/ Martoligad
45 Burphu

0.03

Pithoragarh Sharda Goriganga/ Martoligad
46 Ralam

0.03

Pithoragarh Sharda Goriganga/ Ralangad
47 Ram Gad-II

0.1

Nainital Sharda Kosi/ Ramgad
48 Watcm

0.1

Pithoragarh Sharda Ramgad E/ Watchraila

Total Sharda Basin

12022.28


List of proposed projects in Yamuna Basin


SN Project Ins Cap (MW) Dist Sub-Basin Status
1 Lakhwar

300

Dehradun Yamuna EAC TOR Approved
2 Vyasi

120

Dehradun Yamuna EAC Recommended
3 Arakot Tuni

81

Uttarkashi Yamuna EAC TOR Approved
4 Tuni Plasu

66

Dehradun Yamuna EAC TOR Approved
5 Mori-Hanol (P)

63

Uttarkashi Yamuna EAC TOR Approved
6 Naitwar Mori (Dewari Mori)

60

Uttarkashi Yamuna EAC Recommended
7 Hanol Tuni (P)

60

Uttarkashi Yamuna EAC Recommended
8 Jakhol Sankri

45

Uttarkashi Yamuna EAC TOR Approved
9 Kishau

600

Dehradun Yamuna Proposed
10 Chammi Naingaon

540

Uttarakashi Yamuna Proposed
11 Chatra Dam

300

Uttarakashi Yamuna Proposed
12 Taluka Sankri

140

Uttarkashi Yamuna Proposed
13 Taluka Dam

112

Uttarakashi Yamuna Proposed
14 Sankri Mori

78

Uttarakashi Yamuna Proposed
15 Barkot Kuwa

42

Uttarakashi Yamuna Proposed
16 Hanuman Chatti Sianachatti

33

Uttarakashi Yamuna Proposed
17 Barnigad Naingaon

30

Uttarakashi Yamuna Proposed
18 Rupin Stage V (P)

24

Uttarkashi Yamuna Proposed
19 Damta – Naingaon

20

Uttarkashi Yamuna Proposed
20 Tons

14.4

Uttarkashi Yamuna Proposed
21 Supin

11.2

Uttarkashi Yamuna Proposed
22 Rupin Stage IV (P)

10

Uttarkashi Yamuna Proposed
23 Rupin Stage III (P)

8

Uttarkashi Yamuna Proposed
24 Barnigad

6.5

Uttarakashi Bhagirathi Proposed
25 Pabar

5.2

Dehradun Yamuna Proposed
26 Badyar (P)

3

Uttarkashi Yamuna Proposed
27 Lagrasu

3

Tehri Yamuna Proposed
28 Rayat (P)

3

Tehri Yamuna Proposed
29 Ringali

1

Tehri Garhwal Yamuna Proposed Aglar Ringaligad
30 Purkul

1

 Dehradun Yamuna Tons
31 Paligad

0.3

Uttarkashi Yamuna Proposed Paligad
32 Rikhani Gad

0.05

Uttarkashi Yamuna Rikhanigad
33 Bijapur

0.2

 Dehradun Yamuna Tons
Yamuna Total 2780.85 MW
Grand Total 21212.78 MW

Note: EAC: Expert Appraisal Committee of MoEF; FAC: Forest Advisory Committee of MoEF; EC: Environment Clearance: FC: Forest Clearance; TOR: Terms of Reference (of EIA); for Alaknanda, the first 17 projects are listed as given in IMG report and for Bhagirathi first 8 projects are as listed in IMG report. However, many of these projects have been recommended to be dropped by the WII (Wildlife Institute of India) report. Also, IMG and other have said that no further projects should be taken up in Bhagirathi and Alaknanda basins. The projects listed above in the Bhagirathi basin beyond serial number 8 and those in Alaknanda basin beyond 17 would, in any case, not be taken up.

In the table below we have provided and overview of proposed hydropower projects in Uttarakhand based on the information from above five tables.

Overview of Proposed Hydropower Projects in Uttarakhand


Basin Large Hydro projects (above 25 MW) Small Hydro projects (1-25 MW) Mini-micro Hydro projects (below 1 MW) Total Hydro projects
No of projects Capacity, MW No of Projects Capacity, MW No of Projects Capacity, MW No of Projects Capacity, MW
Alaknanda

29

4823

43

375.6

2

0.65

74

5199.25

Bhagirathi

5

675

13

125.5

4

1.4

22

801.9

Ramganga

6

314

12

93.5

2

1

20

408.5

Sharda

26

11920

16

101.95

6

0.33

48

12022.28

Yamuna

17

2670

13

110.3

3

0.55

33

2780.85

TOTAL

83

20402

97

806.85

17

3.93

197

21212.78


Overview of hydropower projects in Uttarakhand In the table below we have put together the number and capacities of existing, under construction and proposed hydropower projects in various basins of Uttarakhand. Uttarakhand government has plans to have total of 337 hydropower projects with total capacity of 27191.89 MW. Largest number (124) of such projects are in Alaknanda basin, the largest capacity is proposed to be in Sharda basin at 12450.905 MW.

In the table below we have given basin wise figures of total large, small and mini-micro hydropower proejcts (including existing, under construction and proposed) projects in Uttarakhand. According to Union Ministry of New and  Renewable energy, total potential of small hydro  in Uttarakhand is 1707.87 MW from 448 small hydro projects. If we take that into account the figures in the following tabes would change (go up) accordingly.

Basin wise total capacities for large, small and mini HEPs in Uttarakhand


Basin Large Hydro projects (above 25 MW) Small Hydro projects (1-25 MW) Mini-micro hydro projects (<1 MW) Total Hydro projects
No of projects Capacity, MW No of Projects Capacity, MW No of Projects Capacity, MW No of Projects Capacity, MW
Alaknanda

35

6419

61

524.65

26

3.67

122

6947.32

Bhagirathi

10

3469

28

266.7

10

2.05

48

3737.75

Ganga Sub basin

1

144

3

31.2

2

0.35

6

175.55

Ramganga

7

512

14

105.3

11

2.05

32

619.35

Sharda

29

12335.6

20

109.65

35

5.155

84

12450.405

Yamuna

22

3144.75

14

113.3

8

1.135

44

3259.185

TOTAL

104

26024.35

140

1150.8

92

14.41

336

27189.56

In the table below we have given basin wise figures of existing, under construction and proposed hydropower projects of all sizes in Uttarakhand.

Overview of all Hydropower projects in Uttarakhand


Basin Existing Hydro projects Under construction projects Proposed hydropower projects Total Hydro projects
No of projects Capacity, MW No of Projects Capacity, MW No of Projects Capacity, MW No of Projects Capacity, MW
Alaknanda

32

456.97

16

1291.1

74

5199.25

122

6947.32

Bhagirathi

13

1851.5

13

1084.75

22

801.9

48

3737.75

Ganga Sub basin

4

173.8

2

1.75

6

175.55

Ramganga

12

210.8

20

408.5

32

619.35

Sharda

28

427.75

8

0.375

48

12022.28

84

12450.405

Yamuna

9

478.195

2

0.14

33

2780.85

44

3259.185

TOTAL

98

3598.665

41

2378.115

197

21212.78

336

27189.56

Basin Maps Maps of Hydroelectric Projects in various sub basins of Uttarakhand are available at the following links. Please note that the maps are based on information available when the maps were created in 2011:

https://sandrp.in/basin_maps/Hydropower_Projects_in_Ganga_Basin.pdf

https://sandrp.in/basin_maps/Bhagirathi%20150411.jpg

https://sandrp.in/basin_maps/Alaknanda%20150411.jpg

https://sandrp.in/basin_maps/Mandakini150411.jpg

https://sandrp.in/basin_maps/Goriganga150411.jpg

https://sandrp.in/basin_maps/Major_Hydro_Projects_in_Yamuna_Basin.pdf


How do the hydropower projects increase the scale of disaster?

This is a question that a lot of journalists and TV anchors have been asking me since the Uttarakhand disaster. Here is a quick response:

Þ     Almost all hydropower projects of Uttarakhand involve deforestation. Deforestation directly increases the potential of erosion, landslides and floods since water now just runs off to the rivers. Moreover the compensatory afforestation and catchment area treatment, even when done, usually involves planting of commercially important variety of trees like pine and teak and not broad leaf tress like oaks which not only adds humus in the soil, but also allows rich under growth. Pine does not allow this to happen. This change in character of forests is something Gandhiji’s disciple Mira Behen has been warning since independence, but there is little impact of this on the forest department.

Þ     In fact largest proportion of deforestation in Uttarakhand has happened basically for hydropower projects.

Þ     All run of the river projects involve building of a dam, diversion structure, desilting mechanism, tunnels which could have length of 5 to 30 km and width sufficient to carry three trains side by side, as also roads, townships, mining, among other components. All of these components increase the disaster potential of the area in one or the other way. Cumulative impacts of all the components of any one project and all projects together  in a given basin is likely to be larger than the addition of the impacts of individual projects in many cases.

Þ     Massive blasting of massive proportions is involved in construction of all these components, which adds to landslide risks. In fact Uttarakhand’s Disaster Mitigation and Management Centre in their report of Oct 2012 after the Okhimath disaster of Sept 2012 recommended that no blasting should be allowed for any development activity anywhere in Uttarakhand, but Uttarakhand government did nothing about this recommendation.

Þ     The massive tunneling by itself weakens the young and fragile Himalayan mountains, increasing the disaster potential.

Þ     Each of the hydropower project generates immense amount of muck in tunneling, blasting and other activities. A large hydropower project could typically generate millions of cubic meters of muck. The large projects are supposed to have muck disposal plan, with land acquired for muck disposal, transportation of muck to the designated sites above the High Flood levels, creation of safety walls and stabilization process. But all this involves costs. The project developers and their contractors find it easier to dump this muck straight into the nearby rivers. In the current floods, this illegally dumped muck created massive disaster in downstream areas in case of 330 MW Srinagar HEP, the 76 MW Phata Byung HEP and the 99 MW Singoli Bhatwari HEP. When the flooded rivers carry this muck, boulders and other debris, has much greater erosion capacity and also leaves behind massive heaps of this muck in the flooded area. In Srinagar town about 100 houses are buried in 10-30 feet depth of muck. Such debris laden rivers also create massive landslides along the banks.

Muck Disposal directly into the Alaknanda river by Srinagar Project Photo: Matu janSangathan

Þ     Wrong operation of hydropower projects can also create greater disasters in the downstream areas. For example the operators of 400 MW Vishnuprayag HEP on Alaknanda river did not open the gates when the river was flooded on June 16-17, possibly to maximize power generation. However, this lead to accumulation of massive quantities of boulders (for photos of dam filled with such boulders see: http://matuganga.blogspot.in/) behind the dam, so much so that that there was no space for water to flow. The river then bypassed the dam and started flowing by the side of the dam, creating a new path for its flow. This created a sudden flashflood in the downstream area, creating a new disaster there.

Boulders devouring the Vishnuprayag Project. 26th June 2013 Photo: Matu jan Sangathan

Þ     The incomplete, broken and ill designed protection wall of the Maneri Bhali projects in Uttarkashi lead to erosion and landslides in the downstream areas.


DAMAGED HYDRO PROJECTS A large number of hydropower projects are likely to have suffered damage due to the flood disaster in Uttarakhand. Some of the projects that have suffered damage include:

  • According to the update from http://www.energylineindia.com/on June 27, 2013, the 520 MW under construction Tapovan Vishnugad HEP has suffered damaged by rains on June 16, 2013: “While construction of diversion tunnel was completed in April this year, the same was washed away due to heavy rains on June 16. Diversion dyke has washed away and damages have been observed in chormi adit approach road. In August last year, the flash floods had caused serious damages in the coffer dam of the project.”
  • 400 MW Vishnuprayag HEP of JP Associates has suffered serious, but as yet unassessed damage(http://www.indianexpress.com/news/jaiprakash-power-tanks-15–as-plant-shuts-down-in-uttarakhand/1133083/). As per MATU PR (http://matuganga.blogspot.in/), the project has also been cause of damage in Lambagad village, which was also flahsed on front page of TOI on June 25, 2013, though without mentioning the project. The blog also provides the before and after pictures of the upstream and downstream of the project.
  • 76 MW Phata Byung HEP of Lanco in Mandakini Valley in Uttarakhand
  • 99 MW Singoli Bhatwari HEP of L&T in Mandakini Valley in Uttarakhand NDTV India reported that the water level of the river has gone up due to the silt dumped by dams. This is likely to be due to the Phata Byung and Singholi Bhatwari HEPs.
  • Kali Ganga I, Kali Ganga II and Madhyamaheshwar HEP, all in Mandakini Valley, all of UJVNL, all hit by mudslides (http://www.indianexpress.com/news/uttarakhands-r500-crore-request-to-prevent-landslides-pending-since-2009/1132351/)
  • Assiganga projects on Assiganga river in Bhagirathi basin in Uttarakhand
  • 5 MW Motighat I HEP in Goriganga basin in Pithoragarh (Himalprakriti report)
  • 280 Dhauliganga Project of NHPC in Pithoragarh district of Uttarakhand (reports said the power house was submerged, but is now working, part of the township was submerged.)
  • The Himalaya Hydro (HH) Tanga Phase I for 5 MW, located along the Paina gad in Goriganga basin, is badly damaged. The dam has got smashed by a deluge of huge boulders. One sluice gate is torn through. The metal filter-gates are all choked with boulder debris, and the remnant concrete and gate pulleys of the dam are now stranded mid-river, with both banks eroded and the river now running along the true-left bank. (Himalprakriti report)
  • The UREDA 500 KW Motigad microhydel on Moti gadh (a tributary of Paina gadh) at Bindi (Dani Bagad) is also badly damaged. The water has broken through the wall, cut under the foundation, inundated the turbines with water and debris, and smashed the housing for the electrical distribution system. (Himalprakriti report)
  • The 5.5′ diameter head race waterpipes taking water to the HH Phase II, located on the Gori opposite Seraghat, has also been damaged. The generator and housing for the HH Ph II has collapsed into the river. All this damage is said to have happened on the evening of 17th June. People working as non-skilled labour have been sent home for a few months, but welding work on the new pipes feeding the powerhouse is still underway! (Himalprakriti report)

It has been now reported in Business Standard (http://www.business-standard.com/article/companies/gvk-l-t-hydel-projects-hit-by-floods-113062300394_1.html) that the 330 MW Srinagar project, a cause for downstream destruction, has itself suffered massive damages on June 17, 2013, with breach of its protective embankment. The report also mentions the damage to the L&T’s Singoli Bhatwari HEP on Mandakini river.

Down to Earth (http://www.downtoearth.org.in/content/hydropower-projects-suffer-severe-damage) has given some details of damage to some of the hydropower projects, quoting UJVNL sources. It says: 19 small hydropower projects have been completely destroyed, while others have been damaged by the raging waters (see table below)

Project Location Capacity Estimated Loss
Dhauli Ganga Pithoragarh  280 MW Rs 30 crore (project completely submerged)
Kaliganga I Rudraprayag 4 MW Rs 18-19 crore (power house and 4 houses washed away)
Kaliganga II Rudraprayag 6 MW Rs 16 crore (power house and 4 houses washed away)
Sobla Pithoragarh 8 MW Rs 14 crore (completely washed away)
Kanchauti Pithoragarh 2 MW Rs 12 crore (totally washed away)
Chirkila Pithoragarh 1.5 MW Rs 20 crore (part of the project washed away)
Maneri Bhali I&II Uttarkashi 304+90 MW Rs 2 crore + Rs 5 crore (walls collapsed, silt in barrages)

In addition, a large  number of projects had to stop generation temporarily due to high silt content, including Maneri Bhali I and II, Tanakpur, Dhauli Ganga, Kali Ganga I, some of the Yamuna basin projects among others.


Conclusion This article was intended to give an overview of hydropower projects in Uttarakhand. However, we should add that there are many glaring issues related to these hydropower projects, some of the key issues include:

  • Most of these projects are out of the environmental governance. Projects below 25 MW do not require EIA, Social Impact Assessment, public consultation, environmental clearance, environmental management plan or monitoring. This is clearly wrong as all projects have environmental impacts, and they are particularly serious in Himalayan region with multiple vulnerabilities. We have for years demanding that all projects above 1 MW should need environment clearance, EIA and so on.
  • Even for projects above 25 MW we do not have any credible environmental or social impact assessment. Former Environment Minister Jairam Ramesh is on record having accepted that most EIAs are dishonest cut and paste jobs. We do not have any credible process in place to ensure that EIAs are proper and those that are not are rejected and consultants are black listed. Jairam Ramesh did put in place a process of registration of EIA consultants under the Quality Council of India, but that is completely non transparent, unaccountable and ineffective process. It is amazing that reputed NGOs like the Centre for Science and Environment are on board of this process, but they have completely failed to achieve any change and have chosen to remain quiet.
  • The Environment clearances of the River Valley Projects (which includes hydro projects and dams) is considered by the Expert Appraisal Committee on River Valley Projects appointed by Union Ministry of Environment and Forests. However, the ministry chooses members of the EAC such that they rarely object to any project. As per SANDRP analysis in six years ending in Dec 2012, the EAC had not said NO to any project for environment clearance. Its appraisal of projects, EIAs, public consultation process and its own minutes were found to be inconsistent, unscientific and loaded in favour of the project developers.
  • Our environment compliance system is non-existing. The projects are supposed to implement the environment management plan pari passu with the project work, they are supposed to follow the conditions of environment clearance, follow the environmental norms, but who is there to ensure this actually happens? The Union Ministry of Environment and Forests which is supposed to ensure this compliance has no capacity the officials tell us. The officials do not have time to even check if six monthly compliance reports are being submitted or make any surprise visits. However they do not even seem to have will, since we have seen no change in this situation for decades. Nor do they seem to have willingness, since even when NGOs present photographic and video and other evidence of violations they refuse to take action.
  • One way to achieve compliance is to have a project monitoring committee for each project where over 50% of the members are from local communities and other independent persons and such committees ok must be required each stage for the project to go ahead. We have been suggesting this for long, but the MoEF has shown no willingness to follow this.
  • More pertinently, none of the assessment reports look at the impact on the disaster potential of the area. Each of these projects have significant impact on the disaster potential of the area, particularly in the context of a vulnerable state like Uttarakhand. This should be a must for all such projects.
  • Similarly the projects must also be assessed in the context of climate change, again in vulnerable area like the Himalayas. How the project will impact the local climate, how it will have impact on adoption capacity of the local communities and also how the project itself will be impacted in changing climate. This again we have been writing to the MoEF numerous times, but without any success so far.
  • Most significantly, the only impact assessments that we have is for specific projects of over 25 MW capacity. However, we have no credible cumulative impact assessment for any of the river basins of Uttarakhand, which also takes into account carrying capacity of the river basins and all the interventions that are happening in the basins. As our critique of so called cumulative impact assessment of Bhagirathi-Alaknanda basins done by AHEC of IIT Roorkee shows (see:  http://www.sandrp.in/hydropower/Pathetic_Cumulative_Impact_Assessment_of_Ganga_Hydro_projects.pdf), it was not much of a cumulative impact assessment. WII (Wildlife Institute of India, Dehradun) report was somewhat better within the mandate given to it (assessment of hydro projects on aquatic and terrestrial biodiversity), but the most important recommendation of the WII report that at least 24 projects should be dropped has not been accepted by the MoEF, so what is the use of the cumulative impact assessment in such a situation?

Unless we address all of the above issues in a credible way, there is little wisdom in going ahead with more hydropower projects in Uttarakhand. They will invite greater disasters. Uttarakhand has many other options for development.

  • Firstly people of  Uttarakhand should get first right over all the power that is getting generated within Uttarakhand.
  • Secondly, this is not a plea for no projects, but to address the crucial issues without addressing which we are in no situation to even know the impacts or address the issues.
  • Thirdly, Uttarakhand needs to take up power generation options that do not accentuate the disaster potential of the area. Such options include micro hydro, hydro kinetics, and solar and biomass based power in addition to better utilization of existing infrastructure.

Going ahead with more hydropower projects in current situation would be invitation to greater disasters. In fact, the Uttarakhand government should not allow even the damaged and under construction hydropower projects until al the conditions mentioned above are satisfied.

Some of the hydropower projects that have surely seem to have added to the disaster proportions of current Uttarakhand flood disaster include the 400 MW Vishnuprayag HEP, the 280 MW Dhauliganga HEP, the 330 MW Shrinagar HEP, the 304 and 90 MW Maneribhali II and I HEPs, the 99 MW Singoli Bhatwari HEP and the 76 MW Phata Byung HEP, the last two on Mandakini river.

In response to my question on a programme on Headlinestoday channel anchored by Rahul Kanwal on July 8, 2013 (in presence of panel that also included Dr Vandana Shiva and Vimlendu Jha), the Uttarakhand Chief Minister Shri Vijay Bahuguna agreed that he will institute an enquiry into the damage due to these hydropower projects and hold them accountable for such damage.

Let us see how soon and how independent and credible enquiry he institutes.

Himanshu Thakkar

 South Asia Network on Dams, Rivers & People (www.sandrp.in)                                                        July 2013

References:

1. http://envfor.nic.in

2. http://www.uttarakhandjalvidyut.com/eoi/list_of_projects_self.pdf and many other UJVNL documents.

3. http://www.ahec.org.in/shp%20sites/uttarakhand/Hydropower%20stations%20in%20operation%20and%20under%20construction%20in%20uttarakhand.pdf

4. http://cleanhydropower.blogspot.in/2009/07/brief-description-of-small-hydro-power.html

5. http://ureda.uk.gov.in/pages/show/130-micro-hydro-programme and other sites of UREDA.

6. https://sandrp.in/env_governance/TOR_and_EC_Clearance_status_all_India_Overview_Feb2013.pdf

7. https://sandrp.in/IMG_report_on_Ganga_has_Pro_Hydro_Bias_June2013.pdf

8. http://www.sandrp.in/hydropower/Pathetic_Cumulative_Impact_Assessment_of_Ganga_Hydro_projects.pdf

9. 2012-13 Annual report of Ministry of New and Renewable Energy: http://mnre.gov.in/file-manager/annual-report/2012-2013/EN/chapter3.html

SANDRP blogs on Uttarakhand disaster :

1. https://sandrp.wordpress.com/2013/06/21/uttarakhand-deluge-how-human-actions-and-neglect-converted-a-natural-phenomenon-into-a-massive-disaster/

2. https://sandrp.wordpress.com/2013/06/23/uttarakhand-floods-disaster-lessons-for-himalayan-states/

3. https://sandrp.wordpress.com/2013/06/25/uttarakhand-and-climate-change-how-long-can-we-ignore-this-in-himalayas/

4. https://sandrp.wordpress.com/2013/06/25/central-water-commissions-flood-forecasting-pathetic-performance-in-uttarkhand-disaster/

5. https://sandrp.wordpress.com/2013/06/28/uttarakhand-floods-truth-about-thdc-and-central-water-commissions-claims-about-tehri/

6. https://sandrp.wordpress.com/2013/06/29/lessons-from-uttarakhand-disaster-for-selection-of-river-valley-projects-expert-committee/

7. https://sandrp.wordpress.com/2013/06/25/climate-justice-statement-on-the-uttarakhand-catastrophe/