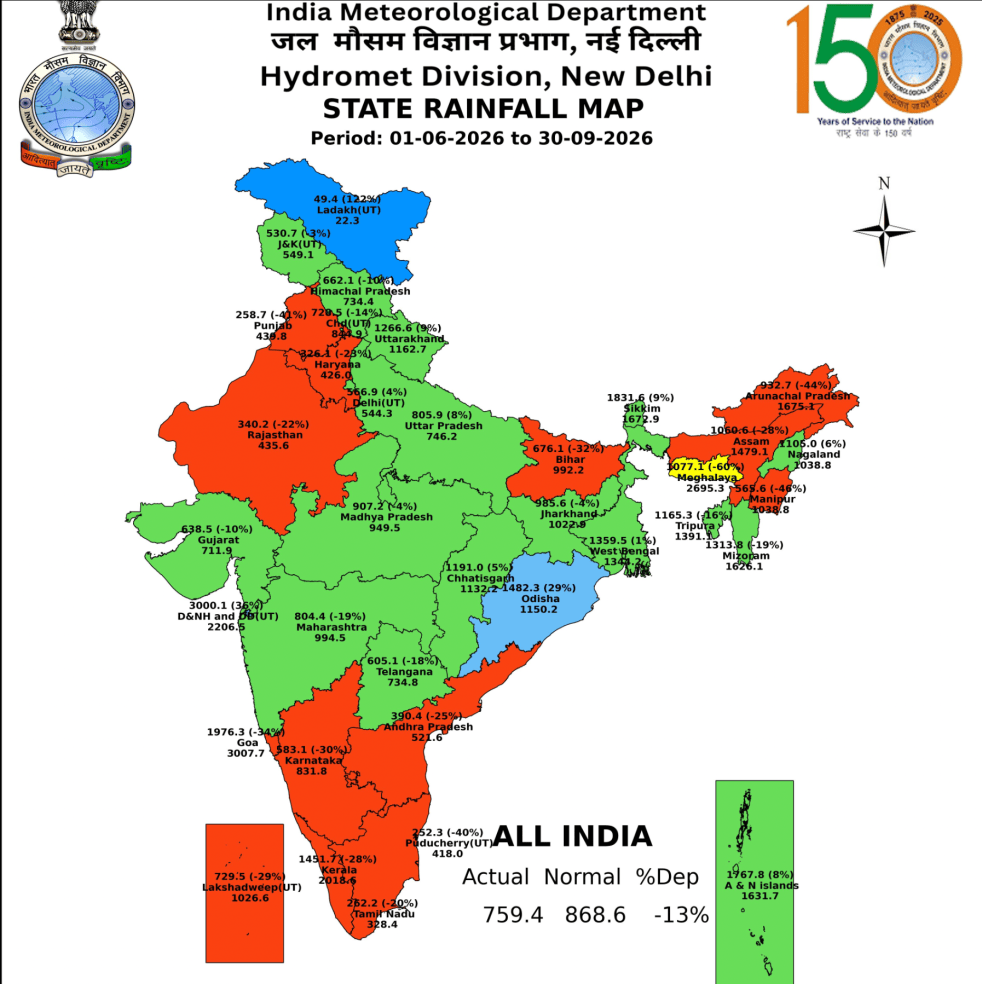
In the just concluded South West Monsoon 2026, India received 759.4 mm (937.2 mm in SW Monsoon 2025, 934.8 mm in SW Monsoon 2024, 820 mm in SW Monsoon 2023, 925 mm in SW Monsoon 2022[i]) rainfall, about 87.4% (107.9% in 2025, 107.6% in 2024, 94.45 % in 2023, 106.5% in 2022) of the Normal SW Monsoon rainfall of 868.6 mm as per India Meteorological Department (IMD). The 2026 SW Monsoon rainfall is 4th lowest since 2001 and first deficient monsoon since 2015. It is the 13th lowest rainfall since 1901. This rainfall is categorised as deficient rainfall since deficit is over 10%.
In SW Monsoon 2021, the rainfall was 874.6 mm, 0.68% below normal rainfall. In SW Monsoon 2020, the rainfall was 956.7 mm, or about 8.74% above normal and in SW Monsoon 2019 it was 10.4% above normal.
Monsoon has yet to withdraw from India till Sept 30, when IMD closes its SW Monsoon record books. The monsoon after 8 am on Sept 30 will be counted in post monsoon rainfall. The monsoon is likely to take another couple of weeks to withdraw from the country and this may also delay the onset of NE Monsoon, that is active mainly in some parts of South India. The NE Monsoon onset is likely after Oct 15 2026.
Monthly Rainfall The Month wise rainfall during the SW Monsoon 2026 was as follows.
| Month | Actual Rainfall, mm | Normal Rainfall, mm | % Departure |
| June | 99.5 | 165.3 | 60.2 |
| July | 290.3 | 280.5 | 103.5 |
| Aug | 213.9 | 254.9 | 83.9 |
| Sept | 155.7 | 167.9 | 92.7 |
| SW Monsoon 2026 | 759.4 | 868.6 | 87.4 |
Need for an index of rainfall distribution spatially and temporally As we can see from the table above, the rainfall varied from over 39.8% below normal in Jun to 3.5% above normal in July. There has been even wider variation spatially and temporally, but we do not have an index of rainfall distribution over time and space that captures these variations. What we need is an index of rainfall that will not only capture the quantum of rainfall as it does today, but also the temporal and spatial distribution of rainfall across the monsoon and across the nation or states. This will give a better picture of the monsoon rainfall and would also help us understand how this index is changing.
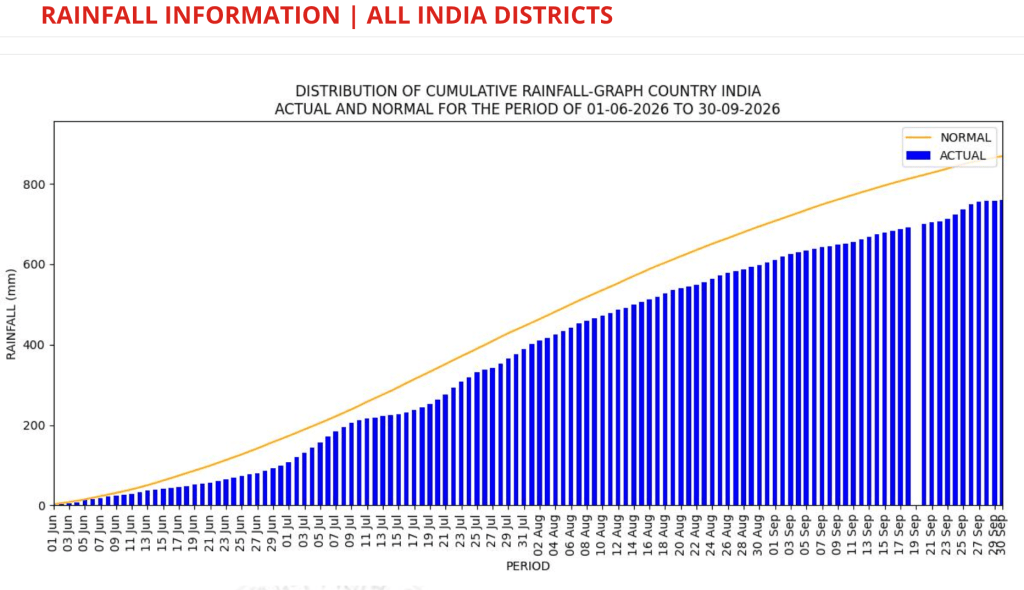
Daily National Rainfall Bar Chart The bar chart above is for the Daily National Rainfall figure for the SW monsoon period from June 1 to Sep 30 2026. Regional rainfall figures for SW Monsoon 2026 is given in table below.
| Region | Actual Rainfall, mm | Normal Rainfall, mm | % Departure |
| E & NE India | 1017.1 | 1367.3 | -26 |
| NW India | 553 | 587.6 | -6 |
| Central India | 952.8 | 978 | -3 |
| South Peninsula | 542 | 716.2 | -24 |
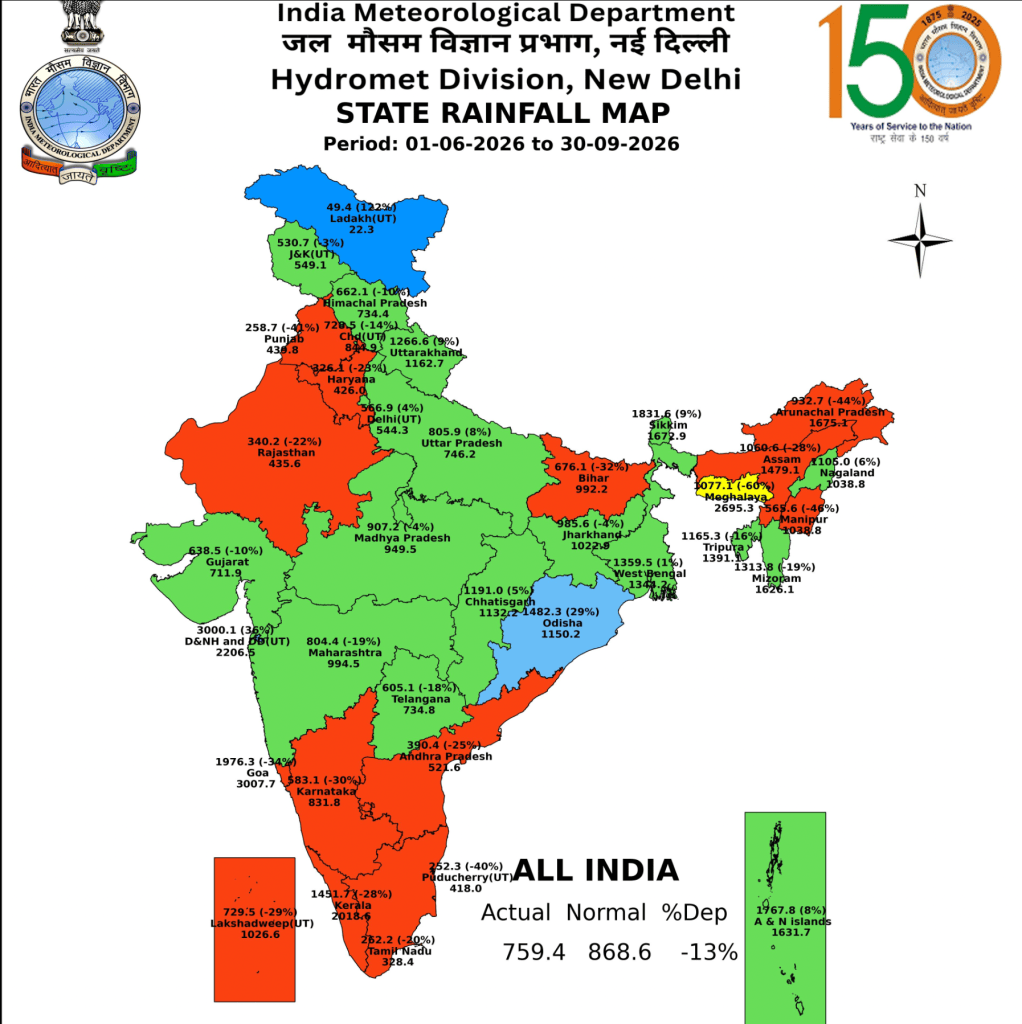
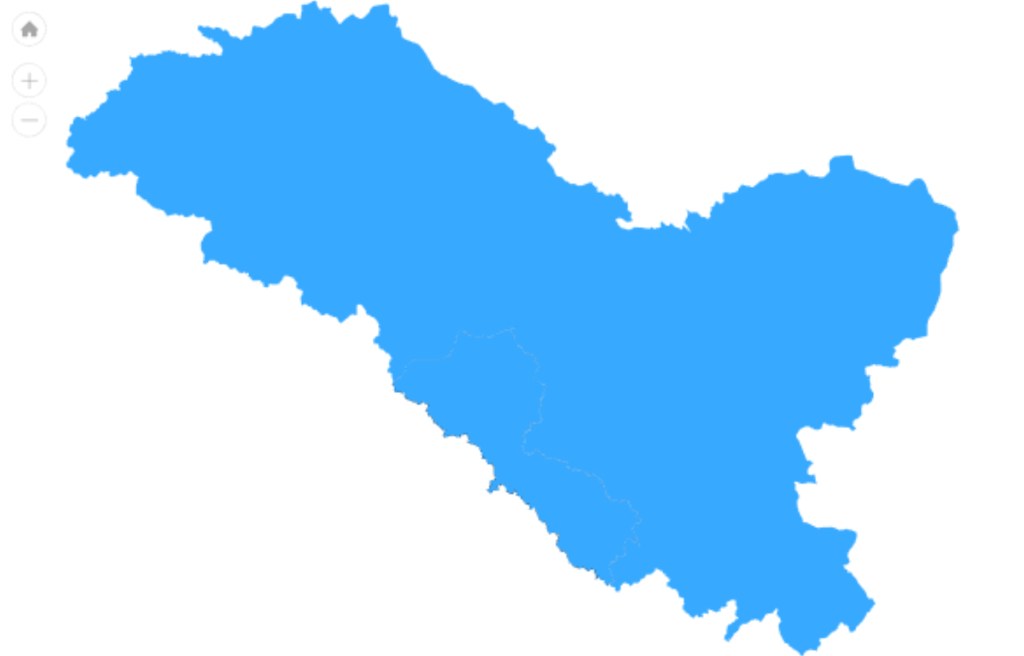
State wise Rainfall As we can see from the IMD map above, in the four month long South West Monsoon 2026, out of 36 States and Union Territories (UTs), One (Ladakh) had Large Excess, Two (Odisha and Dadra-Nagarhaveli-Diu-Daman) had Excess (Actual rainfall 20-59% above normal), 18 had normal (Actual rainfall 19% below normal to 19% above normal), 14 had deficit (Actual rainfall 20-59% below normal rainfall) and one (Meghalaya) had Large Deficit (Actual rainfall over 60% below normal) in rainfall. Ladakh had the lowest rainfall (like in 2022-2025) at 49.4 mm and highest surplus at 122%. Diu-Daman-Dadra-Nagarhaveli had the highest rainfall at 3000.1 mm.
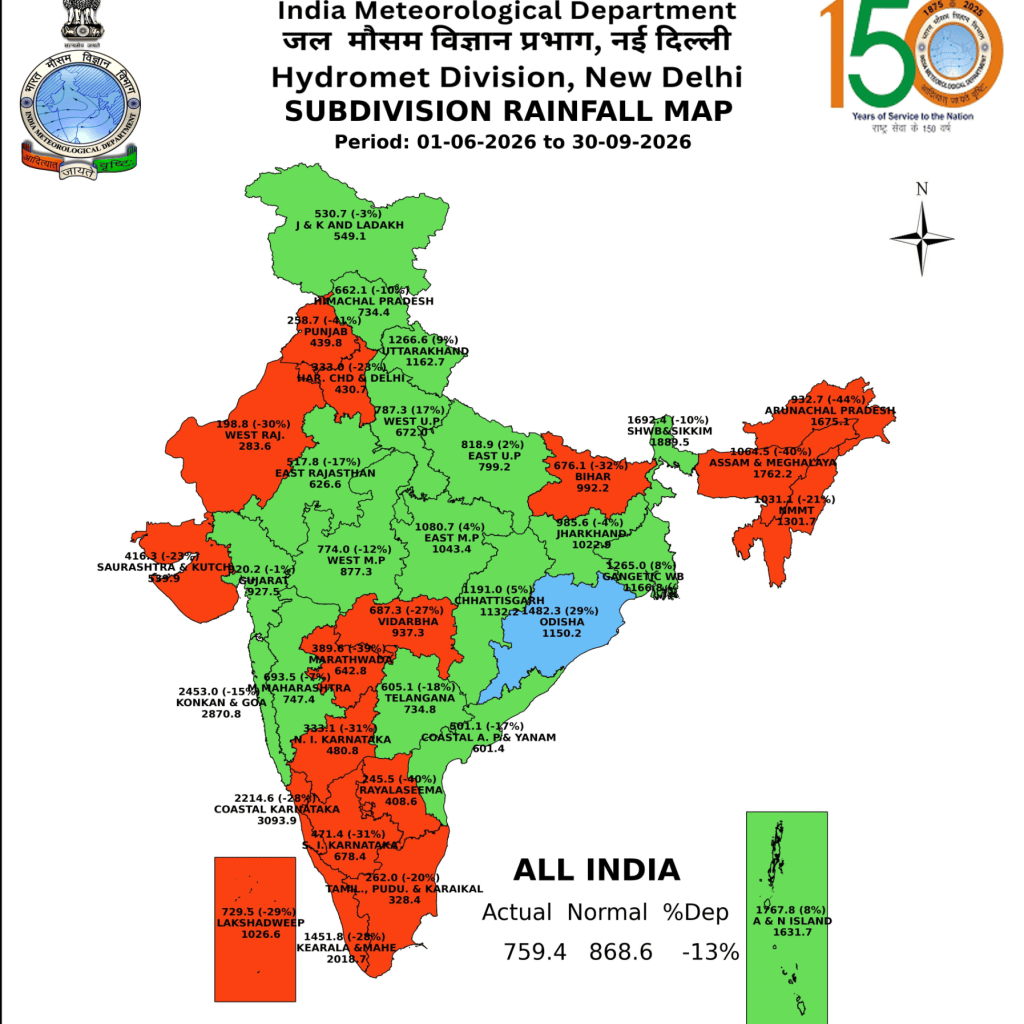
Sub Division wise rainfall IMD divides India into 36 meteorological divisions (the logic of many of them is questionable). As we can see from the IMD map of Sub Division wise rainfall above of SW Monsoon 2026, NO sub division had Large Excess rainfall, One (Odisha) sub division had excess rainfall, 18 had Normal rainfall and 17 had deficit rainfall. Coastal Konkan and Goa had the highest rainfall at 2453 mm and W Rajasthan had the lowest at 198.8 mm rainfall. Odisha had the highest surplus rainfall % at 29%. Assam-Meghalaya had the highest deficit rainfall % at 44%.
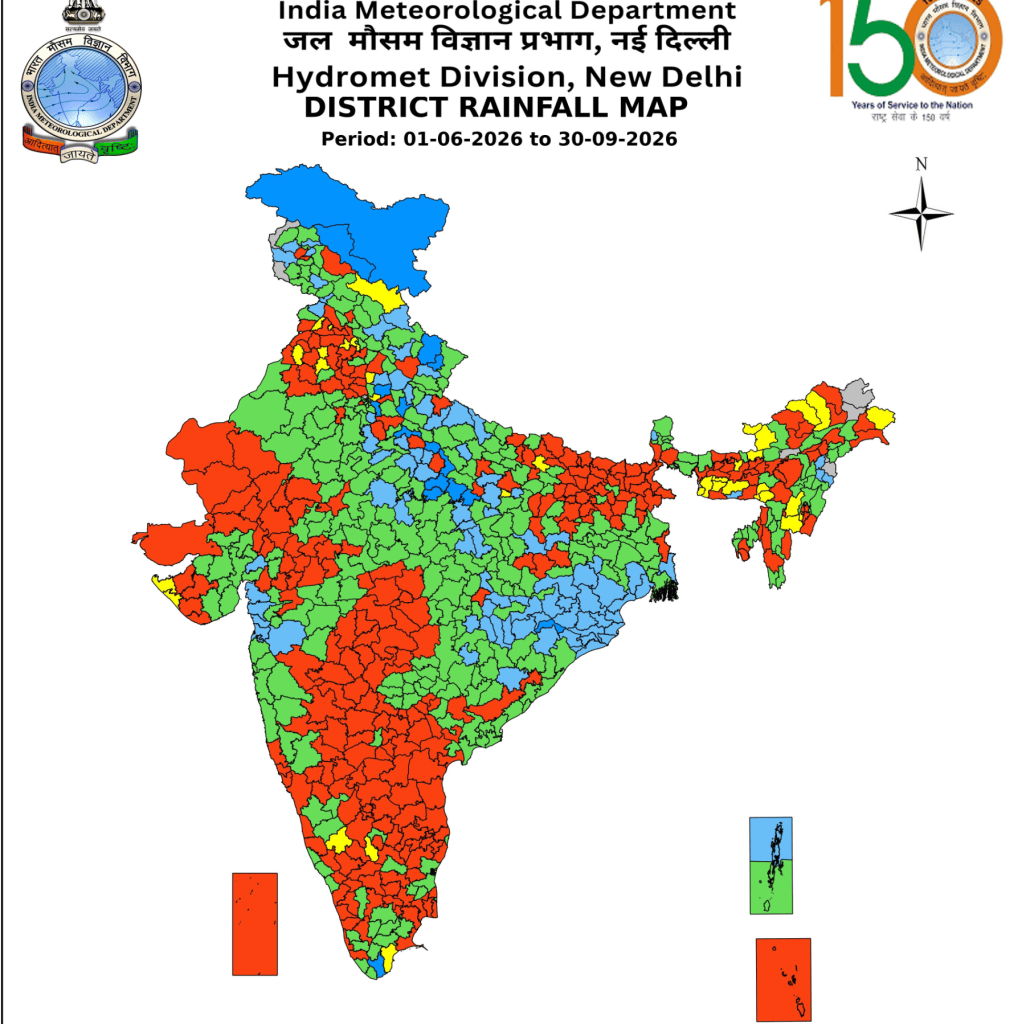
All India District wise rainfall departure map The map above provides district wise picture of rainfall at all India level.
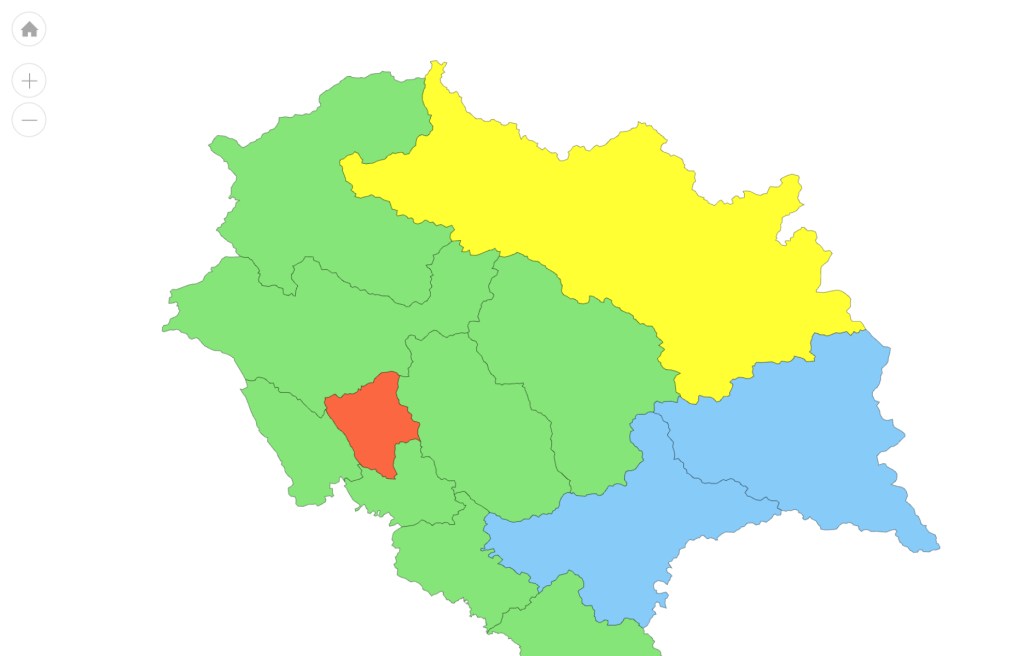
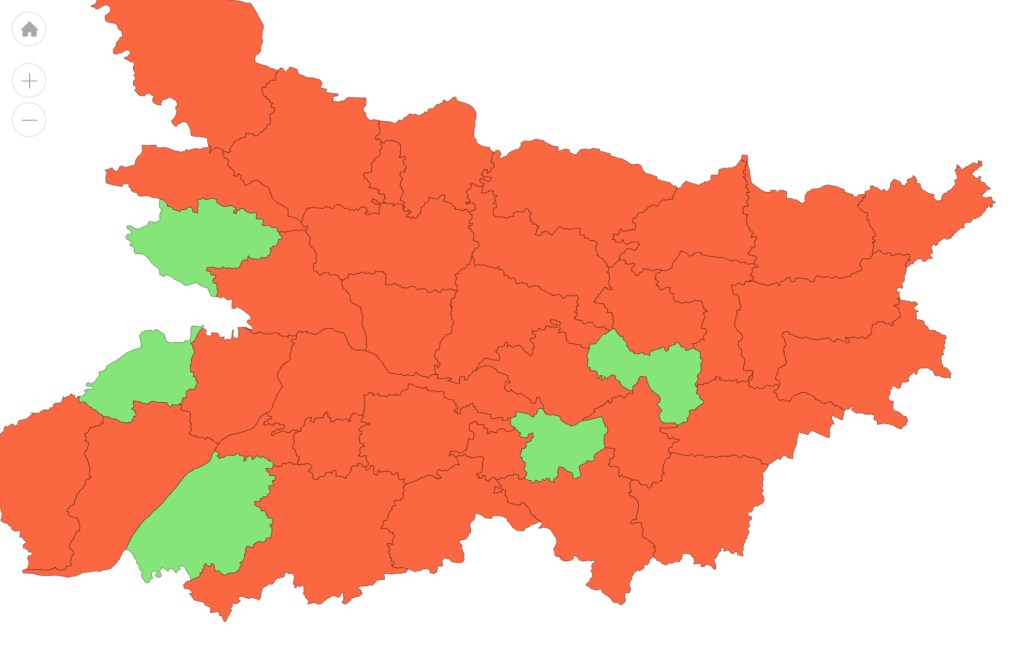
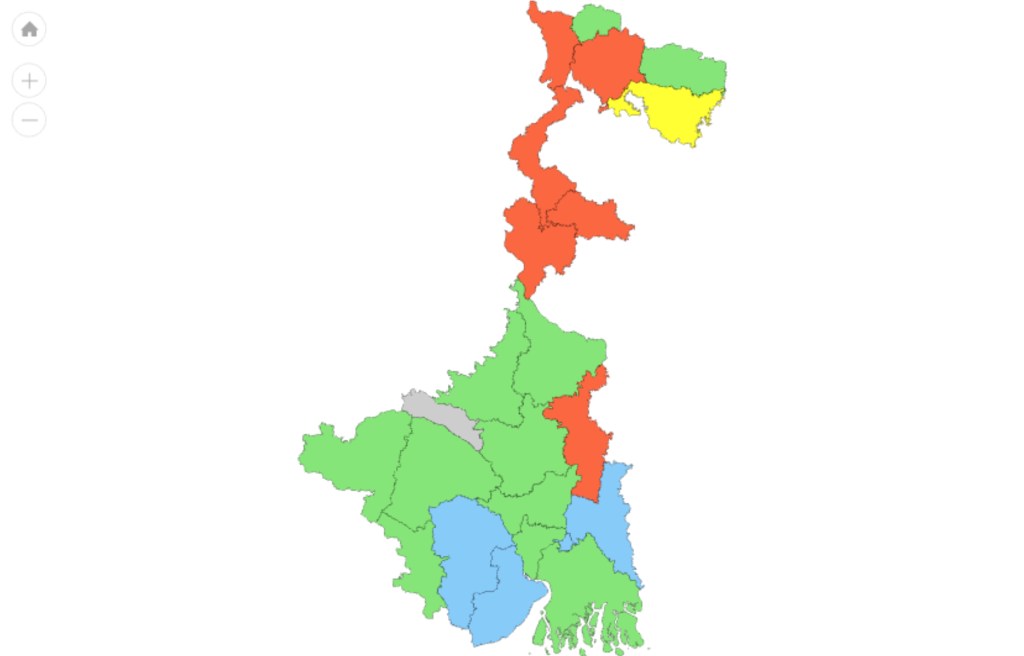
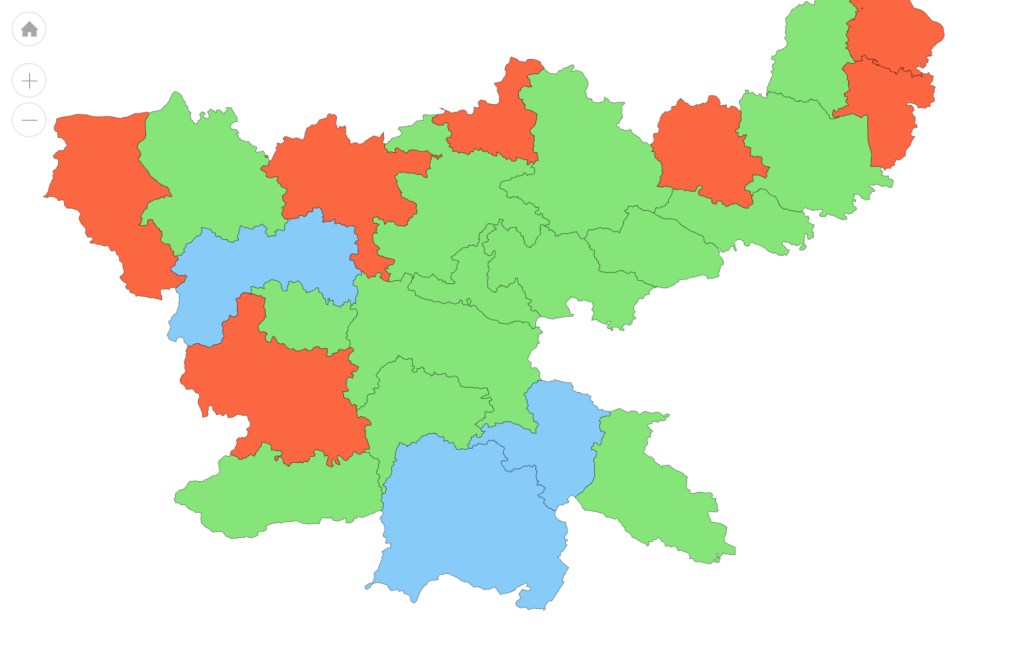
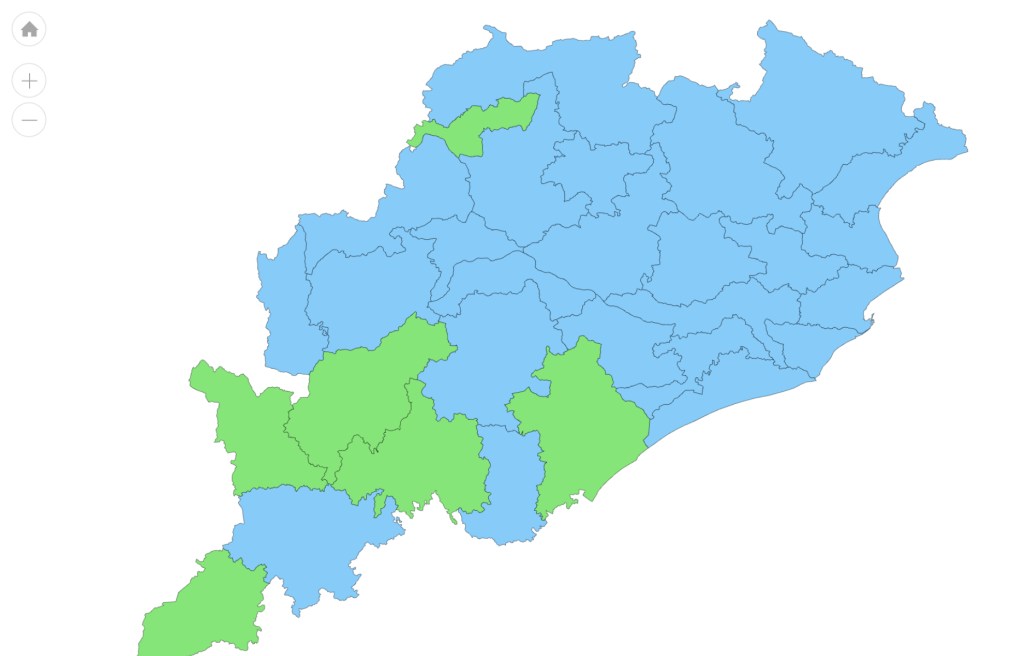
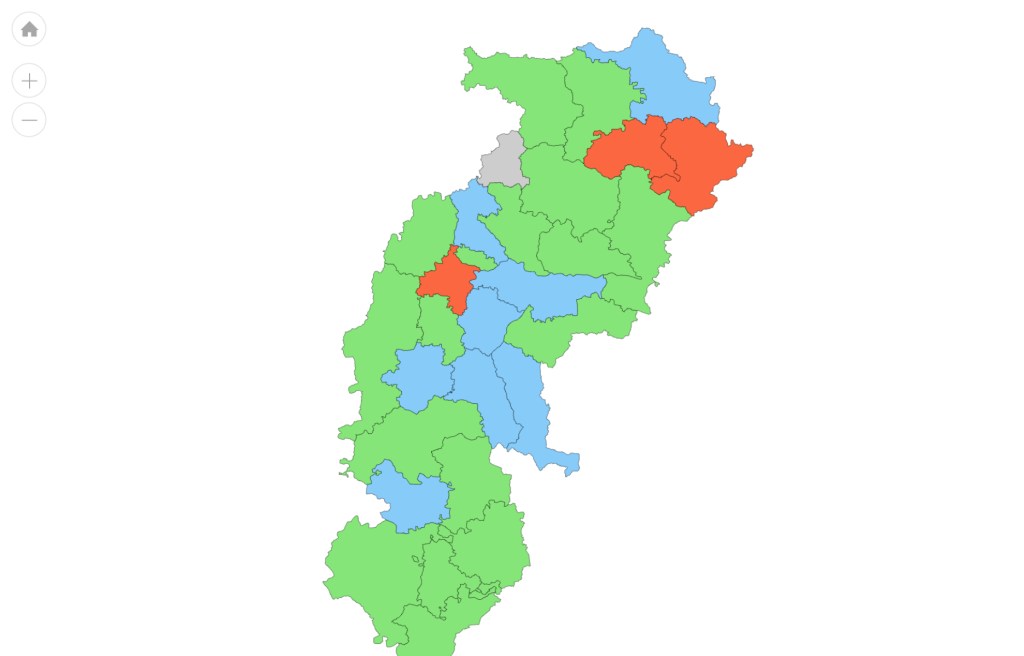
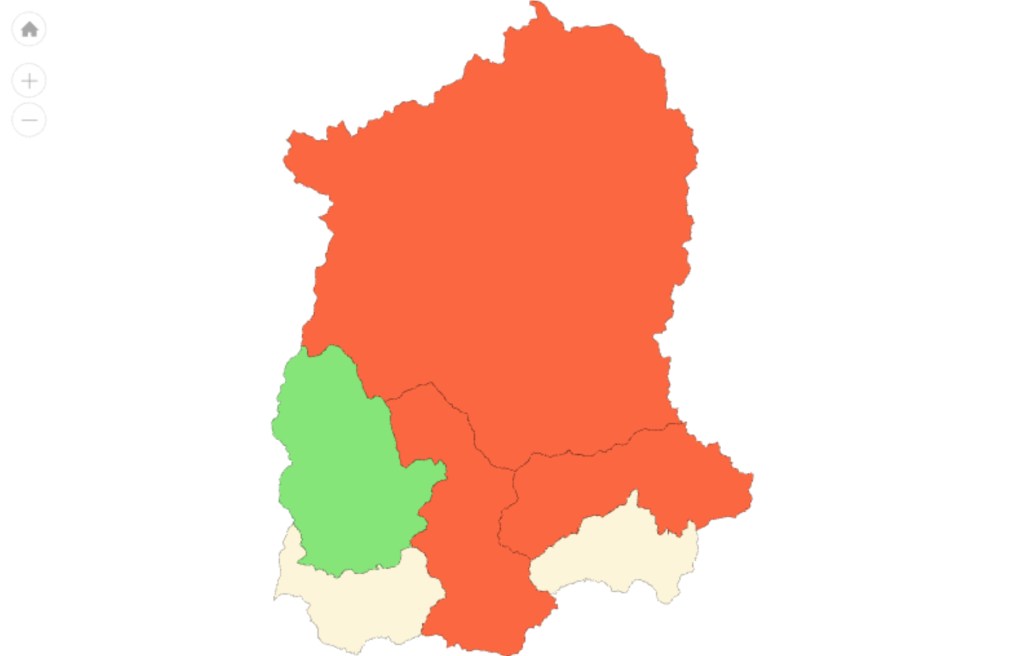
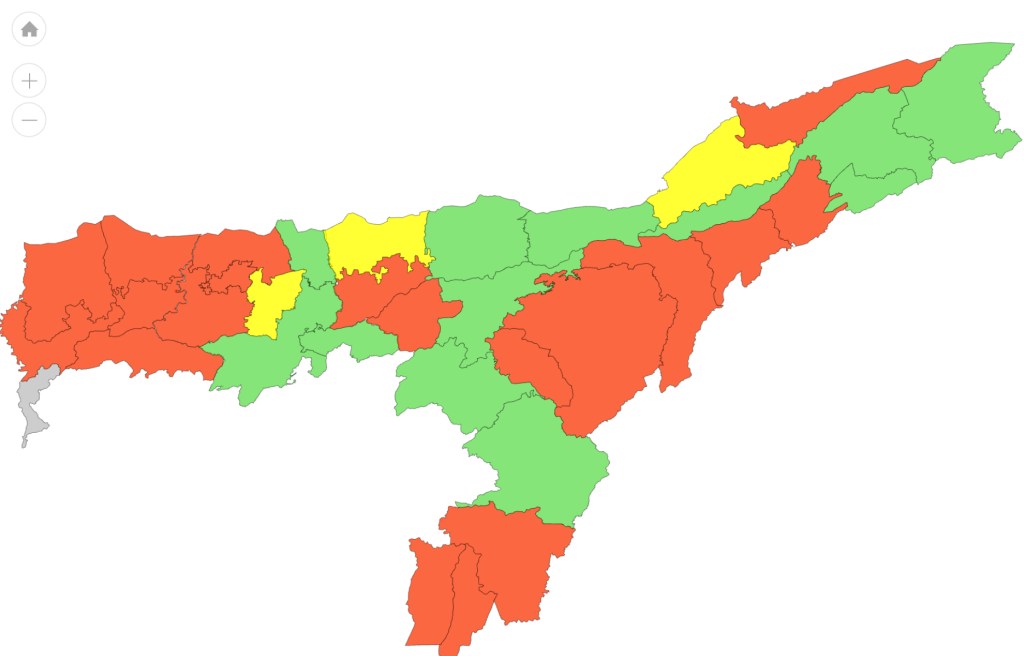
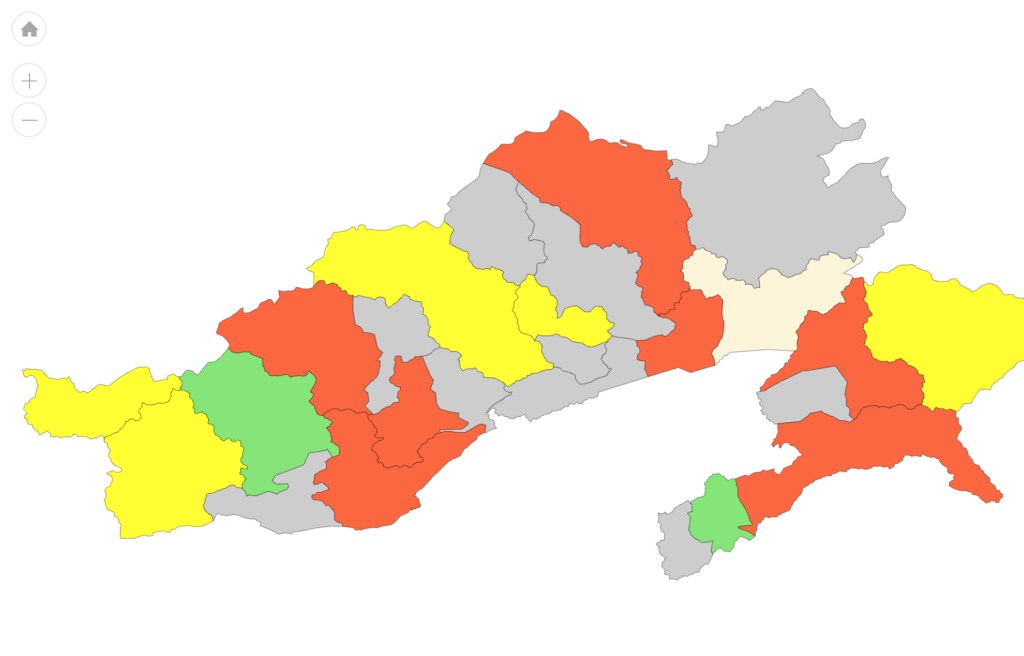
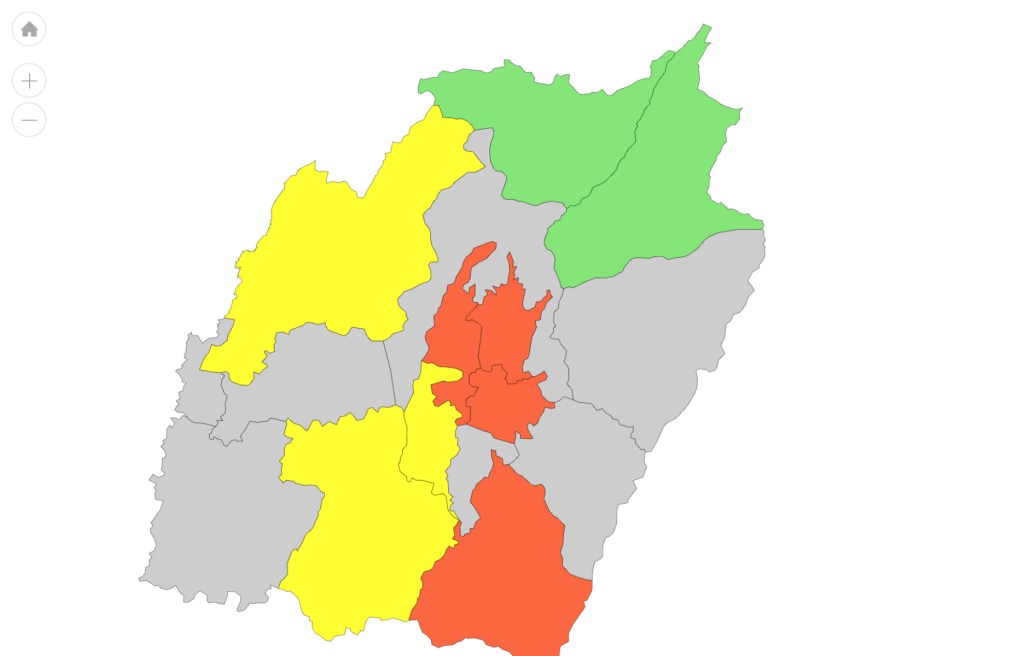
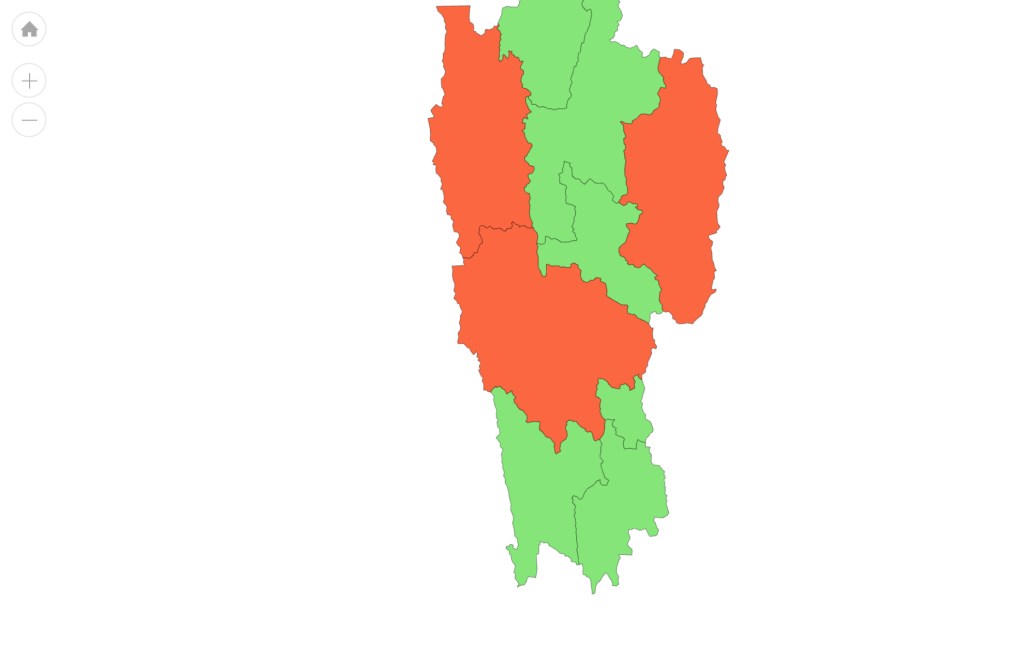
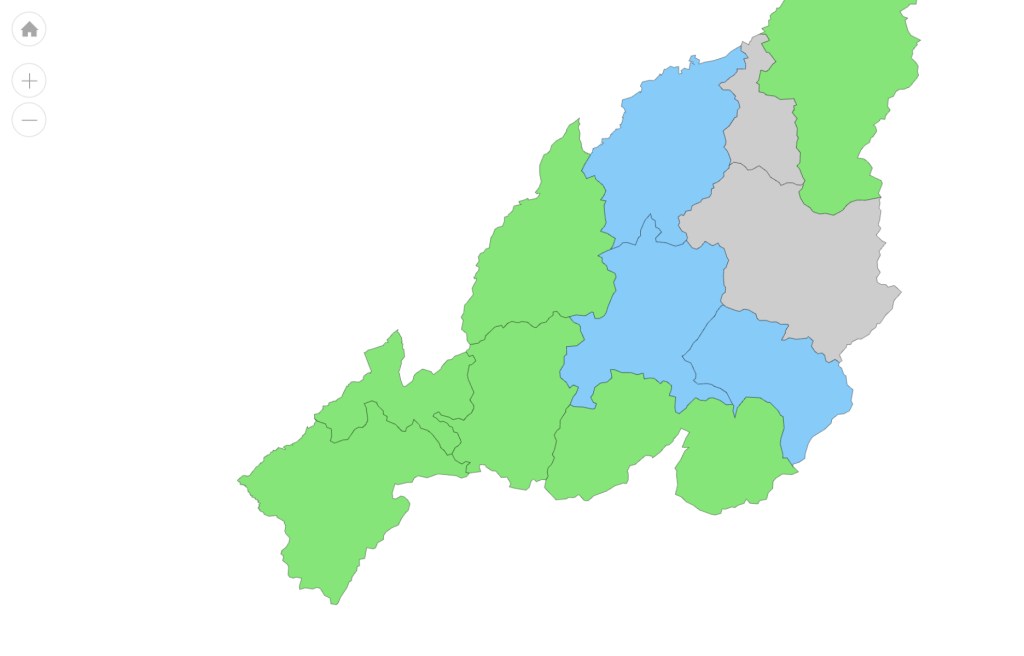
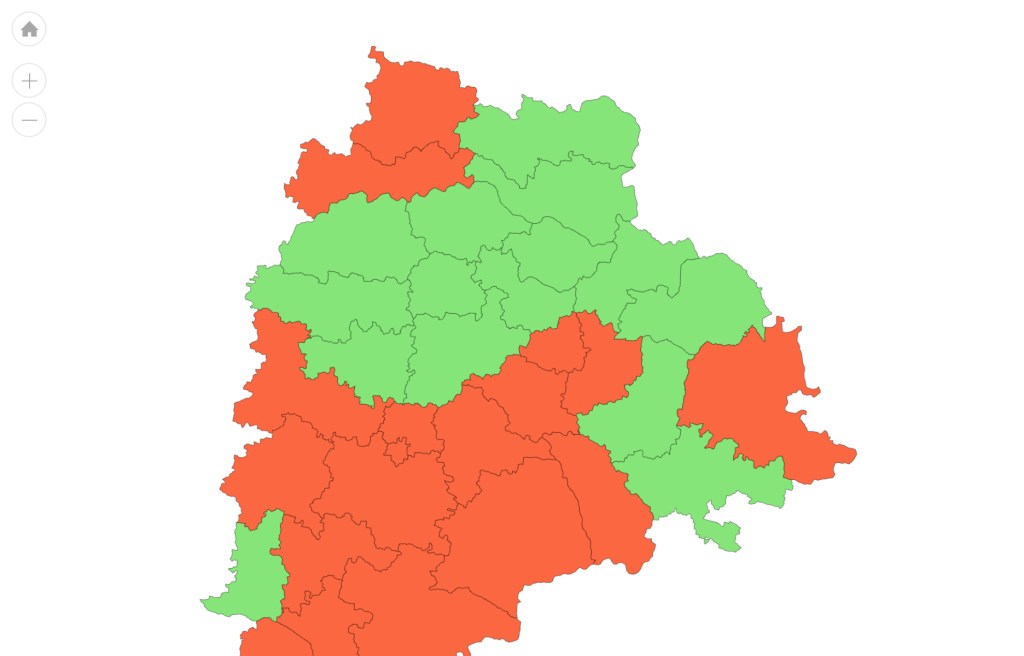
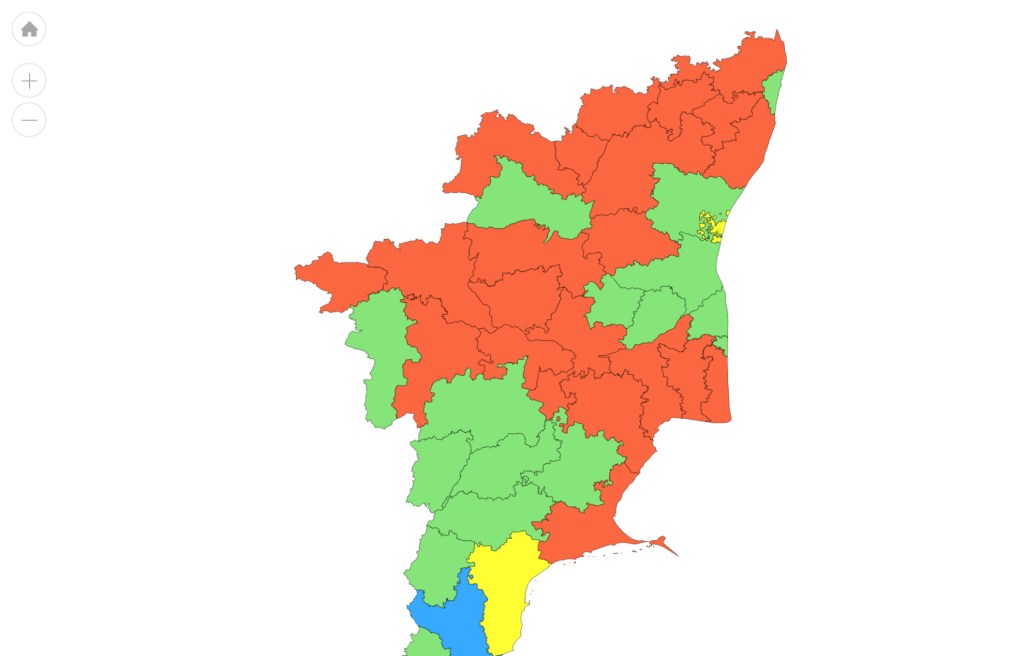
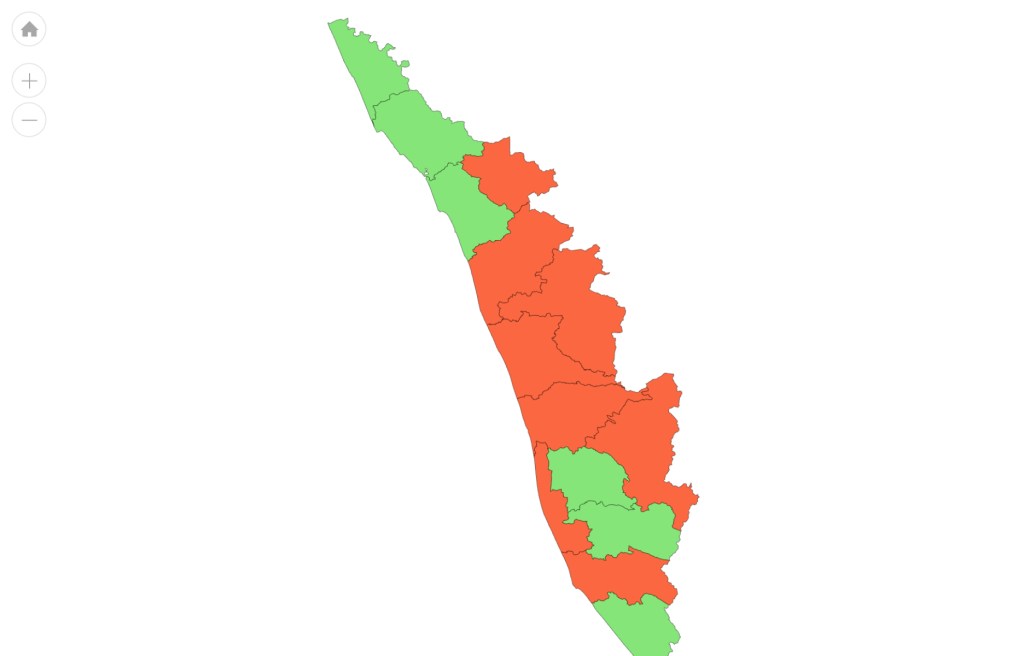
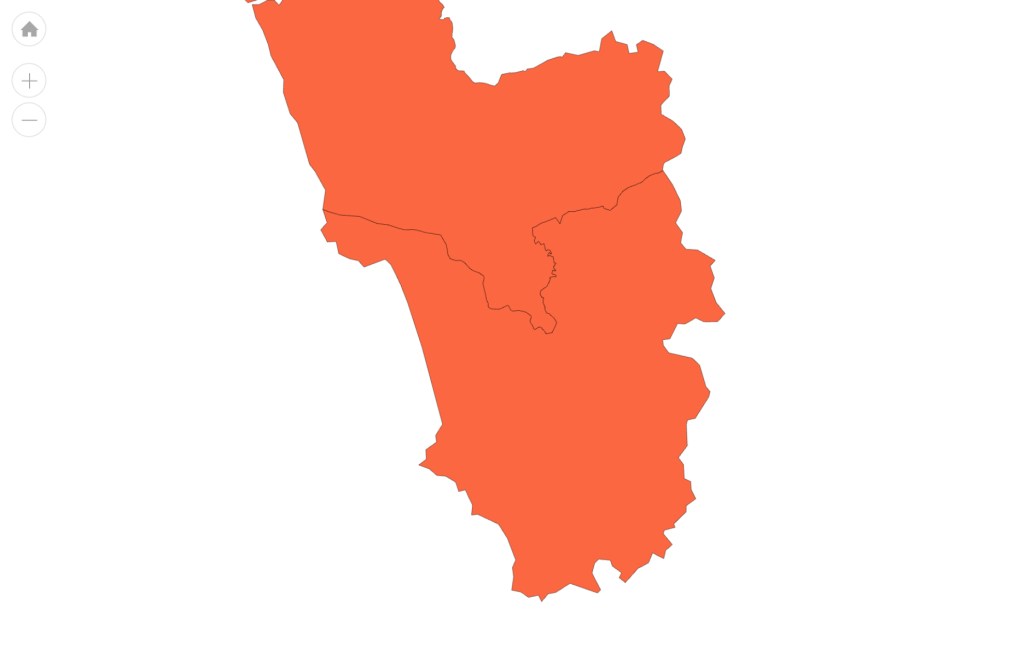
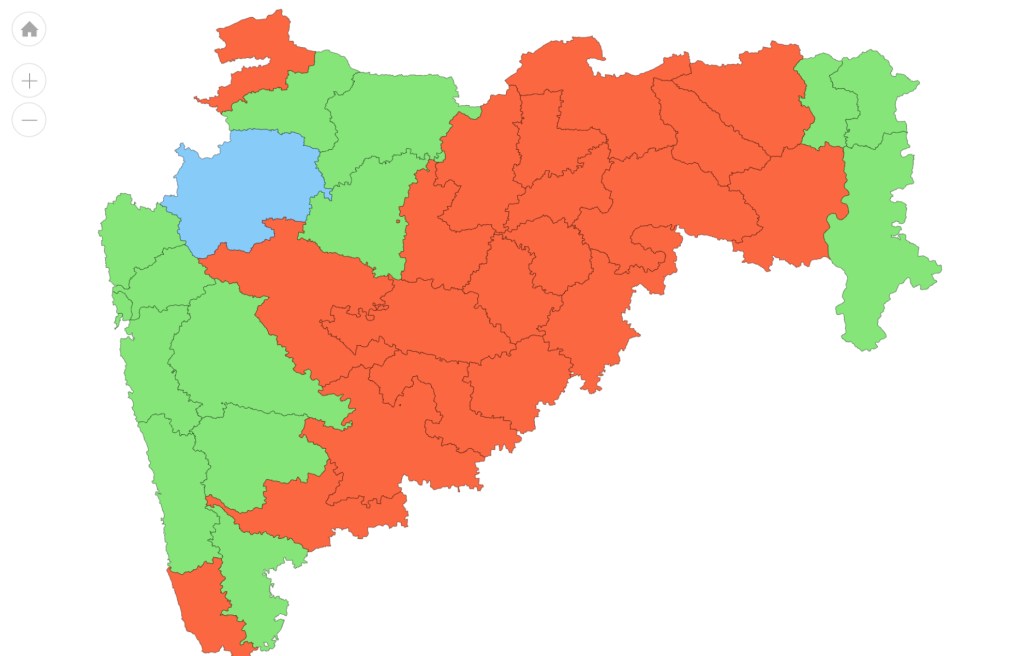
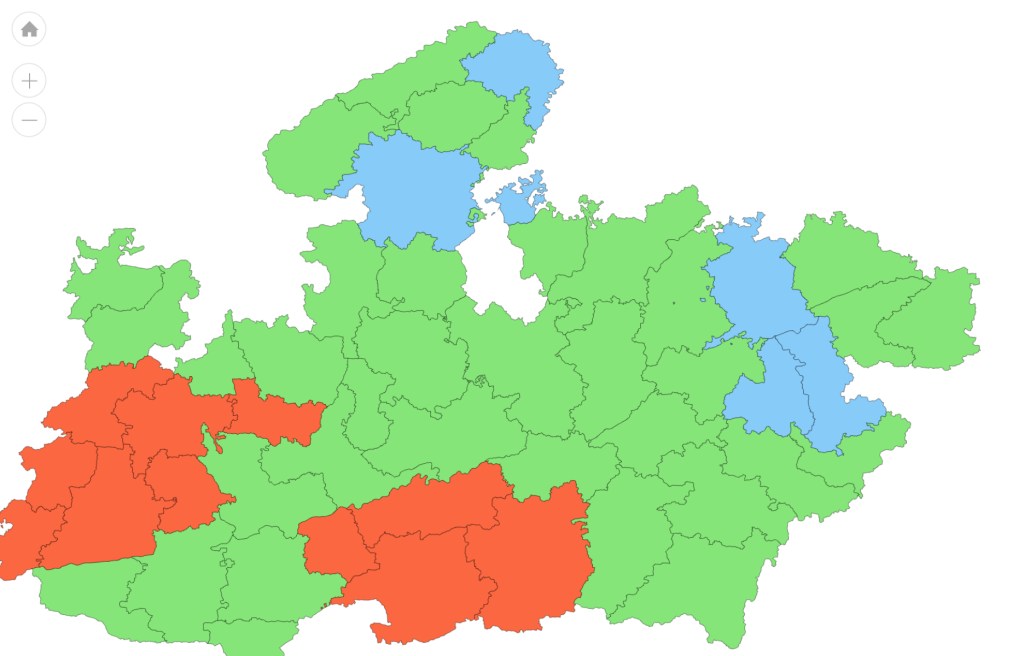
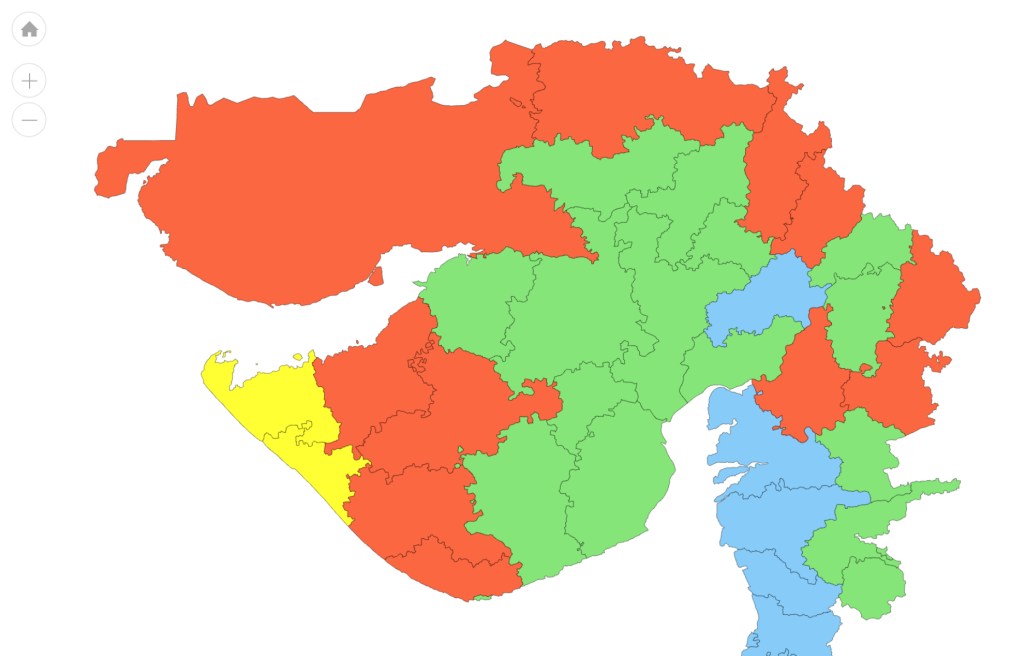
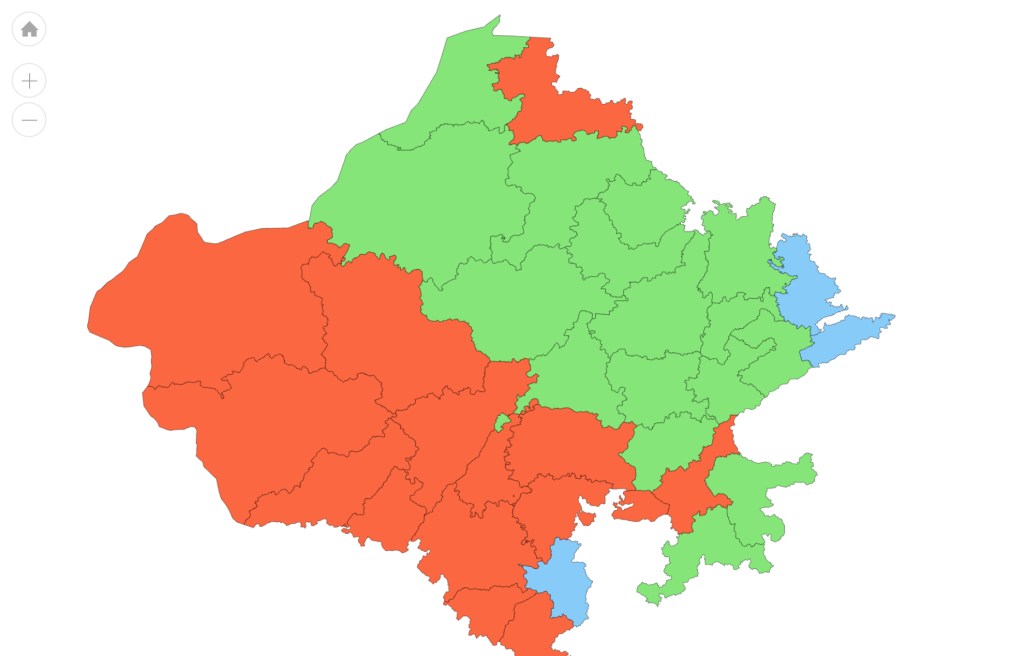
DISTRICT WISE STATE WISE RAINFALL The maps below are from IMD, showing in colour code the district wise rainfall situation for states and UTs during SW Monsoon 2026.
NORTH INDIA: Jammu & Kashmir
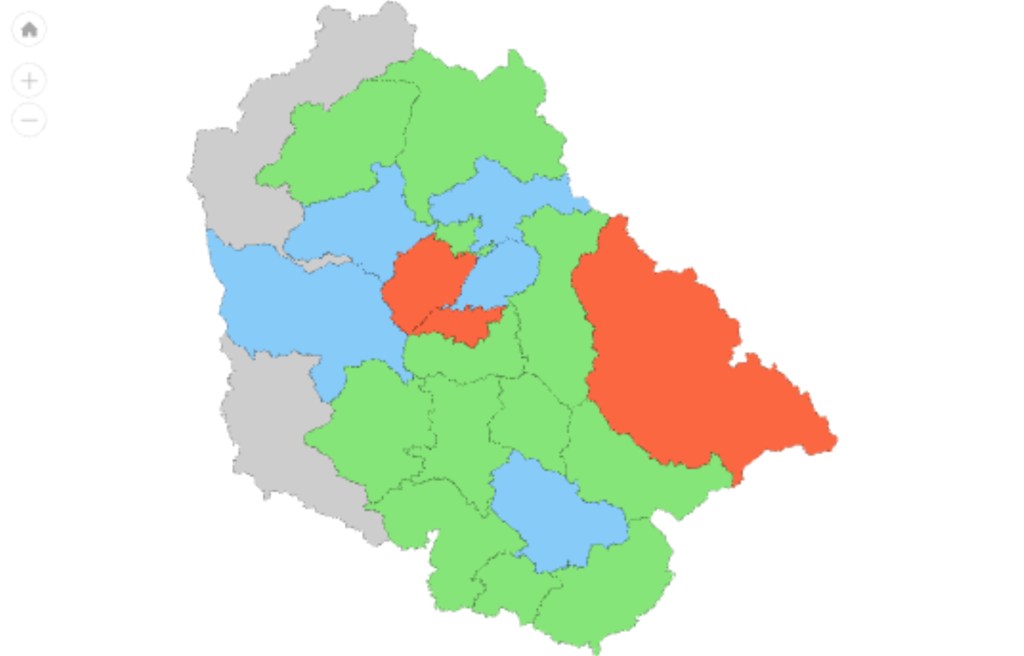
Ladakh
Himachal Pradesh
Uttarakhand
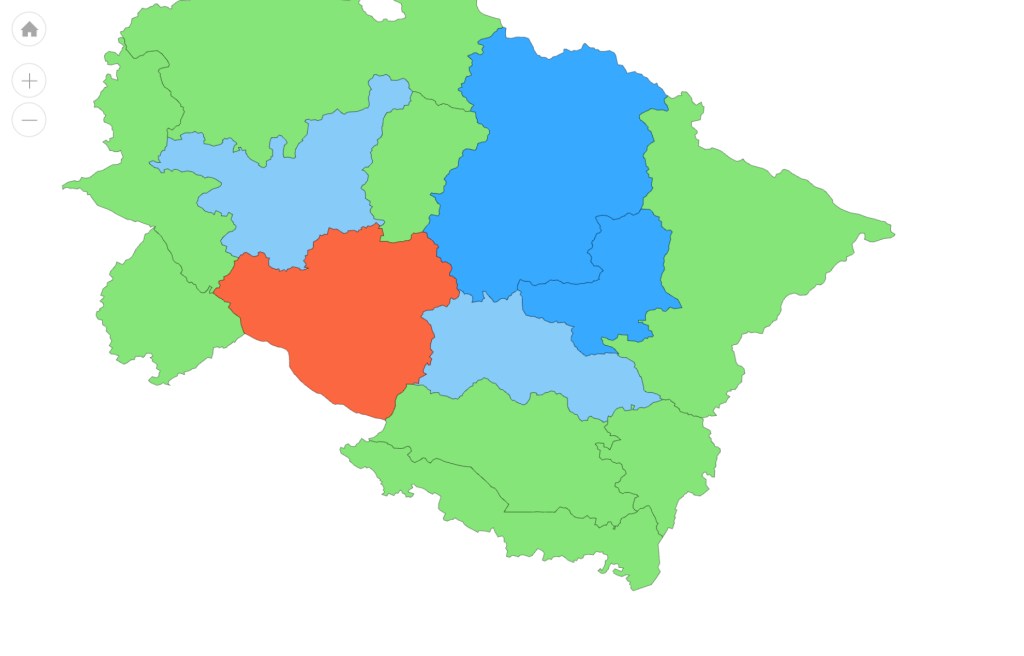
Punjab
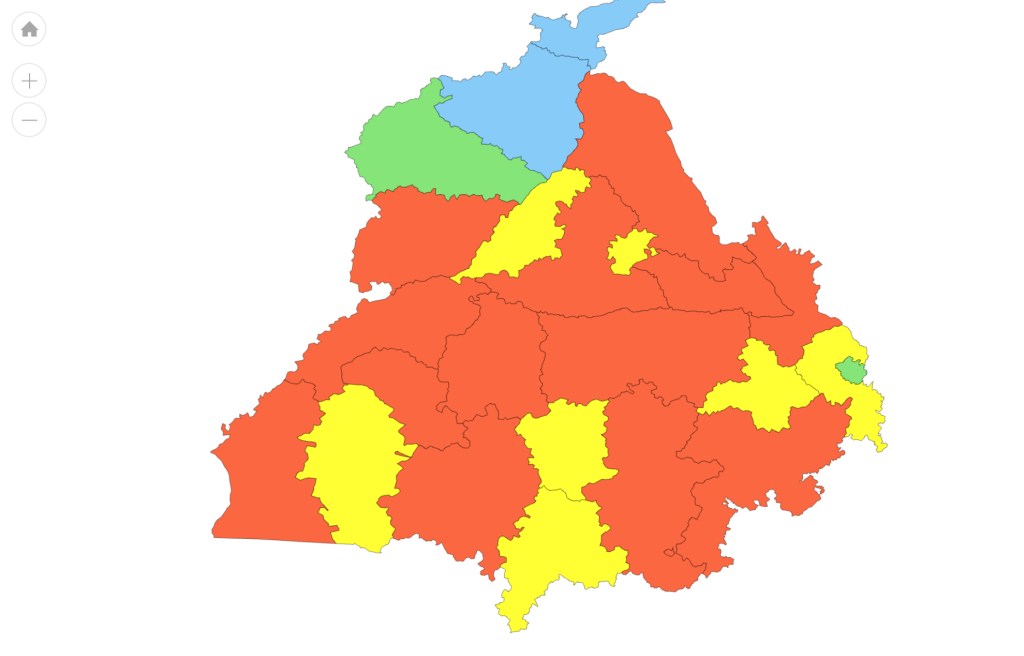
Haryana
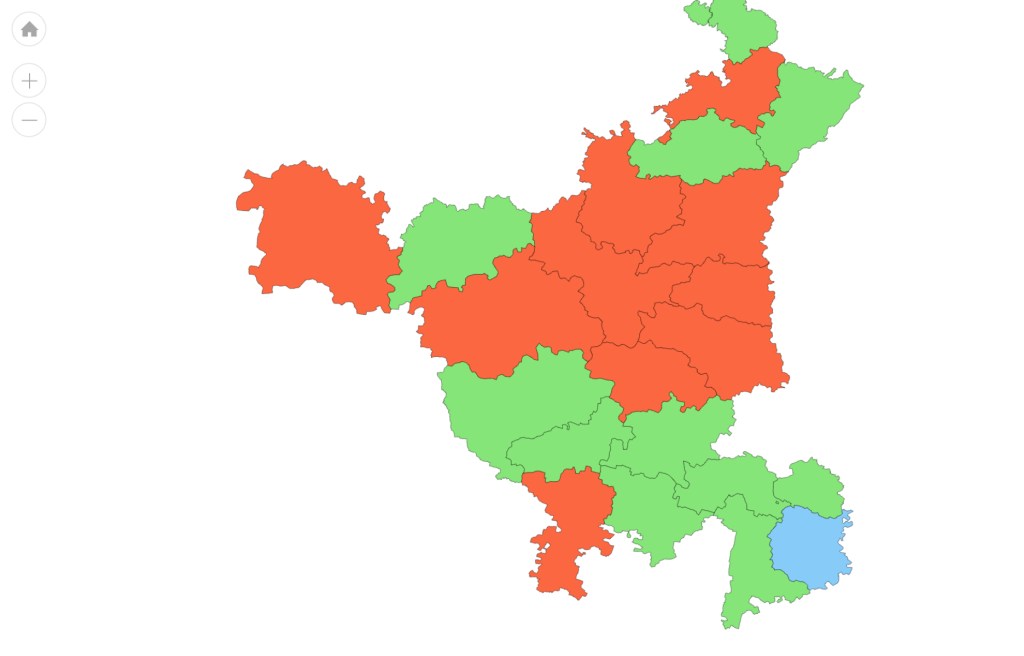
EAST INDIA: Uttar Pradesh
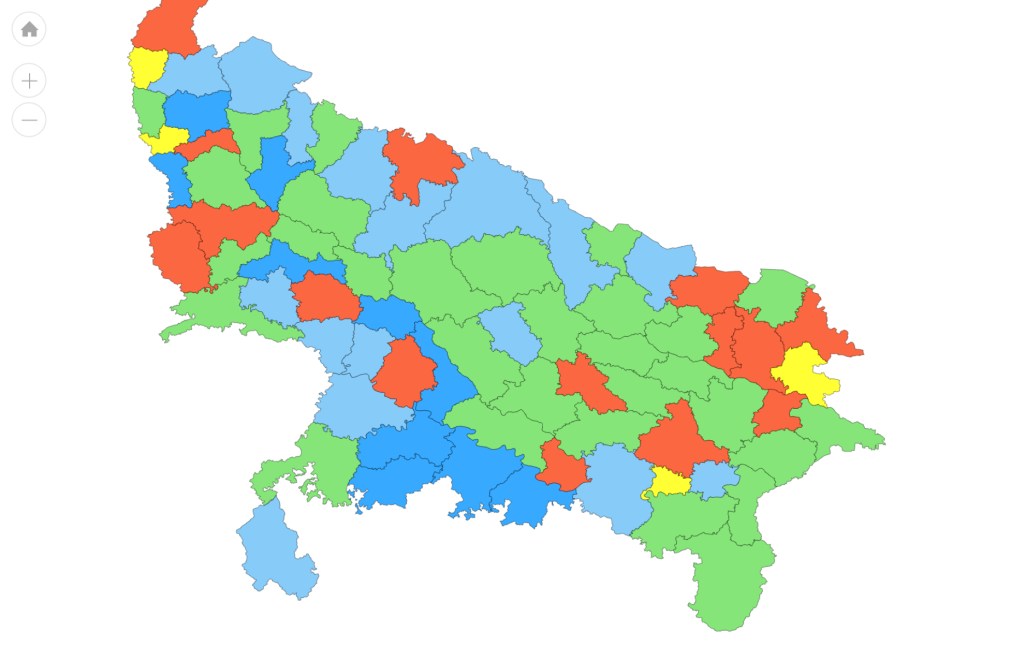
Bihar
W Bengal
Jharkhand
Odisha Odisha this year recorded its wettest monsoon in 20 years.
Chhattisgarh
NORTH EAST INDIA The East and Northeast region had its driest monsoon since records began in 1901.
Sikkim
Assam
Arunachal Pradesh
Meghalaya
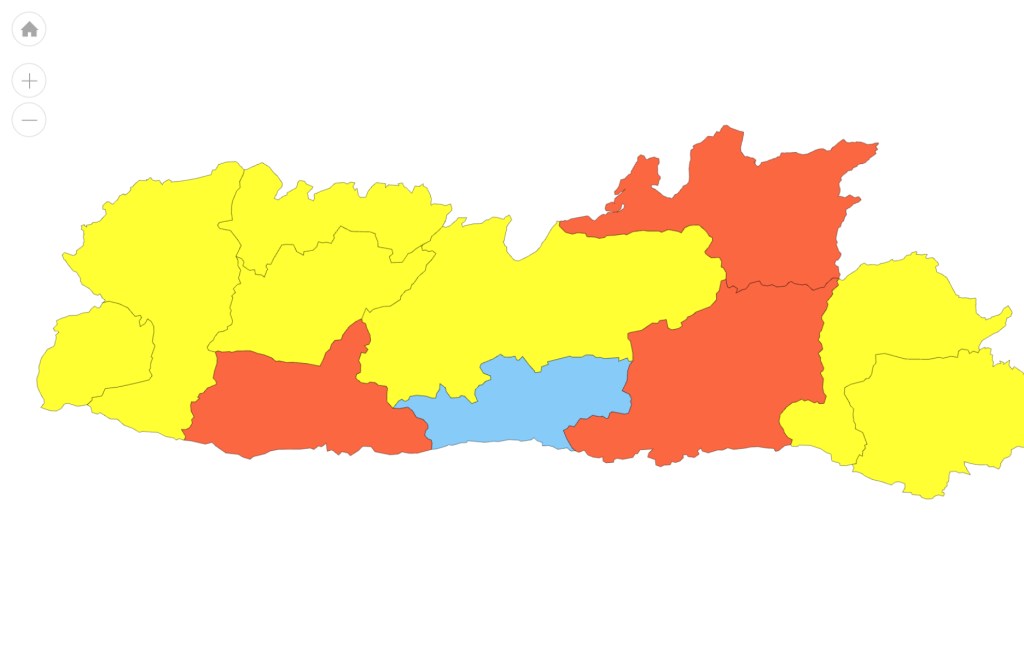
Meghalaya had the highest rainfall deficit throughout SW Monsoon 2026 Meghalaya is facing its highest-ever monsoon rainfall deficit in 2026 and 10 of 11 districts classified as deficient or largely deficient. This emerging drought-like situation threatens agriculture, water security, and spring-fed drinking supplies, compounding long-term trends of declining monsoon rainfall and climate stress.
A 30 year (1989-2018) analysis of monsoon rainfall data in Meghalaya by the IMD showed a significant decreasing trend in monsoon rainfall during the period.
Manipur
Mizoram
Nagaland
SOUTH INDIA South India recorded a rainfall deficit exceeding 23 per cent, making it the region’s driest southwest monsoon since 2002.
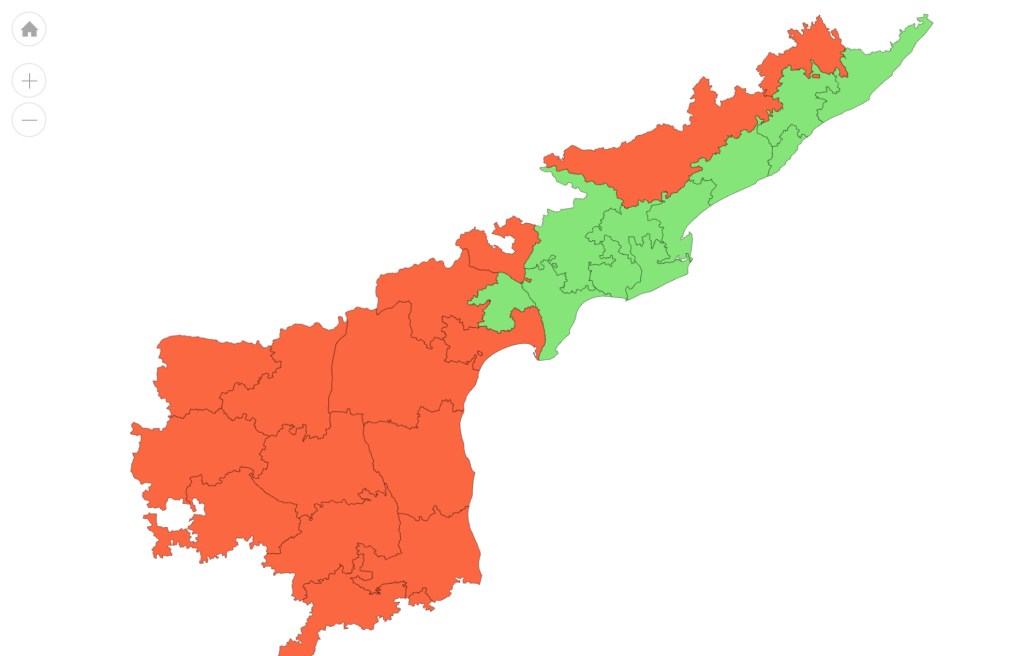
Andhra Pradesh
Telangana
Karnataka
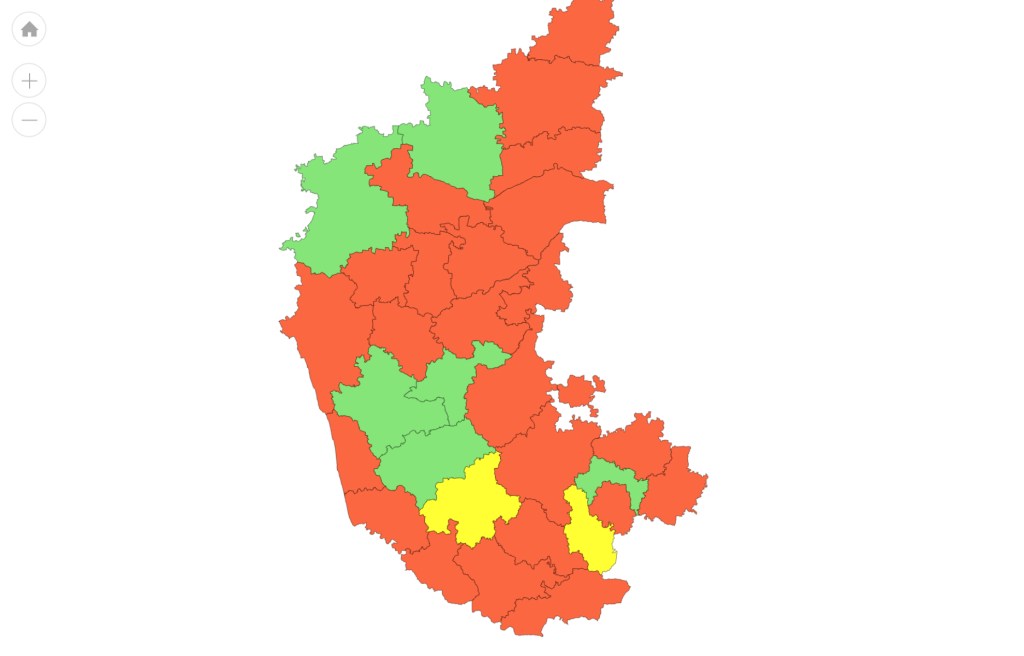
Karnataka stares at worst drought in 150 years Karnataka has recorded its worst southwest monsoon rainfall deficit in 55 years, with rainfall from June 1 to Sept 30 falling 35% below normal, according to data from Karnataka State Natural Disaster Monitoring Centre (KSNDMC). The deficit is the lowest recorded since 1971, surpassing the previous low of 33% in 2002.
The state received just 551 mm of rainfall against the normal 852 mm during the four-month monsoon season. While rainfall improved in July and August, September saw a sharp reversal, with the state recording a 54% deficit during the month. According to KSNDMC data, in June 2026, the state recorded -42% deficit rainfall, which improved to -29% in July. In Aug, due to further improvement in rainfall, the deficit fell to -23%.
North interior Karnataka is the worst affected with -42% deficit rainfall, followed by south interior Karnataka, which recorded -41% deficit rainfall. Malnad region, comprising the four districts of Kodagu, Shivamogga, Hassan, and Chikkamagaluru recorded -38% deficit rainfall. The coastal region recorded -28% deficit rainfall.
Of the 31 revenue districts, Mysuru was the worst affected, with a 59% deficit, followed by Vijayanagara at 57%. Only Bengaluru South recorded rainfall within the normal range, with a deficit of 18%. Against normal rainfall of 419 mm, Mysuru received just 172 mm.
Tamil Nadu
Kerala
WEST INDIA: Goa
Maharashtra
Madhya Pradesh
Gujarat
Rajasthan
SANDRP (ht.sandrp@gmail.com)
Relevant Links:
[i] https://sandrp.in/2022/10/01/sw-monsoon-2022-district-wise-rainfall-in-india/


