
Pune saw some of the warmest summer days and nights this summer. So did several Indian cities. With the recent monsoon, the thoughts of this heat might have washed away but it is important that one does not forget the summer heat. Why? Read More:
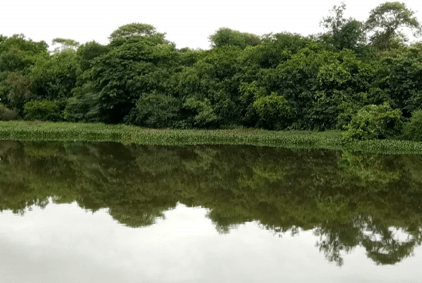
| Why run and hurry? Here’s dictionary: Microclimate: Microclimate generally refers to the specific climatic conditions within a small area (such as street, park, riverside, etc.). With rise in extreme events like heat and global warming, microclimate is what make cities/ spaces livable. The temperature difference you experience while driving on a road with no tree cover vs with a tree cover is what microclimate is. |
Just like the rivers have shaped up Pune’s culture and till date continues to do so, they also shape the city’s climate and to be honest every river does so for the area around. For instance, the recent heatwaves across Western European countries have created a havoc in cities. Temperatures peaked up to 10 degrees more than usual. Heatwaves have had a role in thousands of deaths here[1] . In such a sweltering situation, people were found taking refuge in the river and on her banks across cities in attempt to avoid impact of the heat wave.
Pune too experienced an exceptionally hot summer this year with temperature peaking to 42 degrees along with the warmest night in May in the last 12 years at least.[2] Along with the effects of an impending El Nino, scientists from the Indian Meteorological Department (IMD) linked the night-time temperature rise also to “Urban Heat Island Effect” (UHI) where the concretized areas hold on to heat and release it much slower than the natural areas[3]. The increase of land surface temperature caused by UHI influences material flow and energy flow in urban ecological systems, as well as alters their structure and functions, exerting a series of ecological and environmental effects on urban climates, hydrologic situations, soil properties, atmospheric environment, biological habits, material cycles, energy metabolism and residents’ health. [4] In short, UHI effect is a phenomenon when urban areas experience warmer temperatures due to green cover being replaced by grey cover i.e. concrete and such materials. Since these materials have high heat capturing capacity and low reflectivity, they capture the heat and slowly release it at night leading to higher temperature during the nights as well.
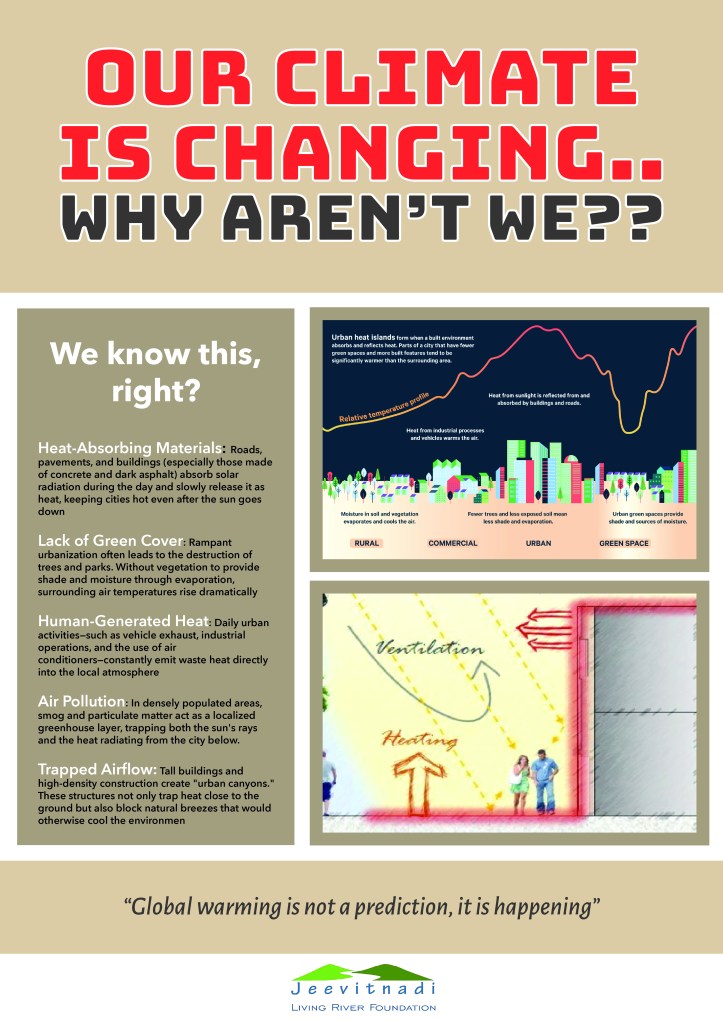
Pune has been experiencing this phenomenon for almost a decade now.[5] This year the heat has extended in the month of June. Now with recent rains, one might have felt relief and let go of the thought of heat and thoughts of the monsoon “chik chik”, wet clothes and water-logged roads might have made themselves home, but it is important that one does not forget the summer heat. Why?
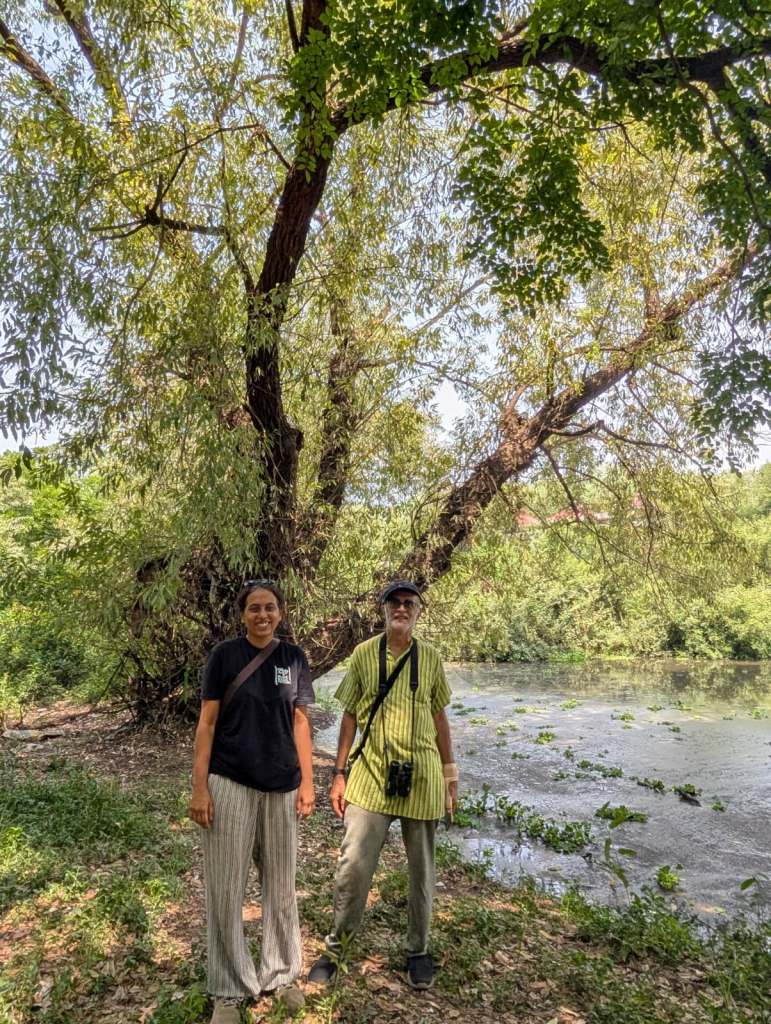
Ten citizens who volunteer with Jeevitnadi have the answer. Sneha Vineet, Amitraj Deshmukh, Ameya Kulkarni, Amol Kadam, Sanjeev Naik, Ashwini Bhilare, Nishaad Sevekari, Kalyan Mane, Shailja Deshpande and Shubha Kulkarni decided to take up a citizen science project. The idea was simple – to understand the temperature and humidity differences affecting Pune espceially around the river banks. They measured both air and surface temperatures which provided insights into how different surfaces absorb and release heat.
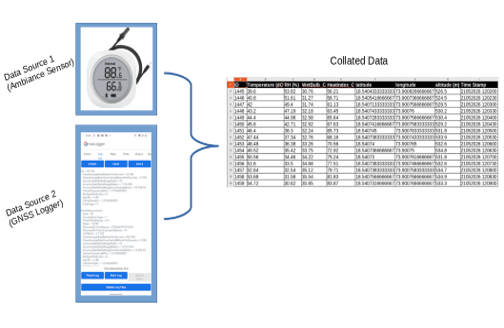
| Image 1: Data Collation from 2 different data sources P.C. Jeevitnadi Team |
For instance, on one of the days, during evening at Bund Garden, the air temperature was recorded to be 38 degrees Celsius whereas the surface temperature i.e. the concrete embankment surged up to 54 degrees Celsius. That is a difference of 16 degrees Celsius!
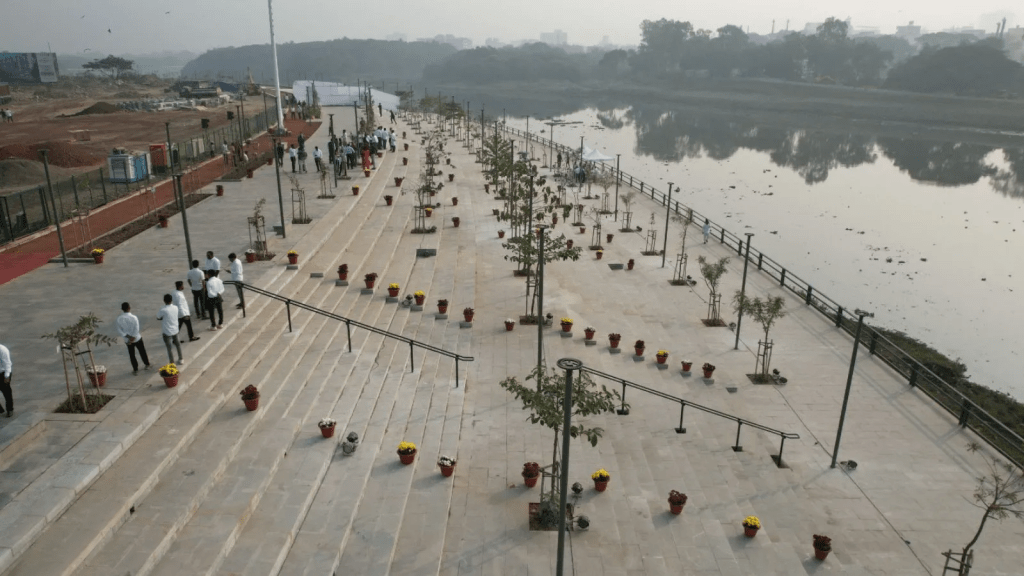
On the contrary, when the same data points were recorded at Ram Mula Confluence – a riparian forest in the evening, the air temperature was 28 degrees Celsius and the surface temperature was 32 degrees Celsius. This shows a stark difference of 22 degrees between a concrete embankment and a riparian forest! (Access the report here.)
| Bund Garden RFD (River Front Devp.) | Ram-Mula Confluence (Riparian Forest) | Temperature Difference | |
| Air Temperature | 38 | 28 | 10 |
| Surface Temperature | 54 | 32 | 22 |
The volunteers shared, “The RFD project areas showed higher Urban Heat Island effect, i.e. the ground-level surfaces often remained hotter than the surrounding air, indicating concrete surfaces retain heat and cool more slowly.”
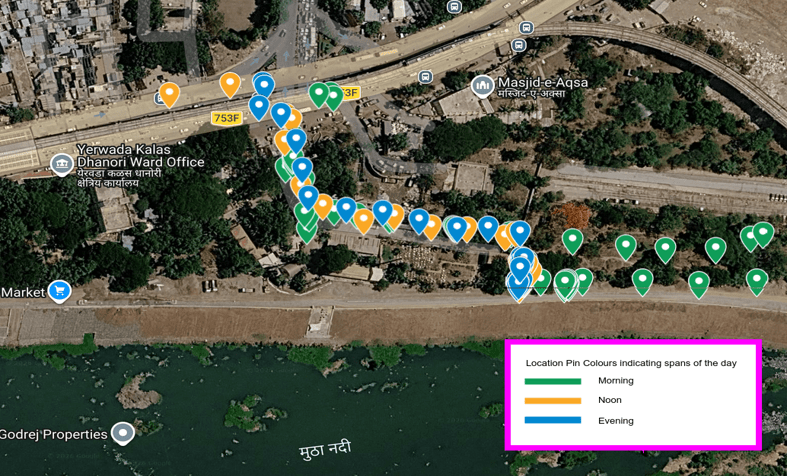
| Image 2: Colour codes indicating Geolocation mapping at different times of the day at the same location P.C. Jeevitnadi Team |
This study indeed proves the importance of riparian zones with current climate crises. But what is it that these riparian zones exactly do that creates such stark difference between the temperatures?
| From the ground “While this experiment did not contain a lot of data points, and we had estimated the results, the numbers were perplexing. The impact of concretisation is quite evident. This study is a good indicator that we are moving in the right direction and we plan to introduce more data points and strengthen the entire process. We invite the citizens of Pune to join us for this citizen science experiment. Wider the data, more the strength and validity of it will hold up. In fact, we want this to reach widespread and simplify the “technical” terms and make this experiment a tangible expression of what each and all of us Punekars experience. Afterall each and all of us want to park in a tree’s shade”. Ameya Kulkarni, Volunteer, Jeevitnadi |
Riparian ecosystems, the green buffer areas between the river and the land, serves as a river’s thermal shield, regulating aquatic micro-climates primarily by intercepting up to 95% of summer solar radiation through dense native canopies (Naiman & Décamps, 1997).[6] When this crucial green buffer is stripped away by fragmentation, rivers experience thermal shock. Un-buffered stream reaches or riverbanks can spike over short distances, whereas intact, shaded riparian zones keep water temperatures cooler during peak summer heatwaves (Bowler et al., 2012[7]).

This temperature regulation also directly dictates the river’s metabolic health and function. For example, studies show that a shaded, resilient stream holding steady at 15°C can retain a dissolved oxygen saturation capacity of 10.08 mg/L. Conversely, an exposed, un-buffered reach that warms to 25°C and its DO drops to 8.26 mg/L (USGS, 2026[8]). In India, our temperature baseline is much higher than this. And yet, our riverine biodiversity is linked with dissolved oxygen which is dependent on the temperature.
The Pune Riverfront Development Project has cut over a thousand riparian trees in Pune till now, while pouring concrete on the moist and fertile riparian soils. Citizens are strongly opposing plans to destroy any more riparian areas. No wonder then that the highest temperatures were recorded by the volunteers on riverbanks which are concretized and whose riparian areas had been destroyed by the RFD Project.
As per the initial observation of the Jeevitnadi Volunteers, apart from making rivers more likely to flood and destroying the habitats of birds and fish, the RFD is significantly adding to the rise in temperatures, severely affecting the river and the quality of life of lakhs of Punekars.
We hope the study continues to grow stronger and more robust and can help in protecting the “green infrastructure” that makes Pune a livable city.
Tara Tanmayi S, SANDRP
Note from Jeevit Nadi Volunteers who conducted the Project
– Sneha Vineet, Amit Deshmukh, Ameya Kulkarni, Amol Kadam, Sanjeev Naik, Ashwini Bhilare, Nishaad Sevekari, Kalyan Mane, Shailja Deshpande and Shubha
Background:
Community science has been the spirit of many explorations. As old as it can be, this special way brings all the newness to work at hand. Community science is a scientific, logical progression that may not start with accurate output, but makes sure to have a scientific temper, logical methodology and verifiability, for the reason that it makes and expects a community to keep questioning, learning while doing.
The ongoing project of recording the ambiance of rivers around Pune and Pimpri Chinchwad area, is into its first phase as of June 2026. Started in the month of May 2026, before the monsoon was expected, this project brings the community together to realise yet another observatory that will record and analyse the environment around the rivers – Ram, Mula, Mutha and Mula-Mutha.
To start with, in the month of May 2026, a team of volunteers roamed around 4 designated locations and recorded Temperature and Relative Humidity.
What was the study about:
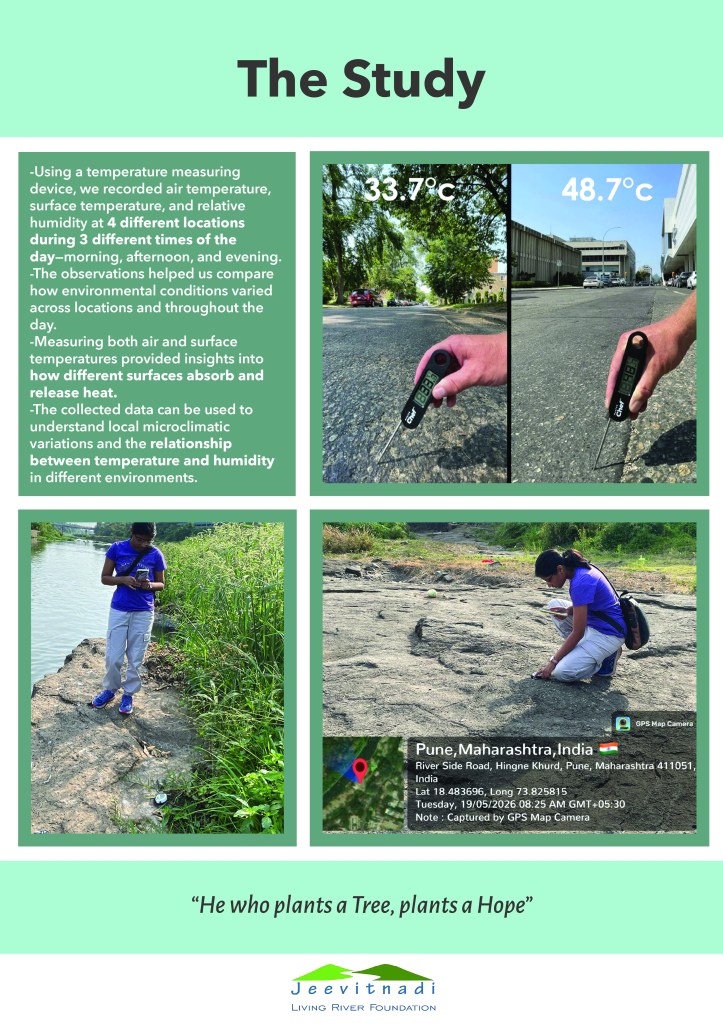
Understand the temperature and humidity differences across 4 different locations around river banks , during 3 time spans in Pune city. The observations helped us compare how environmental conditions varied across locations and throughout the day.
We measured both air and surface temperatures which provided insights into how different surfaces absorb and release heat.
What is the use of this data?
Data can be used to understand the microclimatic variations and relationship between temperature and humidity in different environments.
The overall spirit was to use tools and devices that are publicly accessible to the extent possible. As the project progresses, in order to be true to the idea of community science, tools will be increasingly open source.
Methodology:
The methodology involved using a popular, relatively stable sensor device: TH1 Pro by inkbird. and a separate GNSS Logger application, simultaneously.
There are two data sources:
- Ambience Sensor Device
- Geolocation Recorder Device
1) Hygrometer Thermometer IBS-TH1 Plus (aka “IBS-TH1” in this document) by Inkbird measures Ambiance Temperature and Relative Humidity values (aka addressed as Ambiance Values in this document) in the vicinity it has been placed in.
2) Provides Ambiance Values over a Bluetooth connection. The Temperature Value is provided in degree Celsius or Fahrenheit. Relative Humidity is made available in Percentage. Recording Time stamp is the third parameter that is made available by this device.
3) IBS-TH1 does not record the geolocation coordinates it is at (aka GNSS values in this document). To address this limitation a phone application “GnssLogger App” was used.
4) Hence, for a given geolocation where data is being captured, measuring the ambiance means using both the data sources simultaneously – keeping the Ambiance Sensor Device and GNSS Logger Application ON, in parallel.
5) GNSS Logger and IBS-TH1 are technically unaware of each other. Hence, they produce different files (in different formats). An open source script written in Python programming language, generates collated data using these files.
6) Collated Data also includes calculated values of Heat Index for the given Ambience Data and Wet Bulb Temperature.
- For Heat Index calculations, the NOAA Rothfusz regression has been used with the simple adjustment for lower temps.
- The Wet Bulb Temperature for given Ambience Data has been calculated via psychrometric equation solved numerically (Newton–Raphson).
- We used https://www.wpc.ncep.noaa.gov/html/heatindex.shtml and https://people.tamu.edu/~i-choudhury/psych.html to verify if the algorithmic calculations of this project were in close vicinity of these third party tools or not. Random checks depict that values in project data and values from the listed sources above are close to each other.
Data was collected from 4 locations, 3 times of the day and from the ground level and in the air to compare temperature variances.
Locations visited:
- Vitthalwadi stretch on Mutha river
- Ram Mula confluence in Aundh
- Joggers park in Bund garden area
- Sangameshwar temple in Pimple Gurav
Analysis :
Mornings: The temperature and humidity remained similar with only minor variations between shaded and exposed areas. Temperature range – 28 – 32 degrees
Afternoons: Observed the largest variance in temperature. Exposed surfaces like bridges, roads and rocky patches recorded higher temperatures sometimes exceeding 50 degrees.
By evening the temperatures gradually decreased, though few locations that were exposed continued to retain more heat.
Key findings:
Anomaly : On one of the days, the evening data showed an extreme micro climate anomaly where the heat index surged to 54 degrees!
Hot exposed surfaces tend to have higher temperatures and lower humidity, creating drier conditions.
Surface temperatures on exposed areas often exceeded 50 degrees even when air temperatures were around 35-40 degrees
Locations where development on the river bank has happened, definitely showed peaks in extreme temperature.
While exposed surfaces felt hot, river and shaded areas around it were cooler.
Shortcomings:
At the moment this work is in the initial phases of “data collection and analysis”. The sensor device (data source 1) and the Data Logger application (data source 2) are at best consistent. They are not accurate devices and have not been calibrated in a certified laboratory, before data recording.
The work follows a sincere, consistent scientific temper. Across days, various readings have been recorded in similar time or overlapping time frames if not exact. Similarly, all the geo-locations, except 1 place, have been recorded thrice a day:
- Morning
- Afternoon
- Evening
For example, the following image shows data recorded on May 21, 2026 at Bundgarden area Pune, during 3 different time spans of the day.
As the project goes ahead, it will spread over at least a year, recording and analysing data at various locations, during different seasons and with different climate conditions. As this is a community project, we strive for the methodology and tools to improve towards accuracy, while they are already exhibiting consistent, stable behavior in a defined error domain.
What began as a routine data collection, gradually became more meaningful as an understanding of the temperature difference and how it varied across different locations by the river.
This project increased awareness of rivers and its relationship with urban spaces and local environmental conditions and encouraged us to look more closely at conservation efforts.

[1] https://www.newscientist.com/article/2532825-june-heatwave-may-have-killed-around-20000-people-in-europe/, https://www.bbc.com/news/articles/c3ry307rxqro
[2] https://timesofindia.indiatimes.com/city/pune/pune-logs-warmest-may-nights-in-at-least-12-years/articleshow/131449525.cms#:~:text=Daytime%20temperatures%20were%20elevated%20too,risks%20posed%20by%20warmer%20nights.
[3] https://timesofindia.indiatimes.com/city/pune/imd-issues-heatwave-alert-for-maharashtra-hot-days-sultry-nights-grip-pune/articleshow/131049045.cms#:~:text=Extensive%20built-up%20surfaces%20around,°C%2C%20IMD%20data%20showed.
[4] [4] https://www.sciencedirect.com/science/article/pii/S1877705816332039
[5] https://timesofindia.indiatimes.com/city/pune/newly-developed-areas-in-pune-experiencing-heat-island-effect/articleshow/58617760.cms
[6] Naiman, R. J., & Décamps, H. (1997). The ecology of interfaces: riparian zones. Annual Review of Ecology and Systematics, 28(1), 621-658.
[7] Bowler, D. E., Mant, R., Orr, H., Hannah, D. M., & Pullin, A. S. (2012). What are the effects of riparian management on aquatic communities? Environmental Evidence, 1(1), 8.
[8] U.S. Geological Survey (USGS). (2026). DOTABLES: Dissolved Oxygen Solubility Tables. Using standard multi-variant solubility equations for fresh water.


