In last six years, from 2016-17 to 2021-22, India’s Large Hydropower projects (projects above 25 MW installed capacity) have contributed just around 10% of the total power generation, going as low as 9.68% in 2017-18. In fact, in three of these six years, large hydro contributed less than 10% and recovering only marginally in the rest, thanks to surplus monsoon.
Continue reading “INDIA’S HYDRO GENERATION CONTRIBUTION AROUND 10% for SIX YEARS”Tag: Hydropower Performance
India’s hydro generation AGAIN below 10% in 2018-19
In 2018-19, for the third year in succession, power generation from India’s large hydropower projects was below 10% of total electricity generation in India. In 2016-17, for the first time in independent India’s history, power generation from large hydropower projects in India fell below 10% of total electricity generation. This calculation is based on actual generation (measured as Million or Billion Units[i]) and not installed capacity (measured in Mega Watts). Continue reading “India’s hydro generation AGAIN below 10% in 2018-19”

Diminishing Returns from Large Hydropower projects: Opportunity for a pause
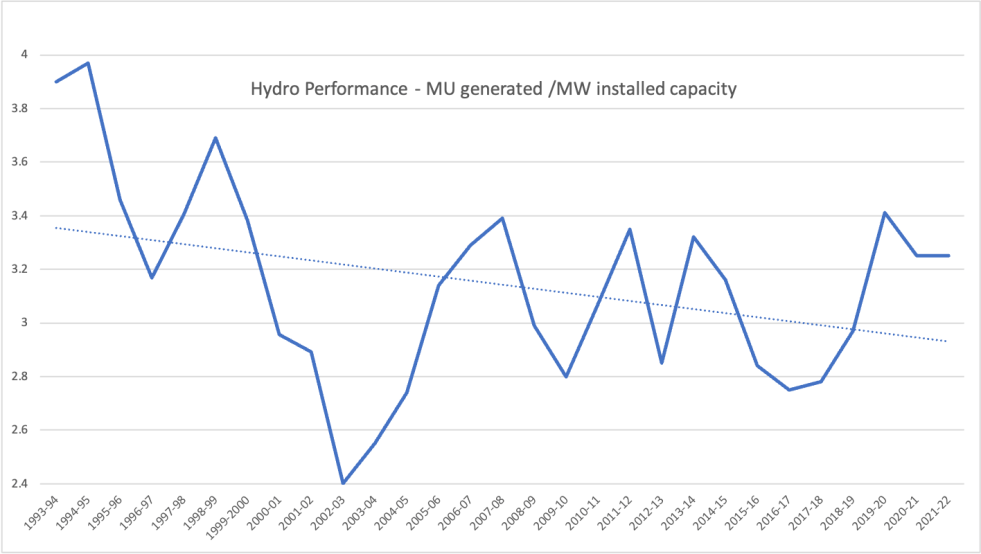
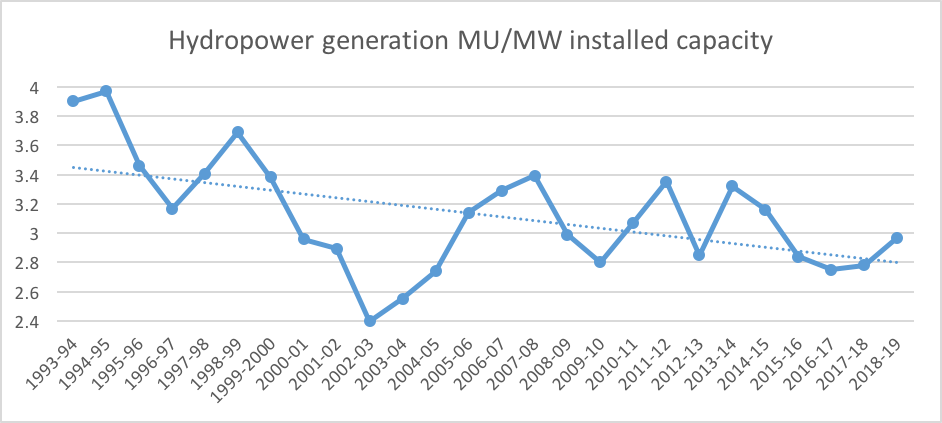
As per the latest power generation figures released by the Central Electricity Authority,[1] the hydropower generation during the current Financial Year 2016-17 is likely to be lower than the previous year’s generation even though the installed capacity has gone up. Average generation per MW of hydro capacity in India in 2016-17 is likely to be about 30% less power than what our average generation was in 1994-95. More worryingly, the hydropower generated per MW installed capacity continues its downward slide, the downward slide has been going on for now over two decades. Continue reading “Diminishing Returns from Large Hydropower projects: Opportunity for a pause”

Insider view: BBMB is inefficient, slow, heavy, bureaucratic; Does not work to preserve its massive resources
Bhakra Beas Management Board (BBMB, http://bbmb.gov.in/english/index.asp) is the manager of India’s celebrated icons: Temples of Modern India as our first Prime Minister called it. In a rare occasion, when we get a candid account of insider’s view of this organisation, it is worth taking note of it.
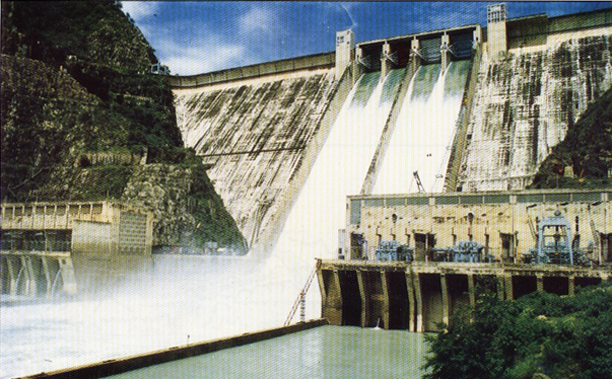
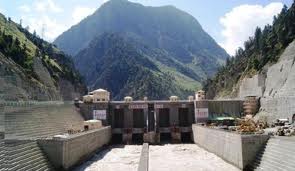
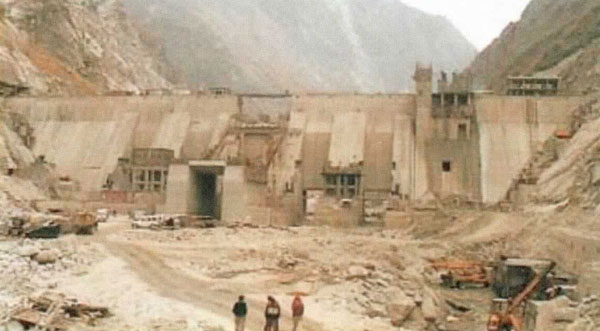
Bhakhra Dam: Photo from BBMB
BBMB, created on Oct 1, 1967, has current annual budget of massive Rs 1000 crores and manages the Bhakra Nangal Project, the Beas Project I (Pandoh dam, the Beas Sutlej Link and the Dehar Power House) and the Beas Project II (Beas Dam and Pong power houses). With close to 3000 MW of installed capacity it generates about 12.5 billion units of power annually.
Mr Satish Loomba, who served as Financial Advisor to BBMB between 1996 and 2001 has just provided an interesting view about the functioning of BBMB in his article Need to corporatise BBMB in The Tribune of January 23, 2014: http://www.tribuneindia.com/2014/20140123/edit.htm#6. While the author, as the title suggests, is advocating a corporate restructuring of BBMB, what he has said in the process provides a valuable insights from an insider. Here are some snippets:
Þ “This organisation, which has become heavy, slow and bureaucratic…”
Þ “However, despite a façade of running smoothly, the BBMB, from the organizational standpoint, suffers from several infirmities, limitations and internal contradictions.”
Þ “At the core of the inadequacies in the BBMB are the… systems which do not promote efficiency, cost control and long term health of its vast assets… It has no concern with the value of its output…”
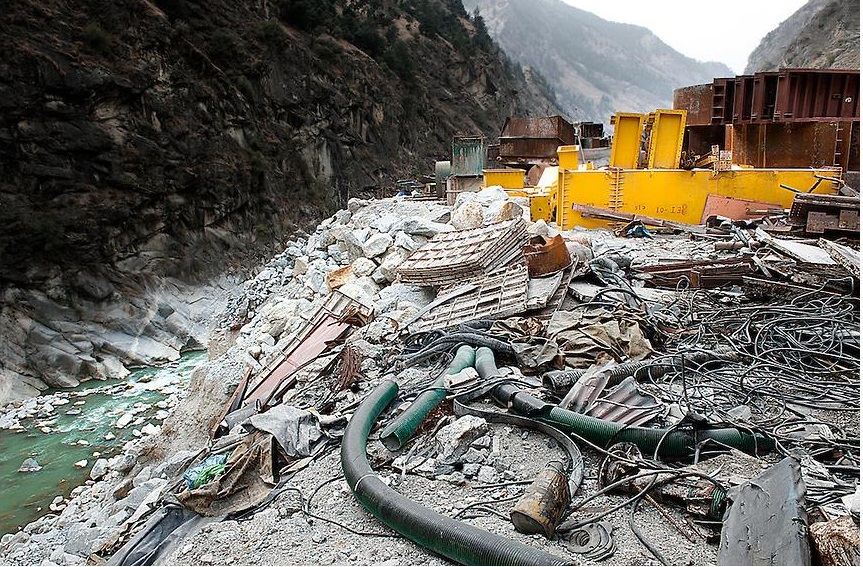
Þ “… capital of the BBMB is not being preserved in accordance with accepted principles…” In fact in recent years, the illegal dumping of humungous quantities of muck (even a 100 MW project creates several million meter cube of muck) by the numerous major, medium and small hydropower projects in upstream Sutlej (see: https://sandrp.in/basin_maps/Hydro_Electric_Projects_on_Sutlej_River_in%20HP.pdf) and Beas (see: https://sandrp.in/basin_maps/Hydropower_Projects_in_Beas_Basin.pdf) basins is leading to accelerated silting up of the Bhakra, Pong and Pandoh reservoirs, but no one, not even BBMB has shown the slightest concern.
Þ “For the ageing irrigation wing assets, which are colossal and could be in sudden need of massive recapitalization…”
Þ “… there is no account which summarises its results for a specific time period…”
This is a very serious indictment, not only of BBMB but also the way the “icons” of India are being managed by an organisation controlled by the Union Ministry of Power. Are these remediable infirmities or are these the implications of the kind and size of structures that BBMB manages? The author of the above article does not even pose this question, but is a very relevant one.
Declining Hydropower generation As per our analysis of hydropower generation from the three BBMB projects in Himachal Pradesh, namely Bhakra (1325 MW), Dehar (990 MW) and Pong (396 MW), with total installed capacity of 2711 MW, the generation per MW installed capacity has shown hugely declining trend with trend line declining by 18-20% in less than three decades. We also have graphs of individual BBMB hydropower projects that show similar trend line. This is a massive decline and in any responsible governance, questions would be asked as to why this is happening, but here, there are no questions.

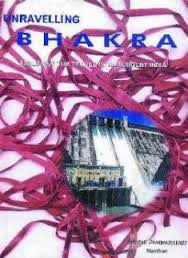
Unravelling Bhakra In a comprehensive critique Unravelling Bhakra, (see: http://www.manthan-india.org/spip.php?rubrique1, available in both English and Hindi), author Shripad Dharmadhikary has shown that it is a myth to assume that Bhakra dams were the only or major reasons behind India’s food security, green revolution or irrigation in North West India. He has shown with facts and figures that are yet to be proven wrong that the contribution of Bhakra dams was limited.
Displaced people still awaiting justice Over five decades after commissioning of the Bhakra project, the people displaced by this most celebrated of Indian dams are still awaiting justice, as is clear from this latest news report (http://www.tribuneindia.com/2014/20140120/haryana.htm#10) in January 2014. This has been highlighted by many in the past including Govt of India’s Water Resources Minister in his autobiography, by SANDRP in 2002, by Shripad Dharmadhikary in above mentioned book and continuous media coverage. This also shows the callous attitude of BBMB and concerned state and central governments.
Ad hoc, callous reservoir operation It is no secret that even this irrigation system is in bad and declining health. This is due to many reasons, including due to lack of maintenance and participatory governance. Several times it has been pointed out how unaccountable and inefficient has been the operation of the Bhakra reservoirs. Two recent occasions when SANDRP pointed this out include the following:
Þ July 2012: Precarious situation of Bhakra dams: BBMB says emergency measures are imminent: Callous, ad-hoc reservoir operation again? Could this situation have been avoided? https://sandrp.in/dams/PR_Why_precarious_water_situation_at_Bhakra_dams_was_avoidable_July_2012.pdf
Þ Sept 2010: Bhakra reservoir is being operated in casual, adhoc manner? Need for clearly defined norms of accountability in reservoir operations https://sandrp.in/dams/Bhakra_and_Need_for_accountability_in_Reservoir_Operations_Sept_19_2010.pdf
Þ With general elections approaching in coming April May 2014, we have to wait and see if the Bhakra reservoirs will again be operated in an ad hoc manner like it happened before previous two national elections.
We hope right lessons will be learnt from this insider’s view of the alarmingly inadequate functioning of the BBMB and efforts will be made to make its functioning more participatory, transparent and accountable.
Himanshu Thakkar (ht.sandrp@gmail.com)
Hydropower Generation Performance in Sutlej River Basin
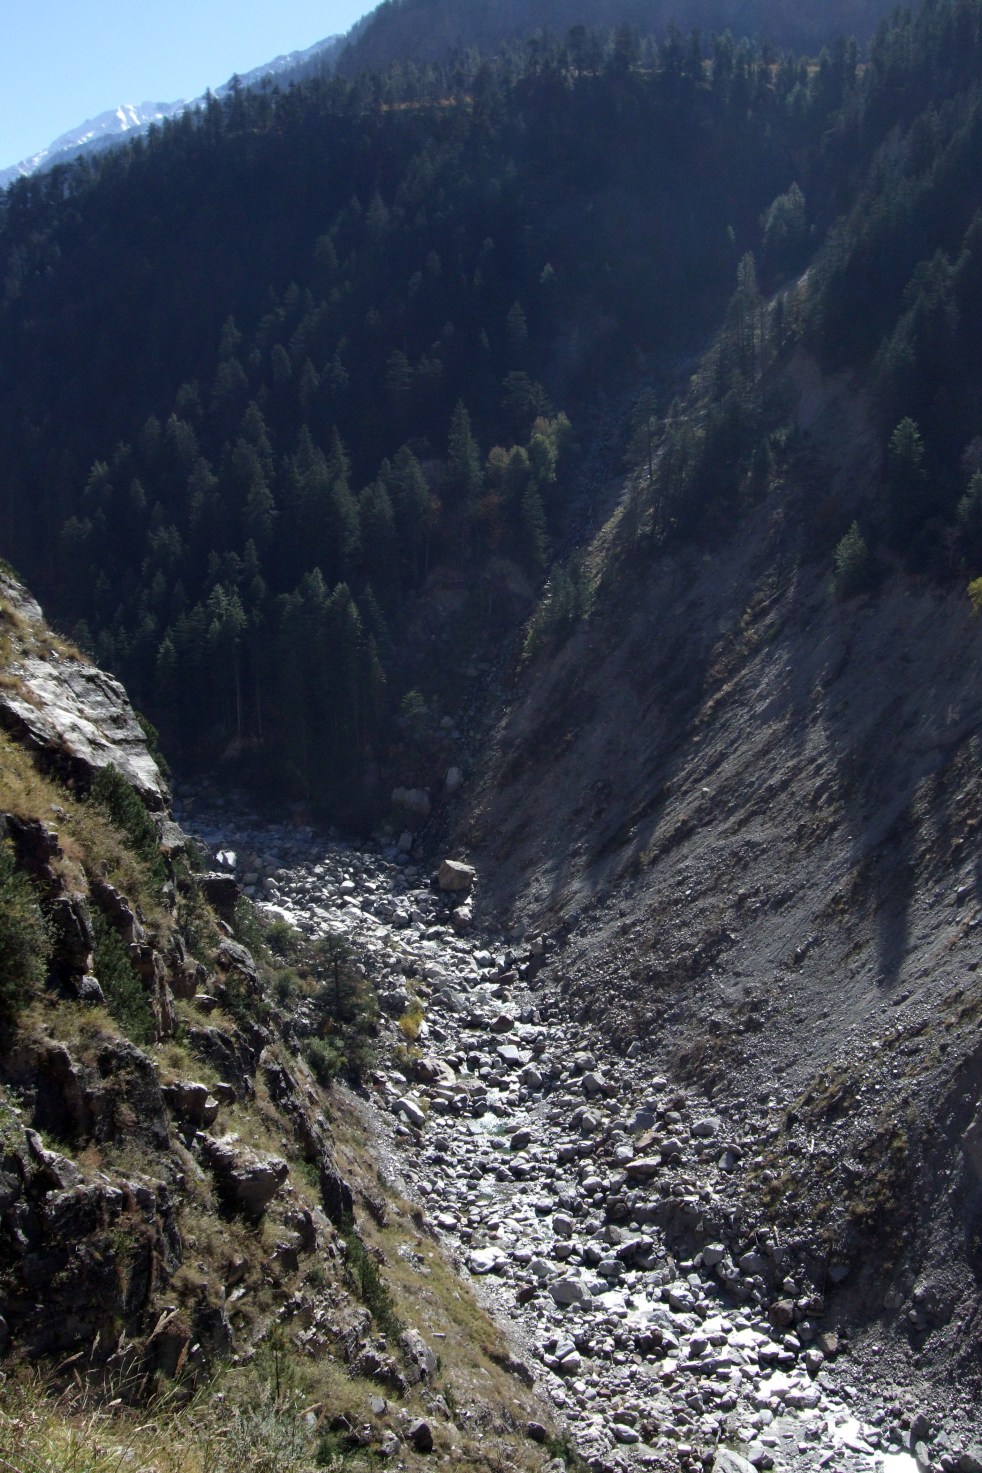
The Sutlej River Basin is the major part of Indus River Basin. It is the easternmost tributary of the Indus River. It rises near the Darma Pass near Mansarovar Lake, enters the Zarkar range and flows through Tibet before entering India. It cuts through the Great Himalayan range and the outer Himalayas and enters the plains at Roper. It receives the Beas River at Harike at Punjab and forms the boundary between India and Pakistan for nearly 120 km. It finally enters Pakistan near Sulemanki.
The project wise generation data of large hydro (above 25 MW) with installed capacity of the basin in the latest year 2012-13 is follows.
| SN | Projects |
State |
Inst Capacity (MW) |
Generation (MU) |
MU/MW |
| 1 | Sanjay Bhabha |
Himachal Pradesh |
120 |
365 |
3.04 |
| 2 | Baspa-II |
Himachal Pradesh |
300 |
1240 |
4.13 |
| 3 | Nathpa Jhakri |
Himachal Pradesh |
1500 |
6778 |
4.52 |
| 4 | Bhakra |
Himachal Pradesh |
1325 |
4707 |
3.55 |
| 5 | Ganguwal |
Punjab |
77.65 |
593 |
7.64 |
| 6 | Kotla |
Punjab |
77.65 |
600 |
7.73 |
| 7 | AP Sahib |
Punjab |
134 |
639 |
4.77 |
| 8 | Karchham Wangtoo* |
Himachal Pradesh |
1000 |
4057 |
4.6 |
| Total |
— |
4534.3 |
18979 |
4.19 |
* The Generation figure of Karchham Wangtoo is available for one year only as it commissioned in the year 2011.
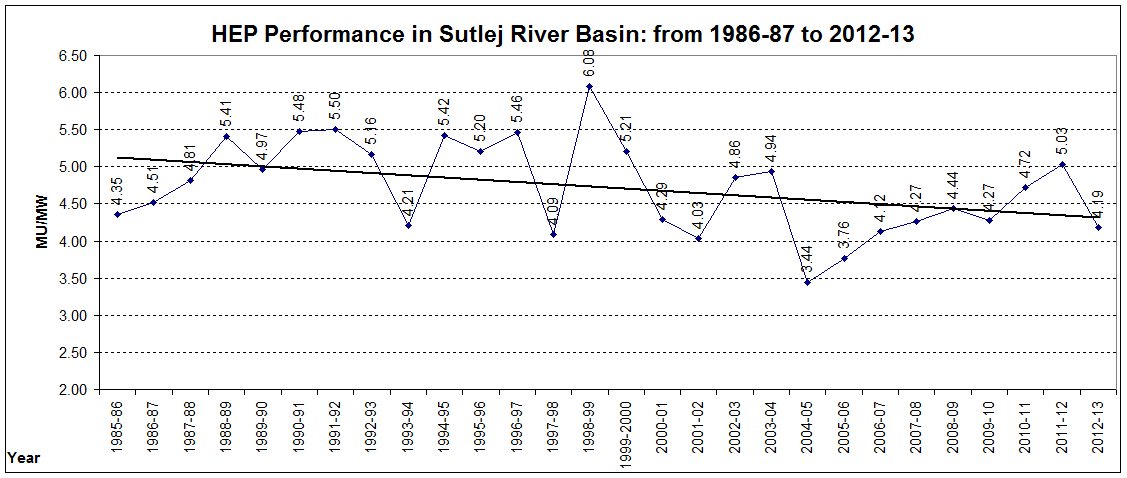
- The above graph shows the trend line of power generation of large Hydropower projects for last 28 years in the Sutlej basin. The trend-line shows diminishing generation from existing hydro power projects of Sutlej River Basin.
- It shows that the per MW generation in 2012-13 (4.19) has dropped by a huge 31.09% from the highest per MW generation (6.08) achieved in the year 1998-99.
- All generation figures have been taken from official data of Central Electricity Authority (CEA).
List of other projects (up to 25 MW) under operation (for which latest generation figures not available):
| SN | Project |
Ins Cap (MW) |
State |
| 1 | Rukti |
1.50 |
Himachal Pradesh |
| 2 | Chaba |
1.75 |
Himachal Pradesh |
| 3 | Rongtong |
2.00 |
Himachal Pradesh |
| 4 | Nogli |
2.50 |
Himachal Pradesh |
| 5 | Titang |
0.90 |
Himachal Pradesh |
| 6 | Lingti |
0.40 |
Himachal Pradesh |
| 11 | Ghanvi |
22.50 |
Himachal Pradesh |
|
Total |
31.55 |
Source: http://www.hpseb.com/hydro_potential.htm
List of proposed and under construction projects in the basin:
| Project |
Ins Cap (MW) |
State |
Status |
|
| 1 | Kol Dam |
800 |
Himachal Pradesh | Under Construction |
| 2 | Rampur |
412 |
Himachal Pradesh | Under Construction |
| 3 | Kashang-I |
165 |
Himachal Pradesh | Under Construction |
| 4 | Kasang-IV |
48 |
Himachal Pradesh | Under Construction |
| 5 | Shorang |
100 |
Himachal Pradesh | Under Construction |
| 6 | Raura |
8 |
Himachal Pradesh | Under Construction |
| 7 | Ghanvi-II |
10 |
Himachal Pradesh | Under Construction |
| 8 | Bhaba Aug.PH |
4.5 |
Himachal Pradesh | Under Construction |
| 9 | Chango-Yangthang HEP |
180 |
Himachal Pradesh | EAC TOR Approved |
| 10 | Lara Sumta |
104 |
Himachal Pradesh | EAC TOR Approved |
| 11 | Luhri HEP |
775 |
Himachal Pradesh | EAC & FAC Recommended |
| 12 | Shongtong-Karcham HEP |
402 |
Himachal Pradesh | EAC& FAC Recommended, (Under stay order of HC) |
| 13 | Sumta Kathang |
130 |
Himachal Pradesh | EAC TOR Approved |
| 14 | Tidong -I |
100 |
Himachal Pradesh | EAC Recommended |
| 15 | Tidong -II |
60 |
Himachal Pradesh | EAC Under consideration |
| 16 | Yangthang – Khab HEP |
261 |
Himachal Pradesh | EAC TOR Approved |
| 17 | Kashang -Stage II & III HEP |
130 |
Himachal Pradesh | FAC Recommended |
| 18 | Jangi Thopan |
480 |
Himachal Pradesh | Proposed |
| 19 | Khab-I |
450 |
Himachal Pradesh | Proposed |
| 20 | Khab-II |
186 |
Himachal Pradesh | Proposed |
| 21 | Kuling Lara |
40 |
Himachal Pradesh | Proposed |
| 22 | Kut |
24 |
Himachal Pradesh | Proposed |
| 23 | Mane Nadang |
70 |
Himachal Pradesh | Proposed |
| 24 | Poo Spiloo |
300 |
Himachal Pradesh | Proposed |
| 25 | Ropa |
60 |
Himachal Pradesh | Proposed |
| 26 | Thopan Powari |
480 |
Himachal Pradesh | Proposed |
| 27 | Bahairari |
5.5 |
Himachal Pradesh | Proposed |
| 28 | Lara |
60 |
Himachal Pradesh | Proposed |
| 29 | Baspa |
210 |
Himachal Pradesh | Proposed |
| Total |
6055 |
— |
— |
EAC: Expert Appraisal Committee of MoEF; FAC: Forest Advisory Committee of MoEF
Source: http://www.hpseb.com/hydro_potential.htm; http://envfor.nic.in
Map of Hydroelectric Projects in Sutlej River Basin available at:
https://sandrp.in/basin_maps/Hydropower_Projects_in_%20Sutlej_River_Basin.pdf
South Asia Network on Dams, Rivers & People (www.sandrp.in) July 2013
HydroPower Performance in Indus Basin
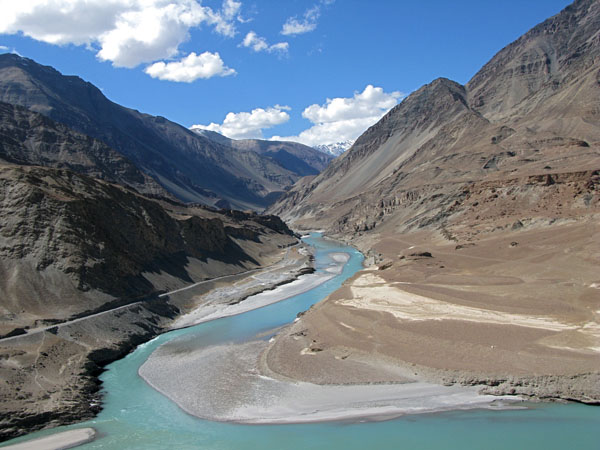
Indus river rises in the southwestern Tibet Autonomous Region of China. Originating in the Tibetan plateau of western China in the vicinity of Lake Mansarovar in Tibet Autonomous Region, the river runs a course through the Ladakh district of Jammu and Kashmir and then enters Pakistan via the Northern Areas (Gilgit-Baltistan), flowing through the North in a southerly direction along the entire length of Pakistan, to merge into the Arabian Sea near the port city of Karachi in Sindh.
The Sub-basin wise generation data of large hydro with installed capacity of the basin in the latest year 2012-13.
| Projects |
Inst Capacity (MW) |
Generation (MU) |
MU/MW |
| Sutlej |
4534.3 |
18979 |
4.19 |
| Beas |
2267 |
9125 |
4.03 |
| Ravi |
2059 |
7383 |
3.59 |
| Chenab |
1530 |
8159 |
5.33 |
| Jhelum |
690 |
3828 |
5.55 |
| Total |
11080.3 |
47474 |
4.28 |

- The above graph shows the trend line of power generation of Big Hydropower projects for last 28 years in the basin, the trend-line shows diminishing generation from existing hydro power projects of Indus River Basin.
- It shows that the per MW generation in 2012-13 (4.28) has dropped by a huge 17.69% from the highest per MW generation (5.2) achieved in the year 1988-89.
- All generation figures have been taken from official data of Central Electricity Authority (CEA).
List of other projects (up to 25 MW) under operation (for which latest generation figures not available):
| SN | Project |
Ins Cap (MW) |
State |
|
In main basin |
|
||
| 1 | Iqbal |
3.75 |
Jammu & Kashmir |
| 2 | Hunder |
0.40 |
Jammu & Kashmir |
| 3 | Sumoor |
0.10 |
Jammu & Kashmir |
| 4 | Igo-Mercellong |
3 |
Jammu & Kashmir |
| 5 | Haftal |
1 |
Jammu & Kashmir |
| 6 | Marpachoo |
0.75 |
Jammu & Kashmir |
| 7 | Bazgo |
0.30 |
Jammu & Kashmir |
| 8 | Stakna |
4 |
Jammu & Kashmir |
| Total |
13.30 |
||
| In Sub Basins | |||
| 1 | Sutlej |
31.55 |
Himachal Pradesh |
| 2 | Beas |
61.8 |
Himachal Pradesh |
| 3 | Ravi |
110.6 |
HP, J&K and Punjab |
| 4 | Chenab |
33.8 |
Jammu & Kashmir |
| 5 | Jhelum |
51.6 |
Jammu & Kashmir |
|
Grand Total |
302.65 |
Source: http://www.hpseb.com/hydro_potential.htm
http://jkspdc.nic.in/exist.htm
List of proposed and under construction projects in the basin:
| Project |
Ins Cap (MW) |
State |
Status |
|
| In Main Basin |
|
|||
| 1 | Rongdo |
9 |
Proposed IPP Project | |
| 2 | Bairaas |
9 |
Proposed IPP Project | |
| 3 | Tamasha |
9 |
Proposed IPP Project | |
| Total |
27 |
|||
| In Sub Basins | ||||
| 1 | Sutlej |
6055 |
Himachal Pradesh | — |
| 2 | Beas |
3270.1 |
Himachal Pradesh | — |
| 3 | Ravi |
1292 |
HP, J&K | — |
| 4 | Chenab |
8225 |
HP, J&K | — |
| 5 | Jhelum |
864.55 |
Jammu & Kashmir | — |
| Grand Total |
19733.65 |
— | — |
Source: http://jkspdc.nic.in/up.htm
http://www.hpseb.com/hydro_potential.htm
Map of Hydroelectric Projects in Indus River Basin available at:
https://sandrp.in/basin_maps/Hydropower_Projects_in_Indus_Basin.pdf
South Asia Network on Dams, Rivers & People (www.sandrp.in) July 2013
