Dams

How is 2012-13 Maharashtra Drought worse than the one in 1972?

Maharashtra is facing one of the worst droughts this year. Union Agriculture Minister Sharad Pawar as well as Chief Minister Prithviraj Chavan have said that this year’s drought is worse drought than the one in 1972, which was termed as a ‘famine’. Maharashtra has the highest number of large dams in the country and is now claimed to be suffering the worst drought in four decades or more.

(For more detailed analysis, with tables, please see:

Click to access Maharashtra_Drought_2012_13_worse_than_1972_March2013.pdf

https://sandrp.in/otherissues/PR_How_is_Mah_Drought_2012_13_worse_than_1972_March_30_2013.pdf)

 DSC02370

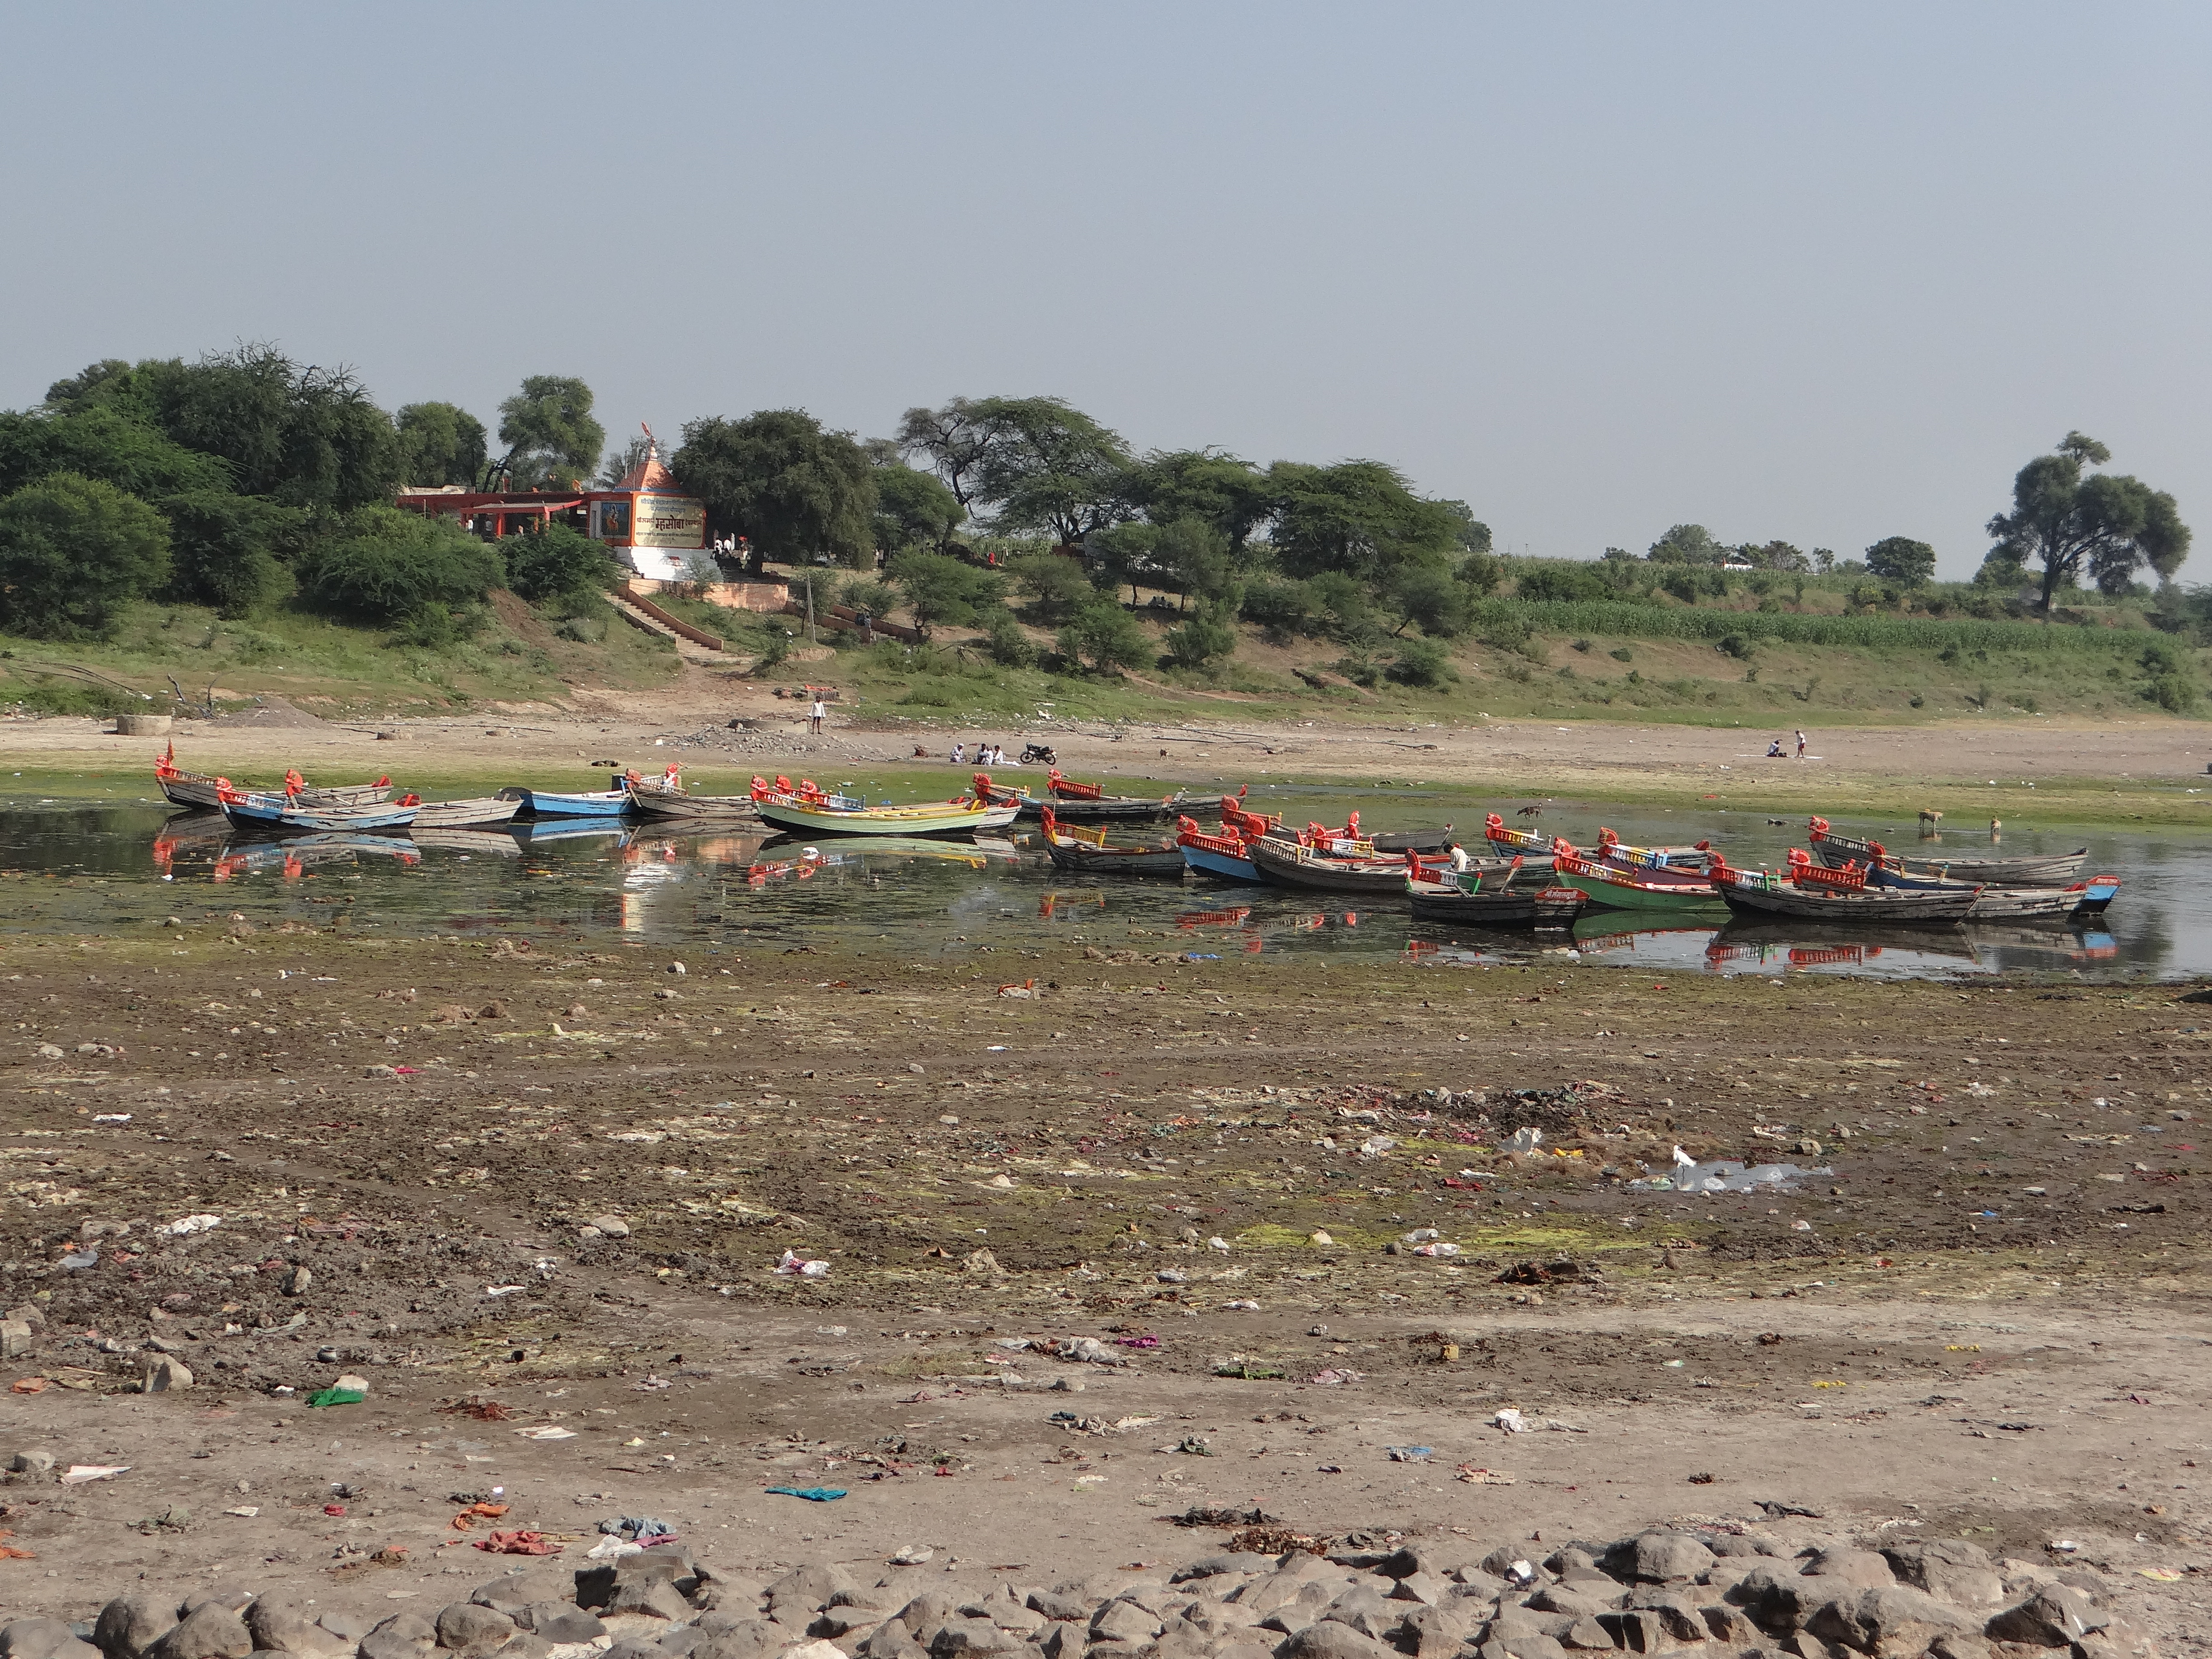
Sugarcane going to sugar factories against teh backdrop of a dry Ujani Canal in Solapur                              Photo: SANDRP

However, an analysis of the rainfall figures and the monthly rainfall pattern in 1972 and 2012 with respect to the normal rainfall pattern in seventeen drought affected districts shows a different picture. From a Meteorological and agricultural point of view, this year’s drought cannot be called worse than that in 1972. It is possible that hydrologically, this year’s drought may prove to be worse than 1972 for some districts. The blame for this lies entirely on wrong decisions about building unviable and undesirable large dams, wrong cropping patterns, diversion of water for non priority uses, neglect of local water systems and unaccountable water management by the Maharashtra government, MWRRA (Maharashtra Water Resources Regulatory Authority, set up in 2005 under a World Bank funded programme) as well as the Union Government.

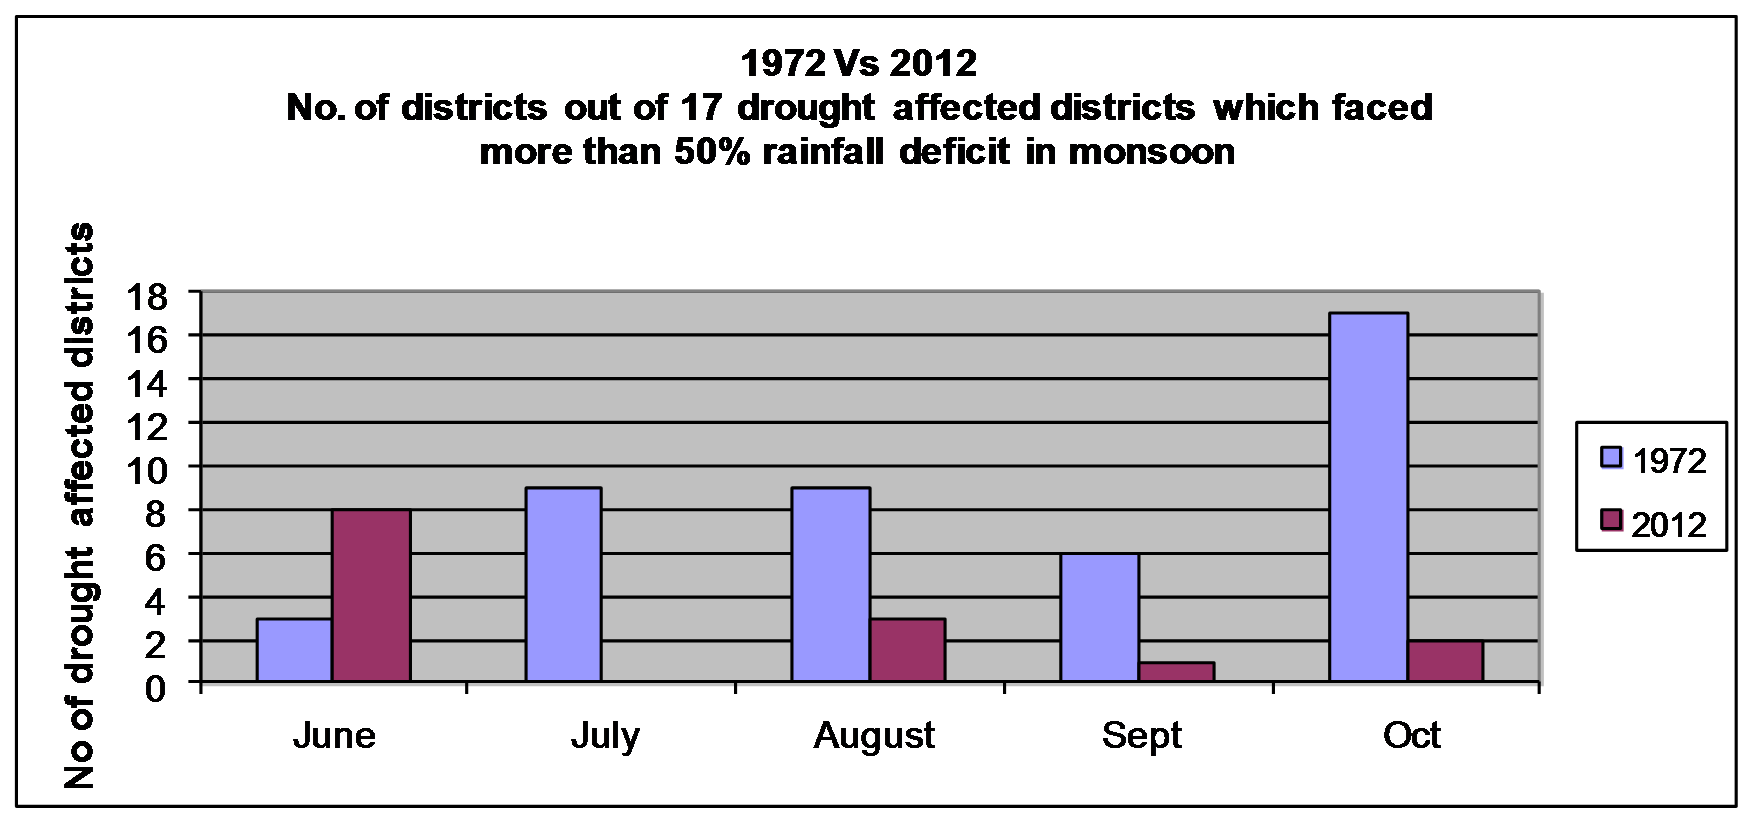
Let us look at the figures of the rainfall of 1972 and 2012. Table 1 shows monthly normal and actual rainfall for 1972 and 2012 for the months of June to October and their total for the seventeen districts[1] mentioned as drought affected. When the monthly rainfall of 1972 and 2012 shows more than 50% deficit[2] from normal, it is marked in red background for 1972 and in red numbers for 2012.

It is clear from the Table 1 that in June 2012, eight districts had monthly rainfall less than half the normal. In July 2012, no district showed a deficit rainfall more than 50%. In August 2012, the deficit was more than 50% in case of three districts: Aurangabad, Jalna and Osmanabad (these three districts also experienced over 50% deficit in June). This was the case for only Jalna in Sept 2012 and for Dhule and Jalgaon in Oct 2012. It seems from this comparison that Aurangabad, Jalna and Osmanabad were some of the worst drought affected districts this year, which is indeed the case.

In comparison, the number of districts that faced more than 50% deficit in monthly rainfall in 1972 were: 3 in June, 9 in July, 9 in August, 6 in September and all 17 in October 1972. This comparison between 1972 and 2012 for the number of districts facing over 50% deficit in monsoon months clearly tells us that the 1972 rainfall was much lower than the 2012 rainfall for every month with the sole exception of June.

Sugarcane

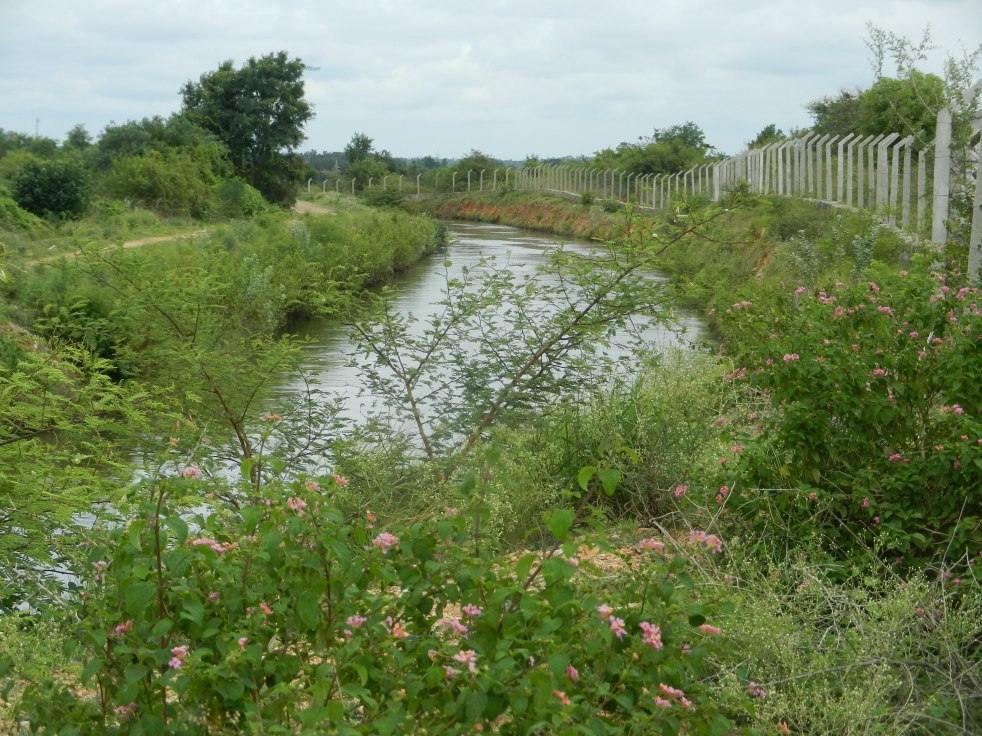
Sugarcane in various stages of growth in Solapur, in March 2013                                              Photo: SANDRP

Table 2 gives the total rainfall of these five months (June-Oct) in a normal year, in 1972 and in 2012 for these districts. This table also gives the 2012 rainfall as % of the normal rainfall and as % of 1972 rainfall in separate columns. It is clear from this comparison that only in case of two districts (Sangli and Dhule) is the 2012 rainfall substantially lower  than 1972. In two other districts (Jalna and Satara) the rainfall in 2012 is lower than that in 1972, but difference is less than 7% in both cases. In remaining thirteen districts, the monsoon rainfall in 2012 was more than that in 1972.

While comparing the 1972 and 2012-13 droughts, it must be kept in mind that rainfall in 1971, the year before the 1972 drought was also low. In comparison, rainfall in Maharashtra was above average in 2011 & most of the dams were full. Maharashtra Economic Survey for 2011-12 notes, “Total rainfall in the State during 2011 was 102.3 per cent of the normal rainfall.” The state agriculture commissioner had stated in 2011: “The good distribution of rain has resulted in good quality of crops. The above average rainfall has filled up nearly all dams, which will help replenish the soil in the run-up to the rabi season.”[3]

Table 1 Normal, 1972 and 2012 Rainfall (in mm) in Drought Affected Districts

District

Year

June

July

August

September

October

TOTAL

Ahmednagar

Normal

101.4

102.5

84.3

148.1

61

497.3

1972

80.36

80.29

60.2

97.87

1.2

319.92

2012

39.6

86.8

63.8

93.6

99.5

383.3

Pune

Normal

139.9

286.6

181.4

144.9

77.3

830.1

1972

132.41

338.48

68.74

120.42

1.08

661.13

2012

55.8

161.2

205.6

116.8

137.2

676.6

Solapur

Normal

102

101.1

104.3

181.4

70.9

559.7

1972

49.35

64.28

20.03

91.4

25.99

251.06

2012

56.1

93.6

53.2

103.8

105.3

412

Satara

Normal

149.3

339.9

204.5

140.5

87.9

922.1

1972

241.54

535.62

73.65

127.79

1.75

980.35

2012

114.2

270.1

278.2

123.9

131.4

917.8

Sangli

Normal

92.9

132.1

96.7

133.6

96.3

551.6

1972

151.5

337.19

54.05

107.24

15.17

665.16

2012

48

78.7

58.8

68

154.4

407.9

Aurangabad

Normal

131.4

168.1

166.7

157.3

51.8

675.3

1972

92.07

46.64

64.63

85.64

0.85

289.84

2012

49.1

118

67.6

84.7

49.4

368.8

Jalna

Normal

138.9

171.8

166.7

156.7

54

688.1

1972

105.46

54.83

73.32

102.16

0.61

336.39

2012

43.4

95.2

62.7

78.4

44.3

324

Beed

Normal

128

161

138.8

177.6

63.1

668.5

1972

78.35

36.69

48.09

105.09

2.84

271.06

2012

54.9

108.6

82.7

107.3

81.4

434.9

Latur

Normal

145.6

192.7

181.8

205.2

63.3

788.6

1972

64.32

46.54

84.57

123.98

6.48

325.88

2012

115.6

183.4

160.8

163.9

136.3

760

Osmanabad

Normal

163.3

141.6

221.9

148.6

66.3

741.7

1972

59.03

32.23

33.48

115.17

17.54

257.44

2012

45.8

142.1

46.2

106.8

49.7

390.6

Nanded

Normal

164.8

273.9

246.9

197.2

60.9

943.7

1972

128.16

74.17

115.95

60.02

3.99

382.28

2012

108.4

219.3

154.9

125.5

52.6

660.7

Akola

Normal

135.2

231.3

182.8

148

37.6

734.9

1972

119.26

130.75

244.64

72.22

0.58

567.45

2012

151.4

292.9

148.8

198.7

36.3

828.1

Nashik

Normal

154.4

378.1

282

198.5

60.9

1073.9

1972

101.476

252.837

207.496

78.948

2.37

643.127

2012

83.2

262

280.1

162.4

75.7

863.4

Dhule

Normal

116.6

168.7

131.8

113.3

36

566.4

1972

87.68

159.823

240.364

48.517

1.578

537.962

2012

32.5

171

112

79.6

10.6

405.7

Jalgaon

Normal

130

206.8

187.8

139.2

39.1

702.9

1972

88.734

80.941

149.924

59.197

0.836

379.632

2012

19.6

181

102.5

86.2

15.3

404.6

Parbhani

Normal

126.6

210.8

203.5

180.7

55

776.6

1972

98.107

61.838

97.434

84.497

0.783

342.659

2012

99.5

192.4

107.4

159.3

78.5

637.1

Buldhana

Source: 1972 Rainfall Data: http://indiawaterportal.org/met_data/

Normal and 2012 Rainfall Data: http://www.mahaagri.gov.in/rainfall/index.asp

In addition, Maharashtra has by far the largest number of Big Dam in India. In 1972, some of the big irrigation projects in the worst drought affected districts. In 40 years since 1972, Maharashtra has built a very large number of big dams, ostensibly to help these drought prone areas. For example, Aurangabad has Jayakwadi project (completed in 1976), Beed has Mazalagaon Project (Jayakwadi Stage II), Jalna has Upper Dudhna and Lower Dudhna projects. Osmanabad depends partly on Ujani Dam, partly on schemes in Krishna basin, Solapur completely depends on Ujani. Live storage of most of the dams in drought affected districts is either 0 or near zero today. All these projects and increased groundwater use facilities in 2012 should actually be able to reduce the impact of rainfall deficit in 2012, which is lower than the deficit of 1972. But the situation is actually the worse in 2012 compared to 1972, claims the Chief Minister and the Union Agriculture Minister. So what are the reasons for this? For one, area under sugarcane in Maharashtra was 167 000 ha in 1970-71, going up to 1022 000 ha in 2011-12 (Maharashtra Economic Survey 2012-13).

districtwiseSugarcane

Chart showing district-wise Normal, 1972 and 2012 rainfall for the 16 drought affected districts of Maharashtra

Table1

As can be seen from the profiles of some of the districts given in Table 3 and accompanying chart, Solapur, Pune, Ahmednagar, Sangli, Satara, Osmanabad, Beed, Latur, Nashik, Jalna, Parbhani and Aurangabad, all drought prone and drought affected districts are major sugar producing centres of the State. They collectively produce 79.5% of sugar produced in Maharashtra. According to Maharashtra Economic Survey for 2012-13, “As on 31st December, 2012, out of the total sugar production in the country, the share of State was 35.3 per cent”. So more the drought prone districts of Maharashtra produce more than a quarter of India’s sugar!

Table 2 Total Rainfall in drought affected districts in 1972 as against 2012 (in mm)

  Districts

Normal

1972

2012

2012 as % of Normal

2012 as % of 1972

1 Ahmednagar

497.1

319.9

383.3

77.1

119.8

2 Pune

830.1

661.1

676.6

81.5

102.3

3 Solapur

559.7

251.1

412.0

73.6

164.1

4 Satara

922.1

980.4

917.8

99.5

93.6

5 Sangli

551.6

665.2

407.9

73.9

61.6

6 Aurangabad

675.3

289.8

368.8

54.6

127.2

7 Jalna

688.1

336.4

324.0

47.1

96.3

8 Beed

668.5

271.1

434.9

65.1

160.4

9 Latur

788.6

325.9

760.0

96.4

233.2

10 Osmanabad

741.7

257.4

390.6

52.7

151.7

11 Nanded

943.7

382.3

660.7

70.0

172.8

12 Akola

734.9

567.5

828.1

112.7

145.9

13 Nashik

1073.9

643.1

863.4

80.4

134.3

 14 Dhule

566.4

538.0

405.7

71.6

75.4

15 Jalgaon

702.9

379.6

404.6

57.6

106.6

16 Parbhani

776.6

342.6

637.1

82.0

186.0

17 Buldhana

713.0

453.2

612.2

85.9

135.1

As one travelled during March 2013 in some of the drought affected districts like Pune, Solapur, Ahmednagar and Nashik one saw unending fields of sugarcane,  and some of Banana and Grapes on both sides of the road. Many of these fields were planted after August 2012 when it was known that Maharashtra would be facing a drought this year. There was no attempt by anyone in the Maharashtra govt or administration to curb either planting of sugarcane and other water intensive crops or to curb any of the water intensive activities like running of sugar and wine factories in the drought affected districts. The builders continued to advertise sale of houses attached with swimming pools in drought affected areas. Maharashtra continues to divert millions of cubic meters of water everyday, out of the Krishna and Bheema basin, to the Konkan area with average rainfall of over 3000 mm. The manager of Solapur Hotel said that there is no water scarcity. Groundwater levels are down, but there seemed little sign of drought in most of these areas. The poor and the cattle are facing the water shortage. However, it seems those who had the money and power continued to get as much water as they needed, for whatever purpose they want it for. An NDTV programme on March 29, 2013 accused NCP leaders of stealing water in times of drought[4].

Dry Seena

Table 3: Profiles of some of the drought affected districts

Area in ‘000 ha Ahmednagar Aurangabad Beed Jalna Osmanabad Sangli Solapur Pune
Geographical area

1702

1007.7

1068.6

772.6

748.5

861

1487.8

1562

Sown area

1146.3

654

876

529

519.3

557.1

919.7

945

Net Irrigated area

330

163.3

137.7

116.5

106.66

174

251.5

287

Canal irrigated area

84

31.05

108.92

22.17

18.72

45

31.4

121.5

GW irrigated

246

130.31

Nil

91.28

102.74

38.5

193.5

92.3

Sugarcane area 2007-08

133.3

34.3

74

25.1

53.8

64.7

154.5

104.2

2010-11

126

23.3

58.8

19.3

43.2

76.3

163.1

111.5

Amazingly, the Maharashtra Economic Survey for 2012-13, published after March 19, 2013[5] does not mention that the state is suffering from drought, leave aside giving details of the drought prone areas. Interestingly, it says that during 2012 monsoon, Maharashtra suffered rainfall deficit of 9.7% and that 10 districts and 136 talukas had deficit over 25%. And Yet the survey reported that water availability situation was alarming in Aurangabad, Jalna, Beed, Osmanabad, Nanded, Ahmednagar, Nashik, Jalgaon Pune, Satara, Sangli, Solapur and Buldhana (13 districts). These districts, the survey said, suffered “very severe water scarcity”. It said 1779 villages were supplied water through tankers as on March 4, 2013, topping the list was Aurangabad division with 771 villages. 4709 wadis were also supplied water through tankers, topping the list here was Pune division with 3197 wadis.

MWRRA and the state machinery have entirely failed in managing water levels at Jayakwadi & Ujni dams and releases from the upstream dam releases. There has been no serious attempt at controlling area under sugarcane and sugarcane crushing in the drought areas or controlling unauthorised sugarcane cultivation around Ujani backwaters, or unauthorised lifts from upstream of many dams like Nandur Madhyameshwar and through canal systems Majalgaon Project or lifting of water from the river beds for sugarcane or curbing other non essential water intensive activities. In fact all efforts have been towards increasing the area under sugarcane and other water intensive activities in the drought prone areas. In affidavit in the High Court, Maharashtra government said on March 28, 2013 that MWRRA effectively does not exist!

40 years after Maharashtra’s worst drought of 1972, the state seem to be in worse situation this year, despite spending lakhs of crores on irrigation projects and despite putting in place numerous institutions and authorities to manage water. While 1972 drought could be called a natural calamity, 2012-13 drought is a disaster of water management accompanied by corruption, extremely water intensive cropping pattern unsuitable for the drought prone areas, pushed by the government and the politicians, top heavy institutions without local participation or transparency, absence of responsive disaster management system and absence of a long term view to manage drought.

Parineeta Dandekar (parineeta.dandekar@gmail.com) and Himanshu Thakkar (ht.sandrp@gmail.com)

South Asia Network on Dams, Rivers & People (www.sandrp.in)


[1] Ahmednagar, Pune, Solapur, Sangli, Satara, Aurangabad, Beed, Jalna, Latur, Osmanabad,Nanded, Akola, Parbhani, Buldhana, Nashik, Dhule and Jalgaon

[2] It may be noted here that India Meteorological office calls rainfall deficient when deficit is 20-60% and scanty when deficit is more than 60%. We have used the figure for 50% just for comparison here.

Floods

Build them Higher and Higher!!

This week, there was news that Nepal and India have agreed to ‘strengthen’ the embankments on shared rivers like Bagmati, Kamla and Khando in a bid to control floods. “Both the countries have already agreed to strengthen embankments of Bagmati, Kamla, Lalbakeya and Khando rivers and extend the embankments along these rivers to higher ground in Nepal to control spilling of flood water,” Water Resources Minister Harish Rawat said” (http://economictimes.indiatimes.com/news/politics-and-nation/india-nepal-agree-to-strengthen-river-banks-to-avoid-floods/articleshow/19035269.cms)

Now while we are busy building our embankments higher and higher, one of the most flood prone country in the world: The Netherlands is doing something drastically different. Through its ‘Room for the River’ Program, Netherlands is actually leaving spaces for floods to spill, and minimise the damage, rather than building higher and higher embankments.roomfortheriver1

“After 800 years of building dikes, we’ve been making them higher and higher,” said Gert-Jan Meulepas, project manager at Royal Haskoning, an engineering and environmental consultancy that developed the project. “But if something goes wrong, the damage will be greater.” (http://www.scientificamerican.com/article.cfm?id=how-the-dutch-make-room-for-the-river)

roomfortheriver2

With Climate Change and extreme weather events a reality, the focus in Europe and America has shifted from making ‘Zero Failure’ infrastructure to infrastructure that is ‘allowed to fail’ with other protective measures in place like flood dissipation, protected floodplains, alert disaster management, etc. “Designing projects so they are safe to fail,  is often cheaper and more efficient, Kirshen believes. A community might opt to build a dam designed to contain up to a 100-year flood, then develop a comprehensive evacuation plan for the surrounding area in the event of a more severe flood. This strategy anticipates that the dam may not control extreme flooding, but adds other protective measures for higher levels of safety.”http://www.climatecentral.org/news/for-engineers-climate-failure-becomes-an-option-15769

One of the best examples of this flexible management is the Yolo Bypass in the Sacramento Basin in California. Yolo Bypass actually accumulates floodwaters in case of extreme floods and is used by water fowl and wildlife. It is the largest public/private restoration project west of the Florida Everglades. The entire bypass forms a valuable wetland habitat when flooded during the winter and spring rainy season. In the summer, areas of the bypass outside the wildlife areas are used for agriculture.(http://www.yolobasin.org/wildlife.cfm)

Image

Image

India and South Asia on the other hand, though facing severe threats from climate change and floods and with a history of embankment breaches are refusing to learn lessons. The recent discussion about strengthening embankments between India and Nepal seems to be  a result of this mindset which is not flexible to include ecosystems, goods and services of floodplains and climate change challenges.Image

Shri. D. K. Mishra jee has written extensively about embankments and floods in Bihar. His latest book on Bagamati: https://sandrp.in/pub/River_Bagmati_Bounties_Become_A_Curse.pdf

Image

Image

Dams

Fish Ladders: Do they Work?

During the last few months several contradictory facts have been surfacing about fish ladders. Fish Ladders are small elevated steps or passes made in dams, with water releases to enable fish to migrate in the upstream (or downstream) of the dam.

Image

This upstream migration is a part of the reproductive cycle of many fish, like Hilsa and Mahseer in India.

Image

A study in the United States, a country with comprehensive attention to impacts of dams on fish, has concluded that actual numbers of fish who make it to their spawning grounds above dams with fish passages is a small fraction of targeted goals of these facilitie.  For example, for American shad (Incidentally, Hilsa is also a type of Shad) – an important species for commercial and recreational fisheries that sustained generations on the East coast of the US – on average about only 3% percent of the fish that pass the first fishway make it past the last dam with a fishway in these rivers. Another example is that species such as Atlantic sturgeon cannot pass fish ladders—so for certain species, fishways do not work at all. Thus, in these systems, effective up and down stream passage is not being provided for anadromous fish. The result is that these species are getting listed as endangered or threatened one by one. The study actually concludes that looking at the dismal success rate of fish ladders and hatchery based recovery programs, “Ecologically and economically significant species restoration is not possible without dam removals”. (International Rivers)

Image

A spectacular film “End of the River” chronicles the impact of small hydropower dams on fish in Europe. The film says that water released from the fish ladders is not enough for the fish species to survive in the downstream. https://sandrp.wordpress.com/2013/03/16/the-end-of-the-river/)

At the same time, ecologically designed fish ladders do help the fish get across the impediment of dams in some cases. For example, a weir on River Elbe in Germany counted its Millionth migrating fish in January 2013, 3 years after it was built.(http://www.dw.de/german-fish-ladder-celebrates-millionth-user/a-16509927)

Image

Lesson for India seems to be that, in keeping with our livelihood dependency on riverine fish and their ecological value:

  • Dams should not be built in ecologically important regions with documented fish diversity like in Western Ghats, Eastern Himalayas, near river confluences and near estuaries.
  • Existing dams, where feasible, should have  fish ladders and passages designed for Indian species, these should be monitored by independent committees with local participationImage
  • all small hydel projects should have functioning fish ladders and most importantly,
  • ALL dams should release e-flows which exceed the flows needed for fish survival and migration. E-flows should be released through fish passages and not turbines. They should keep in mind the need for longitudinal and lateral connectivities.
  • No in stream sand mining should be allowed. No diversion of water for sand mining should be allowed. Sand mining should only be done manually, use of machine should not be allowed.

Unfortunately, even India’s premier research institutes like CIFRI are recommending eflows which are insufficient for species like trouts to survive. Its not a coincidence that these recommendations are very convenient for the private dam developers who are funding these studies.

SANDRP (ht.sandrp@gmail.com)

POST SCRIPT: Some related articles on SANDRP blog:
1. https://sandrp.in/2016/11/24/narora-barrage-fish-ladder-ganga-and-memories/
2. https://sandrp.in/2016/08/12/sushri-umaji-hilsa-fisherfolk-and-ganga-deserve-more-than-a-fish-ladder-by-cifri/
3. https://sandrp.in/2014/02/02/fish-ladder-at-kurichhu-hydropower-project-bhutan-some-thoughts/
4. https://sandrp.in/2014/12/17/larji-dam-fishladder-an-unlovely-trinket-a-deceptive-ornament/

Hydropower

Hydropower at the Cost of Drinking Water?

Even as the state faces one of the most severe droughts in recent history, the irrigation department continues to divert water from the water-deficient Krishna valley to the water-surplus region of Konkan. Around 50 thousand million cubic feet of water (TMC) is annually diverted for three private hydro electricity plants in the Bhima sub-basin, which ultimately flows into the Konkan region.

Image

While engineers of the water resources department claim that the diversion is necessary for production of hydro electricity, water experts say drinking water should be given more importance in a drought year.

Located in the upper Krishna Basin, Koyna Dam has the largest live water reservoir (2,836 TMC) in Maharashtra. The dam also houses five powerhouses with a total capacity of 1,956 MW. Of this, 1,920 MW installed capacity takes out water from the Krishna basin that flows into the water-surplus region and only the smallest 36 MW powerhouse at the dam toe allows the water to flow into the Krishna basin in Maharashtra. Krishna basin also houses some of the worst drought-hit areas of the state, such as the taluka of Maan and districts of Sangli and Solapur.

The diversions are taking place from the dams of Shirawantha, Walwhan, Lonavala, Kundli, Thokewadi and Bhira for the three privately operated hydro-electric projects. The total power generation capacity of these three plants is around 300 MW. However, the water so used in generation of hydro-electricity flows to the westward flowing rivers, which drain ultimately in Konkan.

As per the latest available storage position of the reservoirs, Koyna dam has a live storage of 68.78 TMC, while the dams catering to the private hydro-electric stations have a live storage of around 18.75 TMC of water.

This stock, say experts, can cater to the drinking water and domestic requirements of 7 crore people for an entire year.

Water expert and South Asia Network on Dams, Rivers and People (SANDRP) founder says post the usage in the privately owned dams, the water flows into the rivers of Vashisthi, Kundalika, Patalganga and Savitri, which flow via Konkan and drain into the Arabian Sea. “The rivers pass through chemical hubs and thus get polluted and become unsuitable for human consumption,” he says.

Making a strong case for stopping this diversion, Thakkar says the water, if not diverted, would be sufficient to meet the water needs of Sangli and Satara immediately. “In neighbouring Karnataka, the government has stopped five hydro power generation stations, to preserve the water for drinking purposes for Bangalore city. In Maharashtra, we need to initiate a dialogue and take a decision to stop the diversion in the worst drought year for the state,” he adds.

Engineers associated with the project, however, point out that the proposal, though feasible, can’t be executed for technical and other reasons. To start with, they say, since the canal distribution system to carry water downstream is not ready, and due to the gradient difference, lifting water would be difficult.

D N Modak, chief engineer of the Koyna project, says it is the power generated from these projects that is required for the state. “There is sufficient water available in the Koyna dam,” he claims.

Dams

Drought engineered by state govt

Drought engineered by state govt: expert
DNA Correspondent; March 24, 2013

The current drought situation in the staImagete has been engineered by the state government, which has diverted water to cash crops, alleged Himanshu Thakkar, coordinator of the South Asia Network of Dams, Rivers and People.

He was speaking at the opening session of the two-day conference titled, ‘The water sector of India – challenges and prospects’ here on Saturday. The event was organised by the Karve Institute of Social Service as part of its golden jubilee celebrations.

Thakkar said, “If we compare the 1972 rainfall to this year’s, we can see that the rainfall this year is higher. The sugarcane crop has not been affected this year, though there is a severe drought. This shows that water is being diverted to sugarcane at the expense of other crops. At the same time, water is being diverted from the Krishna basin to the Koyna power plant to be used for electricity generation.”

Thakkar added that though thousands of crores of rupees had been spent on building dams in the last 20 years, the net irrigated area in the country has not increased much.

He said the drought in Maharashtra was engineered. “Despite what we hear about the severity of the drought, the fact is that the sugarcane production in the state has not dropped,” he said.

The sugarcane crop has not suffered at all. Though the government of Maharashtra has spent thousands of crores of rupees on new dams in the last 20 years, irrigated area in the state has not increased much. The irrigation department officials are not accountable to the people.”

He said that today groundwater was the mainstay of the people, especially in rural areas. “Both rural water supply and irrigation are largely supplied through groundwater, but there is no regulation of this resource. With every passing day, our dependence on groundwater is rising, but we are not doing anything to protect or preserve our groundwater sources,” he said.

Thakkar added that rising water pollution was another major challenge. He slammed the central and state pollution control boards for their failure to ensure clean water bodies. The Water (Prevention and Control of Pollution) Act was passed in 1974, after which the states set up the state pollution control boards. But today, there are hardly any water bodies that have been made clean by these boards. “There is hardly any example of a polluted water body in the country that was cleaned by the boards since 1974,” he said.

Another expert too pointed out the different treatment given to the sugarcane crop. Shripad Dharmadhikari, a policy researcher at Manthan Adhyana Kendra, Pune said, “The major problem over water is that there is no mechanism of allocating water. Though Maharashtra has over 30 per cent of the nation’s major dams, the water is only being used for sugarcane crop. What one sees in many villages is that people are struggling to get drinking water, while on other hand the sugarcane crop is well-irrigated. We should give priority for drinking water over all other requirements.”

Some experts spoke on the need for planning. Himanshu Kulkarni, secretary of the NGO, Advanced Centre for Water Resources Development and Management (Acwadam), said that the biggest problem today is the absence of planning to meet water needs. “We need to have a plan for the next 15 years in order to preserve water sources, especially groundwater. There is a clear link between the current drought and the over-extraction of groundwater.”

Magasasay awardee Rajendra Singhji of Tarun Bharat Sangh and Jal Biradari said there were four key components in protecting natural resources like water. “One is to control water evaporation; second, enhance ground water; third, take control over your own life (uske bad apna jivan chalawo); and finally stand up against those who loot your resources.” He spoke at the last session of the first day of the state-level event organised as part of Karve Institute’s golden jubilee celebrations.

http://www.dnaindia.com/mobile/report.php?n=1815072&p=0

International Water Issues

WORLD WATER DAY 2013: INDIA AND SOUTH ASIA: FROM CONFLICT TO CO-OPERATION

This World Water Day comes in year which has been declared as the “International Year of Water Cooperation” by the United National General Assembly. In addition, the UN has proclaimed the decade 2005-2015 as the International Decade for Action, “Water for Life”.

Image

The UN declarations would be welcome if we are able to take credible and effective steps towards water cooperation at every level in an equitable, sustainable way and through local participation. This becomes increasingly relevant when demand for water is increasing due to rising population, urbanisation, industrialisation, increased per capita use and increased losses due to climate change. The available and utilisable supply of water is either stagnant or decreasing due to increased pollution, increased temperatures, changing rainfall pattern, melting of glaciers and over exploitation. Moves towards centralised and undemocratic governance and privatisation of resources are not helpful as they do not promote cooperation, but only further conflicts. The prevailing and emerging situation is a sure fire recipe for increasing conflicts, not cooperation.

Image

At the same time, UN Declaration of July 2010, declaring water as a human right remains only on paper. UN and the governments will clearly need to go beyond mere words and pious declarations.

Water: Some key characteristics Water is not just a commodity for market or an economic good. It is an ecological entity embedded in larger ecology that includes the climate, land, forests, and biodiversity. This includes, but is not limited to: Glaciers, rivers, wetlands, lakes, aquifers, soil, snow and water vapour in the atmosphere. In fact our understanding of the interplay of water in the larger eco-system is still far from complete. When we use water from any source, we should be mindful of its impact in the larger ecosystem. The UN resolution for declaring the 2005-2015 decade was not called “water for life” for nothing. Life here includes not just life of every human being but life on the entire planet.

INDIA AND NEIGHBOURS On this occasion, it would be useful to take a look at the situation in the region. India and China are locked in one-up man ship in Brahmaputra basin, India and Pakistan are competing in destroying shared rivers, ecology and connected livelihoods  through hydropower projects in the Indus river basin while India and Bangladesh are struggling to arrive at an agreement on sharing the Teesta waters. When it happens, this will be only the second water sharing treaty, among the 54 rivers shared by India and Bangladesh.

Image

Considering that the countries in this region share the Himalayan watershed on which numerous big and small rivers and millions of people and biodiversity depend, there is an urgent need to have a Regional Policy for the common good of the people of the region.

Possible Chinese diversion The Chinese government officials have often talked about China’s intention of diverting the Brahmaputra (basically Siang River, one of the main tributaries of the Brahmaputra) river to North China, just before the river enters India. China has officially declared its plans to build at least four hydropower projects on the river. The work on the water diversion project is yet to start and China has denied that the project is being taken up. However the Indian government is pushing more big hydro projects in Arunachal Pradesh, claiming that these will help establish India’s prior use rights over the waters of these rivers when China does decide to take up its North South diversion project.

Image

Such a push for big hydro in Arunachal Pradesh under the bogey of Chinese plans is only likely to worsen the situation for the people of Arunachal Pradesh and also for downstream areas in India and Bangladesh. This will only create new water conflicts. Moreover, there is no international mechanism that would help India claim its prior user right. The 1997 UN Convention on the Law of the Non-Navigational Uses of International Watercourses could have been of use, but India has yet to ratify the convention. The best course for India is to push China for a water sharing treaty.

In view of the crisis of climate change, this need has become even more acute. Today, there is no such policy and each country is developing multiple projects on its own, and many of the so-called development projects are actually accelerating climate change impacts and conflicts. Hundreds of hydropower projects are either constructed, are under construction or are being planned across the countries in the region. These projects, along with their paraphernalia of roads, townships, mining, tunnelling, blasting, muck dumping, diverting of rivers and dams are cumulatively having huge, though as yet unquantified impact on the glaciers, forests, aquatic and terrestrial biodiversity, communities, water availability and water supply ,thereby impacting the climate as well.

Flood forecasting: One of the areas where information sharing is immediately required is in the area of sharing information about forecasts related to floods in the shared rivers. The governments in the region seem to have a number of agreements to share information in this regard, including Pakistan-India, Nepal-India, Bhutan-India, Bangladesh-India and China-India. Unfortunately, the shared information in this aspect is not in the public domain. Such shared information must be in public domain. What use is the flood forecasting related information if it is not shared among the people who are going to face the disastrous impacts of floods?

Transparency and Participation in governance in shared river basins There are elaborate, mostly bilateral inter-governmental mechanisms on governance of water and rivers in a number of cases in the South Asia region. These pertain to the bilateral arrangements of India with Pakistan, Bhutan, Bangladesh, Nepal and China. These arrangements include basin level commissions, minister level committees, officer level committees, project specific commissions and so on. Unfortunately, there is practically no transparency in the functioning of these mechanisms, nor is there any role for any concerned actors outside the government. In governance of rivers, waters and related projects, local people have the right to know what is going on in these committees and commissions.

The need for such public participation was acutely felt in the aftermath of the Kosi Disaster on the Indo-Nepal border in August 2008. During the initial period of this disaster, it was shown how the bilateral Kosi High Level committee had failed to achieve the proper maintenance of the embankment that breached with the flow of water in the river was less than 1.5 lakh cusecs (Cubic Feet per Second) even as the design capacity of the embankment was over 9 lakh cusecs. In the days that followed, it became clear that if there had been some non government people on the Indo Nepal Kosi committees and there was more transparency with representation from local communities and civil society in the committees, it would have helped ensure the maintenance of the embankment and that possibly would have saved it from breaching at least on that particular occasion.

Image

Conditions for water cooperation We need to understand key conditions that would help achieve better cooperation in water sector. Some key conditions in this regard include:

Clearly defined priorities for water use, rules of allocation of water to different users, water allocation mechanisms among various sectors, democratic rules of governance of such mechanisms, understanding the importance of ecosystem resources, Conservation of ecosystem resources including Wetlands, forests, rivers, lake, biodiversity; clearly defined and legally enforceable Right to Water and mechanisms to enforce the same. Good governance in this context would include clearly defined norms for key aspects like transparency, accountability and participation. There is need to have legal and institutional set up to achieve these goals.

The weaker sections (tribals, Dalits, women, marginal farmers, coastal and mountain populations) or weaker stakeholders (environment, rivers) have always been losing at the negotiating table. Centralising of authority and decision making being more and more away from local stakeholders creates possibility of more conflicts and conflict resolution becomes more difficult. Local water management can help reduce and also help address conflicts at the local level.

Image

WORLD COMMISSION ON DAMS: Framework for cooperation in water management The report of the World Commission on Dams: Dams and Development – A New Framework for Decision Making provides a useful starting point to achieve cooperation in water management[1]. The recommendations of the report are applicable at every level, from community to international level. It would be good if the United Nations recognises the principles in the WCD report in this year of water cooperation and provides some institutional support for their implementation and if countries in the region follow these recommendations for transboundary as well as local rivers.

THE ROLE OF UN Sixty percent of the world’s freshwaters are transboundary. So there should be little doubt that water cooperation is critical to avoid conflicts and ensure effective and sustainable use of shared resources. Over the years, the UN has been coming out with various programs and principles on water resources management. However, none of them have legal and institutional back up. Its 1997 Convention on the Law of the Non-Navigational Uses of International Watercourses is yet to come into force[2] as it has yet to receive ratification of the required 35 countries. Significantly, India abstained from voting for the convention at the UN and also has yet to ratify it.

Another instrument in this context is the UNECE (UN Economic Commission for Europe) Convention on the Protection and Use of Transboundary Watercourses and International Lakes (Water Convention)[3] is currently the only international legal framework in force governing the management of transboundary water resources. It turned into a global convention in Feb 2013, having received sufficient number of ratifications. The UNECE website says in this regard: “This is a ground-breaking development as the Convention was originally negotiated as a regional instrument by countries of the United Nations Economic Commission for Europe. It is also a major milestone of the International Year of Water Cooperation celebrated in 2013… more than 30 countries from outside the UNECE region already actively participate in activities under the Convention. Several countries have already indicated their interest in becoming Parties… will create a strong legal base for present and future Parties to the Convention to join their forces to protect transboundary waters and the benefits deriving from them… Moreover it will strengthen political support to transboundary water cooperation.”

At the same time UN needs to ensure that it does not become cause of greater conflicts as is happening now through its funding of destructive hydropower and other projects under the UNFCCC’s Clean Development Mechanism. Those projects are happening at the cost of the local communities and their environment and providing completely unjustified, unwarranted and unnecessary funding of project developers, thus fattening the bank balances of the rich and at the same time creating more conflicts.

The world leaders and media have been quoting ad nauseam the now infamous quote from the former United Nations Secretary General Boutros Boutros Ghali to the effect that next war may be fought for water. Many would call this unwarranted war mongering, that too from a UN personnel. There is a lot the UN needs to do to achieve greater water cooperation across the world to wash off this image. May the UN succeed in this effort!

Himanshu Thakkar (ht.sandrp@gmail.com)                                                                                                               March 21 2013

South Asia Network on Dams, Rivers & People (www.sandrp.in)                                                            


[1] It calls for going “beyond looking at water as a finite commodity to be divided and embrace an approach that equitably allocates not the water, but the benefits that can be derived from it”, for agreements based on principles of equitable and reasonable utilisation, no significant harm, prior information, free prior and informed consent of affected communities. The report says that “Storages and diversion of water on transboundary rivers has been a source of considerable tension between countries and within countries.” Some key strategic priorities of the report include: gaining public acceptance, recognising entitlements, sustaining rivers and livelihoods.

Dams

Maharashta Drought: Breaking the Sugar Shackles


The fact that the state’s most drought-prone regions have continued to devote precious resources for highly water-intensive sugarcane cultivation and sugar production indicates that there is more to the region’s water crisis than climatic conditions alone. Parineeta Dandekar analyses.

This year seems to be a year of basalt-hard lessons for Maharashtra. The year saw the irrigation scam, sugarcane farmers protesting for a fair price (leading to the death of two farmers) and now a ‘drought worse than 1972’ with 11,801 villages declared to be drought affected in March 2013.

If we analyse these three events in perspective, their link becomes inextricably clear. This year’s drought, though devastating, was not an unannounced calamity. It had been building up since August 2012, when more than 400 villages were declared drought-affected. The protest by sugarcane farmers was not a sudden outburst either; their discontent over fair price for sugarcane had been simmering and occasionally boiling over for the past few years. Last but not the least, the irrigation scam, though unprecedented in scale, was not a sudden revelation. Many NGOs, whistle blowers and government committees had been warning about the tip of the iceberg for several years.

Many experts, organisations and reports like World Bank have highlighted the unjustifiably high share of sugarcane in Maharashtra’s irrigation

That all these factors came together in one year is not just an unfortunate coincidence. It shows that the reasons behind the Maharashtra drought are starker than simply less rainfall. Unless these root causes are addressed, no amount of state and central assistance can banish droughts. Farmers and rural and urban poor have been suffering for too long due to the opportunistic and myopic response of the political and administrative leadership in Maharashtra to successive droughts. To understand and change this, we need to first take a long, deep look at some of the reasons sparking the water shortage:

Worst drought-affected districts have the most sugar factories

Sugarcane is one of the most water-intensive crops grown in Maharashtra, requiring ten times more water than Jowar or nut. Ironically, the regions where it is grown the most are chronically drought hit regions, which have been receiving central aid for drought proofing though the Drought Proof Area Program and other such schemes. Sugarcane area under drip irrigation in these regions is dismally low.

According to the Water Resources Department, Maharashtra, in 2009-10, of the approximate 25 lakh hectares (Ha) of irrigated area in Maharashtra, 3,97,000 Ha was under sugarcane. However, according to the Union Agricultural Ministry (which would get its data from the State Agricultural Department), area under sugarcane was 9,70,000 hectares in 2010-11 and again 10,02, 000 hectares in 2011-12.

When it was grown on 16% Irrigated area, sugarcane used 76% of all water for Irrigation. With area under sugarcane increasing, its hegemony has increased exponentially.  Not only does it capture maximum water, it results in water logging, salinity and severe water pollution by sugar factories. Incidentally, Maharashtra has 209 sugar factories, the highest in any state in India.

A strong example of links between drought and sugarcane may be found in the Solapur District in the Bhima Basin, which is facing the worst of droughts today. Live storage of Ujani Dam is zero and drinking water is being taken from dead storage, even as Solapur and 400 villages depend on Ujani for drinking water. Drinking water supply has become a severe problem. Hundreds of villages and blocks have been declared drought affected. Nearly 1000 tankers have been plying, and there is a near exodus of stricken communities to urban areas.Image

When it was grown on 16% Irrigated area, sugarcane used 76% of all water for Irrigation. With area under sugarcane increasing, its hegemony has increased exponentially. Not only does it capture maximum water, it results in water logging, salinity and severe water pollution by sugar factories. Incidentally, Maharashtra has 209 sugar factories, the highest in any state in India.

Solapur also includes the Union Agriculture Minister’s parliamentary constituency Madha. This chronically drought-prone district, with average annual rainfall of 550 mm, is the largest sugarcane producer in Maharashtra with the densest concentration of sugar factories and area under sugarcane . That such water intensive cropping pattern in an arid region should flourish in Union Minister of Agriculture Sharad Pawar’s constituency speaks volumes about the political backing for sugarcane and the attitude of the Ministry.Image

During a meeting at the Ministry of Environment and Forests (MoEF), officials from the Water Resource Department (WRD) claimed that of the 87 TMC (Thousand million cubic feet) live storage of Ujani, 50-60 TMC is flow irrigation to sugarcane in command, accounting for more than 60% of its live storage. The authorised use, however, is only 32 TMC! In addition, there are several sugar factories in the upstream of the Ujani dam, taking water through unauthorised lifts from the backwaters. So, actual water going to sugarcane from Ujani is estimated to be close to 80% or more. This is causing severe water scarcity in the downstream regions, creating severe drinking water crisis.

All of this diversion apparently happens with political support. Of the 30 cabinet ministers in Maharashtra, 13 ministers either own sugar factories, or a substantial share in these. The White Paper on Irrigation Projects proudly boasts that the Ujani Project irrigates 92000 hectares of Sugarcane.

Apart from Ujani, Pune region (Districts Satara, Solapur and Pune), Ahmednagar Region, Aurangabad region and Nanded region, – all of them drought-prone areas – also have a dense concentration of sugar factories, aided by irrigated sugarcane fields in the vicinity.

Sugarcane is increasing in area in drought affected Krishna and Godavari Basins too, commanding maximum share of the irrigation water. This is borne out by the table below, all figures taken from the Maharashtra Irrigation Status report 2009-10 (the latest one available).

Area under main crops in thousand hectares
(canals, groundwater and rivers) ISR 2009-10
Region Jowar Wheat Ground nut Harbhara Rice Oilseed Sugar-cane Cotton Fruits
Pune 221.43 191.85 38.68 52.85 96.96 61.58 315.97 5.77 13.80
Aurangabad 29.38 33.33 5.07 12.68 0.08 2.30 43.30 27.83 5.48

Sugarcane: Lifeline of the political economy of Maharashtra

A Memorandum for Drought Relief sent to the centre from Maharashtra in 2003-04 said that Sugarcane is the “Lifeline of the agro economy of Maharashtra”. However, more than a lifeline of the agro-economy, it appears to be so for the political economy of Maharashtra. Hugely entrenched in sugar politics, the political economy is unable to take any brave and sustainable decisions when it comes to cultivating sugarcane. As experts have pointed out in the past, entire water management of Maharashtra revolves around sugarcane.

The Ujani Dam, sanctioned in 1964 for 40 Crores is still not complete, while the expenses have been pegged at nearly 2000 Crores. Even as the main canal work is incomplete, more and more lift irrigation schemes, link canals, underground tunnels are being planned on this dam, for sugarcane. Incomplete projects, with bad distribution network, which has been the hallmark of the irrigation scam, has aided sugarcane cultivation the most and has resulted in concentration of water in small ‘pockets of prosperity’ amidst drought affected zones and thirsty tail-enders.

Osmanabad collector K.M. Nagzode had written to the state sugar commissioner on 29 November 2012 that Osmanabad “had received only 50% of average rainfall, and water levels in dams are extremely low while ground water hasn’t been replenished and that since a sugar factory typically uses at least one lakh litres of water a day, it would be advisable to suspend crushing and divert the harvest to neighbouring districts”. However, no such orders were given and cane crushing went on. Osmanabad district contributes significantly to sugar production of Maharashtra, with over 25100 hectares of sugarcane, which is the only crop that gets irrigation in this district.

District Collectors have the right to reserve water for drinking in any major, medium and minor projects, when they see the need. However, even when Ujani was reaching zero live storage, such decision was not taken by the Solapur Collector.

Everybody loves a good drought

A Memorandum for drought relief sent by the Maharashtra government to the Centre does not seem to be in the public domain, but the state is reportedly seeking Rs 2500 crore for drought relief. The Memorandum for drought relief, 2003-04 shows that during every drought, we indulge in the same fire- fighting measures of resorting to the Employment Guarantee Scheme, tanker water supply, cattle camps and well-control. Once the drought passes, sugarcane is pushed again.

Currently 3 million farmers and significant number of labourers are involved in sugarcane farming, it is claimed. In reality, even if a million hectares were to be under sugarcane, how can 3 million farmers be involved in sugarcane farming when the average farm size in Maharashtra is 1.45 hectares?

We have neither been able to solve the minimum price for sugarcane lock till now. Farmers have been demanding Rs 4500 per tonne of sugarcane from sugar industries, which have agreed to only Rs 2300/ tonne. In Vidarbha, the situation is even worse with prices at Rs 1500/ tonne. The government has made it clear that it will not interfere in the issue. Many sugar industries did not even pay last year’s dues to farmers. Globally and in Indian markets, sugar prices are going down. Last November, during farmers’ protests for minimum price for sugarcane, two farmers lost their lives. This protest was the strongest in the drought hit region around Ujani Dam.

Instead of hiding behind claims of three million sugarcane farmers, politicians need to ensure that these farmers do not have to suffer the same fate time and again. With climate change, droughts have become a more frequent reality. The only way to tackle and manage droughts is to improve the resilience of the agro-economic system and water management systems in coping with droughts. Encouraging and pushing for sugarcane in chronically drought-affected areas is a poor adaptation measure and only pushes farmers deeper into the vicious cycle of uncertainty, crop failures, and hardships.

Drip Irrigation: A Band-aid solution?

The Maharashtra state government is planning to make it mandatory for sugarcane growers to use drip irrigation systems over the next three years, a move prompted by the drought. “Hence a regulation will make a big difference in the water utilization pattern in the agro-sector,” chief minister, Prithviraj Chavan said in an interview.

Measures like drip Irrigation, sprinkler irrigation, etc, though critical, are incapable of arresting the proliferation of sugarcane, a fundamentally inappropriate crop in drought prone areas. Moreover, despite the relative abundance of sugarcane and heavy subsidies for drip, sugarcane belts have stuck to flood irrigation and have not adopted drip the way Nashik region has for grapes. Of the one million hectares under sugarcane, barely 10% is under drip. Even the Union Agriculture Minister’s constituency has not shown any notable success on this front.

Image

As sugarcane is claiming almost all of irrigation and also domestic water from dams in the drought-affected zones, villagers in Marathwada and Western Maharashtra do not have drinking water; students are missing their exams to attend to cattle at cattle shelters and hospitals have to postpone surgeries for want of water. If at all Maharashtra wants to liberate itself from the shackle of regular droughts, one of the things it must first do is break free from sugarcane, and politicians who push the mirage of sugarcane in the absence of any sustainable efforts towards improving farm livelihoods.

This drought would not have been so severe if Maharashtra had broken the shackles of sugar earlier.

Parineeta Dandekar 
14 March 2013

Parineeta Dandekar is with the South Asia Network on Dams, Rivers and People.

References and Links

  1. Bharat Patankar, Asserting the Rights of the Toiling Peasantry for Water Use, IWRM in India
  2. Irrigation Status Report 2009-10, Maharashtra Water Resources Department
  3. 64th Meeting of the Expert Appraisal committee on River Valley and Hydropower projects: TOR for Shirapur Lift Irrigation Scheme
  4. Revised Memorandum to the Government of India on Drought Relief and Mitigation in Maharashtra (2003-04)
  5. Agriculture Statistics at a Glance 2012, Ministry of Agriculturehttp://eands.dacnet.nic.in/Publication12-12-2012/Agriculture_at_a_Glance 2012/Pages85-136.pdf
  6. http://www.jains.com/Company/bhj/2agriculture in maharashtra.htm
  7. http://www.vsisugar.com/india/statistics/maharashtra-sugar-industry.htm
  8. http://www.hindustantimes.com/India-news/Mumbai/Maharashtra-set-to-face-worst-drought-ever/Article1-1021808.aspx
  9. http://www.livemint.com/Politics/tBAf2SQJDHNzcmRGmlifsM/Suspend-cane-crushing-in-11-factories–Osmanabad-DM.html
  10. http://agricoop.nic.in/Agriculture Contingency Plan/Maharastra/Maharashtra 30-Osmanabad- 31-12-2011.pdf
  11. http://www.thehindu.com/news/states/other-states/in-western-maharashtra-cane-farmers-protest-turns-violent-2-die/article4091037.ece
  12. http://www.livemint.com/Politics/xZBeoQVgOMFZiFwmJWtHBL/Maharashtra-govt-to-tackle-water-shortage-with-drip-irrigati.html
Dams

Impact of 98 Mini Hydel Projects on Cauvery on Bangalore’s Water Supply

In recent news reports, it was reported that “following the drastic fall in the water-level in the Shiva Balancing Reservoir (SBR), the Bangalore Water Supply and Sewerage Board (BWSSB) has asked Karnataka Power Transmission Corporation Ltd. (KPTCL) and Karnataka Power Corporation Ltd. (KPCL) to stop power generation from four mini-hydroelectric projects in the Cauvery basin, at least till May.”[1] The projects which were asked to stop generation include: Madhavamantri, Satyagala, Shiva Anecut and Shimsha mini-hydroelectric projects.Image

However, the fact is that KREDL (Karnataka Renewable Energy Development Limited) has allotted and commissioned a whopping 98 mini hydel projects on the Cauvery, most of them downstream Krishnaraj Sagar Dam, many of them commissioned. These projects are in the Mysore, Mandya and Chamrajanagara Districts. Actual numbers maybe higher as we have not included projects from Ramanagara in the list as we are not certain how many of those would fall in Cauvery Basin.

24 Projects are in Mysore, 62 in Mandya and 12 in Chamrajanagar.

See Annex 1 for the full list with their status (Only projects from Mandya in the Annex, contact us if you need the full list)

Some of these projects are downstream from the Shiva Anicut from where water supply to Bangalore is routed. In addition to decrease in water availability, water stored by several mini hydel projects increases the evapo-transpiration rate of water, particularly in summer.

Critically, these projects also hold back water, affecting water supply cycles to Bangalore and other towns and villages dependent on the river. Similar conditions had occurred in Mangalore, last year where water levels in the Thumbe Dam fell to alarming levels due to mini hydel projects hoarding up water in the upstream.[2]

In Cauvery, if at all the state government, BWSSB and others concerned about impact of water supply due to mini hydel projects, they need to consider the impact of these projects on the water supply, ecology and livelihoods in the downstream areas and consider halting generation of these projects during this summer when the Cauvery basin is facing sure dire water situation. Mini Hydel Projects which are below the capacity of 25 MW do not need Environmental Clearance, Environment Impact Assessment or Public Hearing. String of Mini Hydel projects on a single river, one after the other, severely affects the hydrology as well as ecology of a river system and also people and their livelihoods in surrounding areas. The same is happening with Cauvery with nearly 100 Mini Hydel projects planned or commissioned. Many projects are right next to the Cauvery Wildlife Sanctuary and are causing impediment to movement of elephants, increasing man-animal conflicts. This has been highlighted by the Karnataka Elephant Task Force.  Due to their cumulative impacts on ecology, High Court of Karnataka has halted construction of any such projects in Western Ghats.

Hence, keeping water supply, hydrology and ecology in view, project level and cumulative impact assessment of mini hydel projects planned, allotted and commissioned along the River Cauvery is an urgent need. Earlier such appeals to KREDL, Karnataka Forest Department and Karnataka Wildlife Board have fallen on deaf ears.

We hope that the Karnataka government, BWSSB, KPCL, KREDL, KPTCL, Cauvery Neeravari Nigam and all others concerned will come together and will conduct this assessment urgently and cancel the projects which are having unacceptable impacts on people, ecology, hydrology and water supply of Cauvery. Immediately, an assessment of their impact is required in the context of summer and dire water situation.

On the International Day of Action for Rivers, Cauvery needs our urgent attention. Cumulative impact Assessment and individual Impact Assessment of unprecendeted number of Mini Hydel Projects is a must.

Nisarg Prakash, Nityata Foundation, Bangalore, nisargprakash@gmail.com

Dr. Latha Anantha, River Research Centre, Kerala, rrckerala@gmail.com

Parineeta Dandekar, South Asia Network on Dams, Rivers and People (SANDRP) parineeta.dandekar@gmail.com

09860030742

(Scroll Down for a list of Commissioned and Allotted Mini Hydel Projects on Cauvery in Mandya District alone)


Annexure 1

Small Hydro Projects in mandya District on Cauvery in Karnataka. Please contact us if you need full list of 98 projects including those in Mysore and Chamrajanagara.

(Source: Karnataka Renewable Energy Development Limited, KREDL: http://www.kredltest.in/Hydroreportall.aspx)

 No. Company Company MHS Status Capacity (MW)
1 ADD Realty Ltd. New 3
2 Aparimitha Power Ventures Pvt. Ltd. Aparimitha Kuppahalli MHS Allotted 4
3 Atria Brindavan Power Ltd. Atria Hanumanahalla Commissioned 8
4 Atria Brindavan Power Ltd. Atria Brindavan Allotted 12
5 Atria Brindavan Power Ltd. Atria Visveswara Commissioned 12
6 Atria Brindavan Power Ltd. Atria KRS Commissioned 4
7 Atria Hydel Power Ltd. Atria Sheshadri Iyer Allotted 10
8 Atria Hydel Power Ltd. Atria Sheshadri Iyer II Commissioned 12
9 Atria Power Corpn. Ltd. Atria Shimsha New 24
10 Atria Power Corpn. Ltd. Atria Yelachagere MHS Allotted 5
11 B & G Energy Pvt. Ltd. B&G Allotted 3
12 B Soilmec India Pvt. Ltd. B Soilmec Hasurubore Halla Allotted 20
13 B Soilmec India Pvt. Ltd. B Soilmec Someshwara II Commissioned 15
14 Bhoruka Power Corpn. Ltd. Bhoruka Mandagere Commissioned 4.5
16 Cauvery Hydro Energy Ltd. Cauvery Shiva Commissioned 3
17 Cauvery Hydro Energy Ltd. Cauvery Akkihebbal Allotted 4.5
18 Energica Power Co. NULL Alugodu Commissioned 0.8
19 Graphite India Ltd. Graphite India Allotted 1.5
20 Hallikeshwara Energy Projects Pvt. Ltd. NULL NULL Allotted 0.5
21 IJK Power Pvt. Ltd. NULL Ganadahalli Allotted 15
22 Innoverse Eco Friendly Solutions Innoverse Thimmana hosur Allotted 0.4
23 Instrument & Systems NULL Banasamudra Allotted 1
24 Kaltronics Office Automation & Networking Pvt. Ltd. Parpikala Mahadevapura Commissioned 0.5
25 Kilara Power Pvt. Ltd. NULL NULL Commissioned 2
26 Limbavali Power Pvt. Ltd. Limbavali Hullahhalla Commissioned 12
27 LK Power Corpn. Ltd. LK Maddur Branch Canal Allotted 2
28 Manasa Gangothri Power Pvt. Ltd. New 3
29 ME Power Gen Project NULL Shree Lakshmi Narashimhaswamy Allotted 3
30 Mythree Power Developers Mythree Sampaji Allotted 0.25
31 Nimishamba Energy India Pvt. Ltd. Nimishamba Nimishamba New 3
32 Obull Power Projects Pvt. Ltd. Obull Sagya New 2
33 Obull Power Projects Pvt. Ltd. Obull Chillapura Allotted 2
34 P6 Energy Pvt. Ltd. KCP Ballenahalli New 2
35 Paramount Estate Pvt. Ltd. Ramapura New 1
36 Paramount Estate Pvt. Ltd. chaluve Allotted 1
37 Parpikala Power Pvt. Ltd. Parpikala Viraja Allotted 0.5
38 Parpikala Power Pvt. Ltd. Parpikala Sithapura Allotted 0.5
39 Penna Cements Industries Ltd. Pioneer Genco Sreeramadevara Allotted 24.75
40 Photon Energy Systems Ltd. Photon Hosaholalu Commissioned 0.5
41 Pioneer Genco Ltd. Pioneer Genco Someshwara Allotted 24.75
42 Samrudhi Hydro Energy NULL KRS Allotted 1.22
43 SLS Power Industries Ltd. Bhoruka Belakavadi Allotted 1.5
44 SM Hydro Power Pvt. Ltd. SM NULL Allotted 10
45 Soham Renewable Energy India Pvt. Ltd. Soham Mahadevapura-2 Allotted 6
46 Sree Mallikarjuna Power NULL Maddur Allotted 0.95
47 Sri Rama Enterprises Rama Doddrasinakere Allotted 0.5
48 Sri Rama Enterprises Rama Chikkarsinakere Allotted 0.5
49 Sriven Power Pvt. Ltd. NULL Heggadahalli Allotted 5
50 Subhash Kabini Power Corpn. Pvt. Ltd. SPML Varuna RBC Allotted 2
51 Subhash Kabini Power Corpn. Pvt. Ltd. SPML Hulikere New 3
52 Trinity Aero & Energy Formulations Pvt Ltd NULL Mosarahalla (Katteri Nala) Commissioned 0.25
53 Trishul Power Pvt. Ltd. Trishul Hemagir Allotted 4
54 V.Pram Power Co. Pvt. Ltd. NULL Devaraya Allotted 0.5
55 Venika Green Power Pvt. Ltd. XS Chikka Commissioned 24.75
56 Venika Green Power Pvt. Ltd. XS Malligere Commissioned 0.75
57 Vijayalakshmi Hydro Power P Ltd (2) NULL Hebbakavadi Commissioned 1.75
58 Vijayalakshmi Hydro Power P Ltd (3) Hebbakavadi Allotted 1.25
59 West Mountain Power Ltd. West Mountain Shimsha Kaveri Confluence SHP Allotted 24
60 XS Hydro Energy Pvt. Ltd. XS Commissioned 24.75
61 Yuken India Ltd. Attigala Allotted 0.35
62 Zen Power Pvt. Ltd. KGK Paschim vahini  Allotted 0.5
 TOTAL  361.47 MW
Cumulative Impact Assessment

The End of The River

The Video site says this about the video: Published on Nov 6, 2012
European rivers are negatively impacted by thousands of hydropower installations and barrages, with many more to come if the power industry has it their way. Energy produced by hydropower installations is per definition “renewable” energy – but “green” or “clean” it is certainly not. This film is produced to inform about the hydropowers devastating impact on our rivers and the life in them.

Length: 29 min 6 secs
Language versions available: EN, DE, FR. Film produced for: the European Anglers Alliance, and the European Fishing Tackle Trade Association. Directed and written by: James G. Beaulieu
Produced by: Dr. Stefan Spahn and James G. Beaulieu”

COMMENT: This is an excellent video indeed, visuals showing the devastating impact that hydropower projects can do to the river, the fish and the biodiversity across the river and also in turn on the people (though it does not have as much about the social impacts as one would like and as would be applicable in a country like India). It also shows the adverse impacts of the peaking mode of generation and also shows that even in a temperate country like Germany,the hydropower reservoirs can be a source of methane, a gas having 21 times more impact on global warming compared to carbon dioxide. It mentions how fish ladders and fish passages are hardly effective.

HOWEVER, it seems to privilege big hydro project as against small hydro and even micro hydro projects (the commentary mentions projects as small as 20 Kilo watts) over large hydro, seeming to say that the impact of smaller projects on fish (impact hydropower projects on fish seems to be focal point of the video, not the river as the title says) compared to large hydro and actually advocates moratorium on small hydro and also decommissioning of small hydro (as Denmark seems to have done, as shown in the video).

That message may not be as much relevant for a country like India where such micro projects are the only ones that can provide electricity to the communities that do not have them and when such micro projects are the only ones that can be taken up in a participatory way for the benefit of the local communities and where impacts are easier to understand and accept.

Otherwise this is an educative video for all those concerned about the impact of hydropower projects on the river and its biodiversity, particularly fish. This is particularly relevant for India in the context of the social angle and hence is particularly important with reference to larger hydropower projects.

Comments welcome.

Hydropower · Ministry of Environment and Forests

Central Water Commission’s Dam Register: How much do we know about our dams and rivers?


Image

Central Water Commission is India’s technical organisation under the Union Ministry of Water Resources. It publishes National Register of Large Dams (NRLD), the latest version can be seen at: http://www.cwc.nic.in/main/downloads/New%20NRLD.pdf. This is a key document that provides information about large dams in India.

The latest NRLD seems to have been uploaded only this month, since for a number of states, it claims to have been updated till January 2013. The NRLD is certainly a useful document, the only list of large dams in India and it also gives a number of salient features of the large dams in India. SANDRP has been using this document and also been doing some analysis of the information available in the NRLD.

As per the latest edition, India has 5187 large dams (height above 15 m in most cases, height of 10-15 m case of some with additional criteria). 371 of these dams are under construction and rest have been completed. In case of 194 large dams in NRLD, we do not know the year of construction, which means most of such dams must have been built before independence.

NRLD is not an exhaustive list

NRLD follows the definition of large dams given by the International Commission on Large Dams for inclusion of dams in the NRLD. However, the NRLD is far from exhaustive list of large dams in India. Very significant number of large dams built for hydropower projects in Himachal Pradesh, Uttarakhand, North East India, among other states, do not figure in the list, even though all of these would come under the definition of large dams as given in the NRLD. To illustrate from Himachal Pradesh, following dams are all under construction as per Central Electricity Authority, many of them in advance stages, but they do not figure in NRLD: Allain Duhangan, Kashang, Sainj, Swara Kuddu, Shongtong Karcham, Sorang, Tangnu Romai, Tidong. It’s a dangerous situation for safety issues, since many of them are under construction by private companies. For example, in December 2012 heavy leakage was detected in the surge shaft of the 1000 MW Karcham Wangtoo Project on Sutlej River in Kinnaur district in Himachal Pradesh. The project had to be shut down and the repairs are still going on. Had there been a serious mishap at the project the impact would be also felt by the cascade of projects downstream, including the 1500 MW Nathpa Jakhri HEP (India’s largest operating hydropower project), 412 MW Rampur HEP, 800 MW Kol Dam HEP and the Bhakra complex further downstream.

The case of missing dams

Earlier in 2010 and 2011 we filed a number of applications with the CWC under the Right to Information Act to ask them how a very large number of dams that were listed in earlier NRLD of 1990, 2002 (both printed versions) did not figure in the NRLD 2009 and many of the large dams listed in 1990 also did not figure in NRLD 2002. The CWC response in most cases was to transfer our RTI application to the relevant states, stating that CWC is not responsible for the information in the NRLD, it only compiles the information given by the respective states.

This was far from satisfactory response from India’s premier technical water resources organisation. Was CWC acting only as a post box on even such a serious issue of listing of large dams? It was not applying its mind to the information supplied by the states, not raising any questions, nor clarifying the contradictions and gaps with respect to the earlier editions of NRLD? Needless to add, this reflects very poorly on the CWC. Here it should be added that CWC is also responsible for the monitoring policies and practices related to the safety of dams in India as also a number of other aspects. What kind of diligence can we expect from CWC under these circumstances? Our analysis then also showed that many dams that should have figured in the earlier versions (considering the date of completion stated in the subsequent editions of NRLD) were not there. Again our RTI applications in such cases were transferred to respective states. We did get some response from Central Water Commission and Maharashtra, which was far from satisfactory. In case of over a hundred dams, the CWC Director, Design and Research Coordination Directorate accepted the errors in NRLD and promised that “Data entry errors/ omissions as indicated above will be rectified”.

Where are our dams located?

A quick review of the latest NRLD raises some fresh questions of the NRLD. In this exercise we just wanted to check how many dams are there in different river basins/ sub basins. This is an important question from a number of perspectives including cumulative impacts, optimisation of dam operations, hydrological carrying capacity and cumulative dam safety issues, to name a few. We through this would be simple enough exercise. But when we started looking at the 5187 large dams of India listed in NRLD, we found that in most cases, there is no name for the river on which the dam is constructed. When counted, we were shocked that in case of 2687 or 51.8% of large dams of India, the NRLD does not mention the name of the river. In most cases they just write “local river” or “local Nallah” or the box under river is left blank. Under the circumstances, it is not possible to get a clear picture of any river basin, nor about the cumulative impacts or safety aspects or possibility of optimisation of the dams in any one river basin. The absence of such basic information reflects very poorly on the quality of NRLD, and on the CWC and respective states.

Worst states

India’s largest dam builder state, namely Maharashtra, has the largest number of dams for which it does not know the name or location of the rivers or tributaries. Out of 1845 large dams in Maharashtra, in case of 1243 dams, Maharashtra does not know the name of the rivers! That means in case of 67.37% of its dams, Maharashtra does not even know the names of the rivers. It is not just for the old dams, but even for 81 of the dams completed after 2000, Maharashtra does not know the names of the rivers. Even for relatively larger 61.19 m high Berdewadi dam (completed in 2001) and 48 m high Tarandale dam (completed in 2007), the names of the rivers are now known.

Madhya Pradesh is worse than Maharashtra, it does not know the names of the rivers for 90.17% of its dams (817 dams out of total of 906). In percentage terms, Chhattisgarh is worst as it does not know names of the rivers for 227 of its 259 large dams. These three states of Maharashtra, Madhya Pradesh and Chhattisgarh collectively do not know the names of the rivers for 2287 of dams in NRLD. Some of the other states that should also share the “honours” here are Gujarat (138 dams out of 666 for which names of rivers are not known), Andhra Pradesh (124 out of total of 337) and Rajasthan (71 out of 211 large dams).

It is a disturbing situation that the agencies that are responsible for our large dams do not even know the names of the rivers (every river in India has a name, so if someone were to argue that the rivers do not have names, it won’t be acceptable excuse) on which they are located. Without the names of the rivers and locations of the various dams on specific rivers, we cannot even start looking at the crucial issues like dam safety, cumulative social and environmental impacts, hydrological carrying capacity and optimum utilisation of the storages created behind the dams. We clearly have far to go to even start knowing our dams and rivers.

Himanshu Thakkar (ht.sandrp@gmail.com)

South Asia Network on Dams, Rivers & People (www.sandrp.in, an edited version of this published at: http://indiatogether.org/2013/mar/env-dams.htm