
According to a new report, the largest climate induced displacement in the world for the year 2012 happened

in two states of Northeast India, Assam and Arunachal Pradesh in June 2012 due to the monsoon floods which displaced 6.9 million people, constituting about 21.2% of the population of the two states[1]. This staggering fact was revealed in the report named “Global Estimates 2012 – People Displaced by Disasters” published by The Internal Displacement Monitoring Centre (IDMC) based in Geneva, Switzerland in May 2013. More people were displaced in India by natural disasters last year than in any other country, says the report. A closer scrutiny shows that the figure seems highly exaggerated, raising question mark over the accuracy of the work of IDMC and Norwegian Refugee Council (NRC), who jointly published the report.
IDMC is an international body monitoring internal displacement worldwide. This was established in 1998 by the NRC. IDMC defines displacement as a non volunteer nature of movement. People who are compelled to evacuate their homes in order to avoid the impacts or the threat of a disaster will come under this definition. But from this definition it is also clear that those people who are affected by any disaster but have not evacuated their place living will not be defined as displaced. IDMC states that majority of people who face displacement are internally displaced people (IDPs).[2]
Displacement by type of related hazard, 2012 and 2008-2012
|
Total displaced |
||
| Type of hazard |
2012 |
2008-12 |
| Flood |
22,010,000 |
89,181,000 |
| Storm/ Typhoon |
9,603,100[3] |
29,051,000 |
| Earthquake(Seismic activity) |
637,000 |
23,604,000 |
| Extreme Cold |
2,000 |
923,000 |
| Landslide(wet) |
47,000 |
577,000 |
| Volcano |
40,000 |
472,000 |
| Wildfire |
59,000 |
103,000 |
| Landslide (dry) |
200 |
3,200 |
| Extreme Heat |
1,700 |
1,700 |
| TOTAL |
32 400 000 |
143 900 000 |
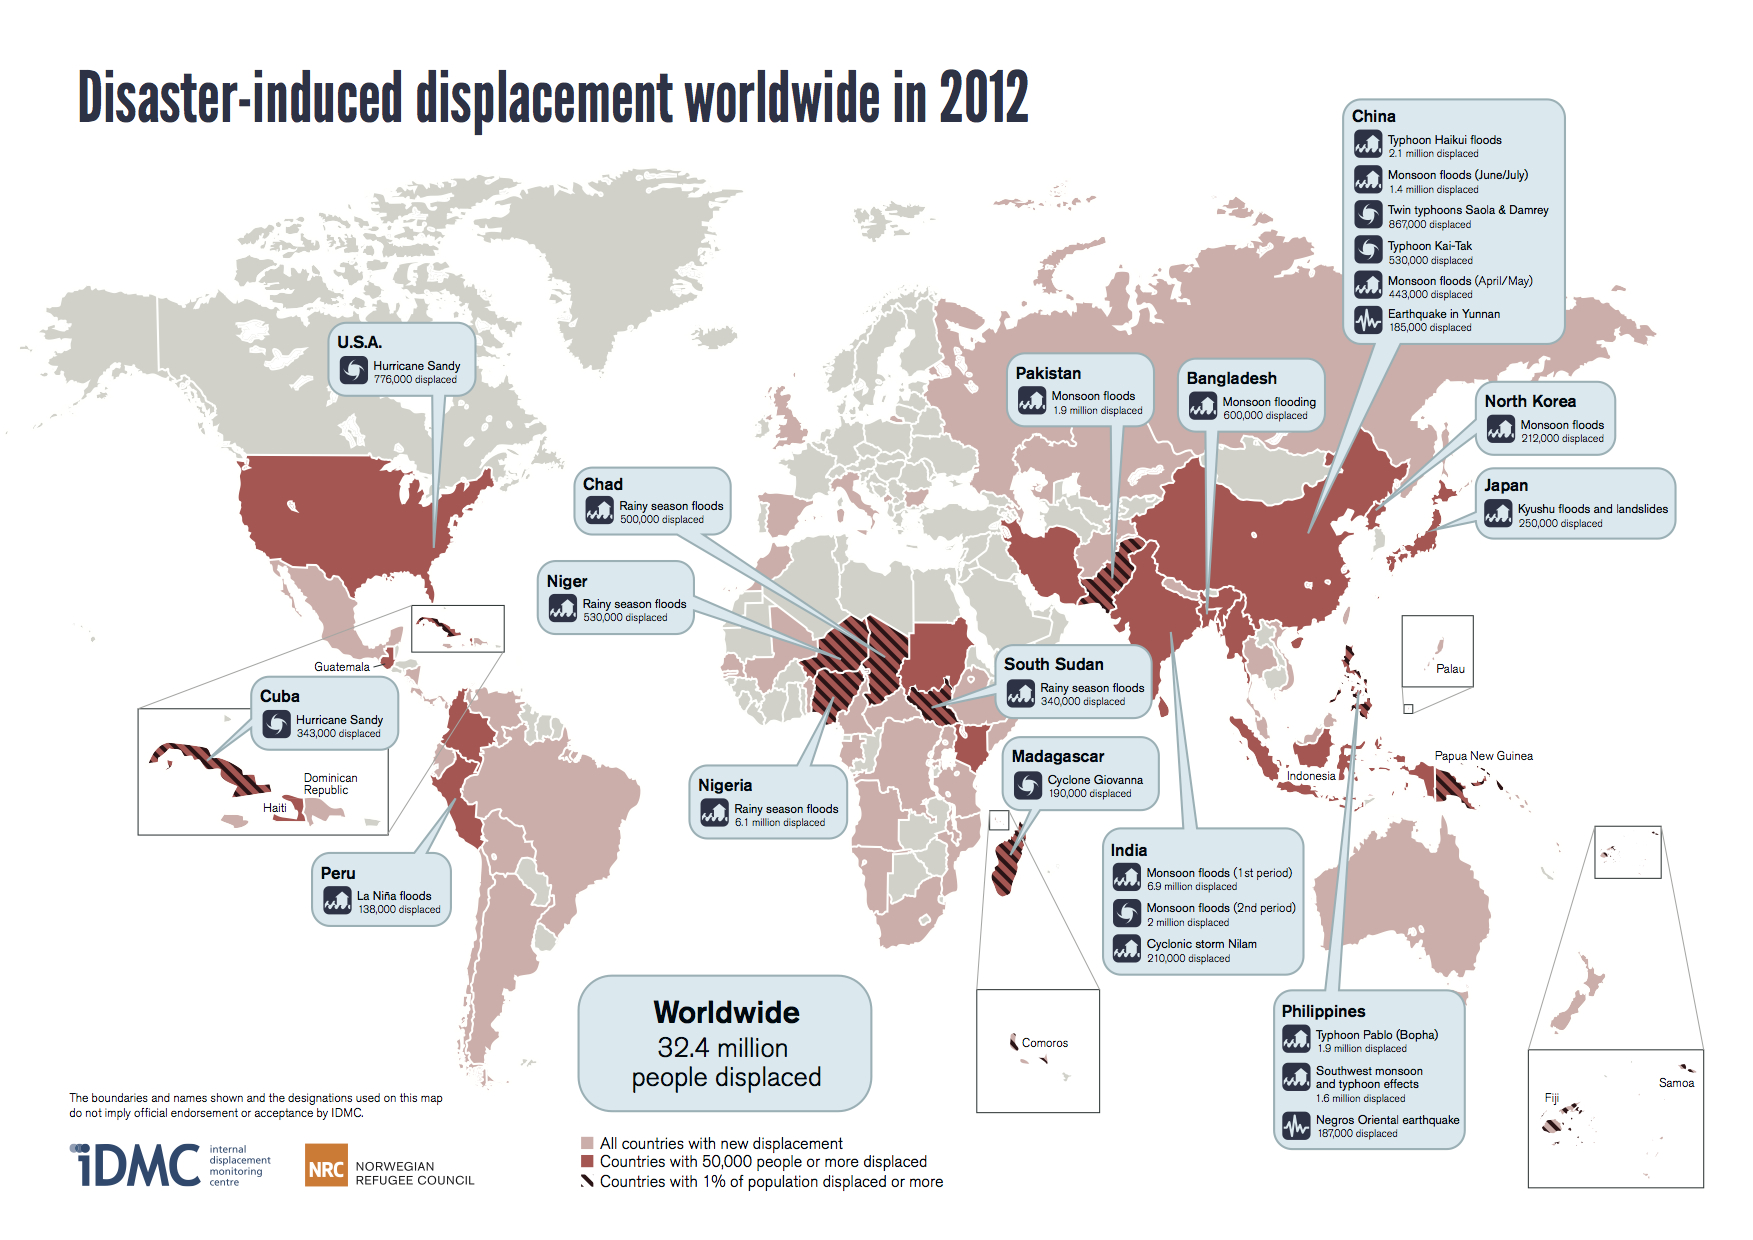
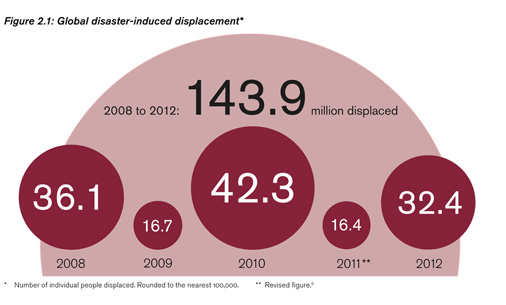
This report states that in 2012, an estimated 32.4 million people in 82 countries were newly displaced by disasters associated with natural hazard events. Over five years from 2008 to 2012, around 144 million people were forced from their homes in 125 countries. The majority of this displacement (98% in 2012 and 83% over five years) occurred due to climate and weather related hazards which include floods, storm, etc.
Source: http://idmcnrc.files.wordpress.com/2013/05/world-map-global-estimates-2012.jpg
In the year 2012, twenty disaster-induced displacement events were recorded, which were induced by flood and storm related disasters. Out of these, fourteen happened in Asia which includes the mass displacement in India, China and Philippines. Large scale flood displacements also happened in African countries of Nigeria, Chad, Niger and South Sudan. In fact the Nigerian floods also displaced over six million people. Hurricane Sandy brought the disaster for the west which rendered 775,000 people homeless in America and 343,000 people in Cuba.
Why Disaster Induced Displacements are Increasing The report says that related and interconnected global changes like population growth, rapid urbanisation and the exposure of vulnerable communities, homes and livelihoods to hazards will increase the risk of global disasters. Even though increasing use of life saving drugs have brought down mortality rate related with weather related hazards, number of disaster survivors getting displaced will not decrease.
Source: http://www.nrc.no/?did=9675023
The analysis done in the report shows that disaster induced displacement takes a toll on both high income and low income countries. However, it is the middle and low income countries where majority of the people were displaced. The report states that for the year 2012, 96.09% of disaster induced displacement happened in the middle and low income countries, whereas for the period of 2008-2012 it was 98.27%. The report also identifies that the South Asia region had the highest disaster related displacement (36.4%) for the year 2012. From 2008 to 2012, the highest disaster induced displacements have happened in China (49,782,000) which is followed by India (23,775,000) and Pakistan (14,991,000).
Risk of the Unseen – Climate Change The impact of climate change on disaster induced displacement has been emphasized in the report. The report states that climate change is an important concern which will impact extreme weather events which could lead to more displacement. Intergovernmental Panel on Climate Change (IPCC) published a report in March 2012, Managing the Risks of Extreme Events and Disasters to Advance Climate Change Adaptation (SREX) in which relationship between extreme weather or climate events (“climate extremes”) and displacement has been acknowledged, “Although data on climate change-forced displacement is incomplete, it is clear that the many outcomes of climate change processes will be seen and felt as disasters by the affected populations. For people affected by disasters, subsequent displacement and resettlement often constitute a second disaster in their lives.”[4] Evidence suggests that climate extremes are becoming more and more unpredictable due to the impact of climate change which has changed the frequency and magnitude of these climate extremes. This could be very serious issue considering the impact climate extremes can have on displacement. The report however fails to point out that while high income countries have been responsible for the climate change to the greatest extent, the impacts of their emissions are being felt by the poorest people in the low income countries and middle income countries.
Displacement in Northeast The report says that that around 900,000 people were evacuated in Arunachal Pradesh in June-July 2012; two thirds of the state’s population. In Assam, the report says, quoting Central Water Commission that as many as six million, 20 per cent of the state’s population, were forced to flee by rising waters. It says, officials claimed the 2012 floods were the worst since 2004 when eight times more houses were recorded as damaged than in an average year.
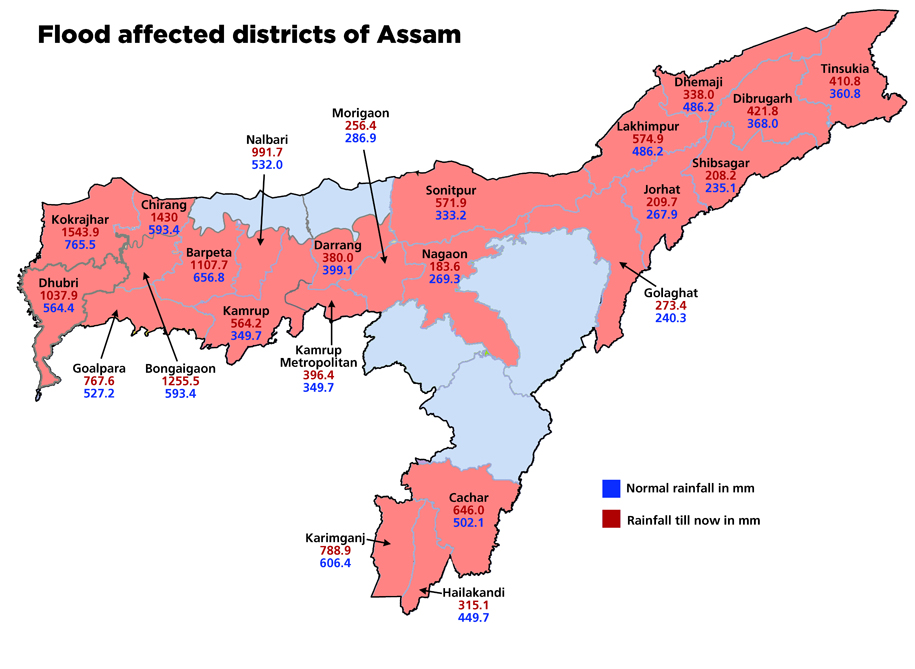
Rainfall in June 2012 does not corroborate IDMC claims – Monsoon rain is the reason for the floods in June 2012. The table below presents the rainfall figures of Assam and Arunachal Pradesh during June 2012.
| 1-13 June | 14-20 June | 21-27 June | 28 June – 4 July | |
| Arunachal Pradesh | 191.6 (+1%) | 64.1 (-47.1%) | 249 (+78%) | 66.2 (-51%) |
| Assam & Meghalaya | 189.4 (-3.5%) | 123.7 (-9%) | 251.8 (+105%) | 65.2 (-51%) |
Note: Rainfall in mm, figures in bracket indicate the % departure from Normal, all figures from weekly and seasonal rainfall maps of India Meteorological department.
It is clear from the above table that rainfall in June 2012 in Assam and Arunachal Pradesh was normal or below normal in all weeks except during June 21-27, 2012. Even the excess rain in this period is not too high to cause unprecedented flood displacement. This raises some doubt about the figures in the IDMC report.
Source: http://www.downtoearth.org.in/content/assam-arunachal-pradesh-face-worst-ever-floods-recorded-june
Assam suffers annually from flood disasters. The havoc of floods paralyses the state for several months every year. International recognition of this problem is very important for the state. However, that seems to be some significant exaggeration in the figure of displacement in NE India due to floods in June 2012.
The total population Arunachal Pradesh is 1,382,611 according to 2011 census[5] and displacement of 900,000 people would mean displacement of massive 65% population of the state. But we could not find any report or news confirming displacement of this huge extent. There was news about floods in several districts in Arunachal Pradesh in June and July 2012, but none corroborated the displacement figure of 900,000. In fact displacement of 65% population of Arunachal Pradesh due to floods have never been heard of for even the worst ever floods in the state.
For Assam, the flood in June 2012 was recorded as the worst floods in last ten years. The flood in June 2012 was termed as unprecedented by Dr. Partha Jyoti Das, a senior researcher working on flood and environment related issues in Assam. He said that the flood occurred quite earlier than the previous years, i.e. in the first few weeks of June.[6] However we found it difficult to find any document corroborating the displacement figure of six million in Assam due to floods in June 2012.
On the National Disaster Management website of Government of India (http://ndmindia.nic.in/flood-2012/floods2012.htm) the highest number of people affected during the month of June and July was 1,992,727 (reported on 2nd July 2012). The highest number of people evacuated during this time was 383,421 (reported on 4th July 2012). The highest number of people found in the relief camps was 484,555 (reported on 15th July 2012). The Assam State Disaster Management Authority also corroborated this figure as the highest number of people reported in the relief camps during that period. Two tables providing extent of damage (cumulative figures) and rescue and relief (provisional) are given in Annexure1 and Annexure 2.
Figures from Oxfam India, one of the leading organizations providing flood relief in the state also validated the fact that the flood in June 2012 was unprecedented early flood and worst in last ten years. They maintained that due to this flood nearly 2.4 million people have been affected and half a million people have been displaced.[7] The IDMC report also refers to the information gathered from Sphere India and Inter Agency Group (IAG). We found that in a Joint Assessment Report of IAG Assam on Assam Flood 2012 (published on 6th July, 2012) the number of affected people was stated as 2,391,369 in 4,540 villages. In the same report 383,421 inmates were reported to be staying in 650 relief camps in 15 districts of the state.
We had written to IDMC (at the email address idmc@nrc.ch as provided in the document for any further information and referred documents) on June 13, 2013, for copies of the documents referred in end note 11 and in table A2.1, and also request to “provide any other report that provides details and support for the figure of 6.9 million people displaced by flood disaster in North East India in June July 2012”. Our email remains unanswered as we write this.
Dr. Arupjyoti Saikia, an environment historian working on northeast after seeing the report said that “I have no accurate estimate of the people being displaced. But equally the estimate provided by the IDMC seems little awkward. The numbers of people affected in AP is surely less for very natural reasons. Often IDMC reports are criticized for their over-reaction. Official figures matter a lot as this numbers help in procuring relief from the GOI as well as other agencies. I presume GOA reports will come closer to the truth.” Dr. Dulal Chandra Goswami, another senior scholar from northeast, said that the displacement figures for northeast, quoted in the report appear to be highly exaggerated. Dr. Partha Jyoti Das also expressed similar opinions saying that the figures mentioned in the IDMC report for northeast are overestimated. Many reporters may accept the figures in such reports uncritically and report them, which lead to spreading of wrong information. This was evident from the reports published in Down to Earth[8] and Thomson Reuters Foundation[9].
Moreover, displacement in Assam is not only induced by floods but also by erosion. The report does mention “Shelter needs were a primary humanitarian concern as the authorities encouraged IDPs to leave relief camps and return to water-logged villages, destroyed houses and eroded land”. But this is not completely correct as erosion leads to permanent displacement of people from their original land. Floods lead to inundation of a certain area for a period of time displacing people temporarily from their homes. But erosion displaces people permanently from their land. In displacements induced by floods the displaced people have the option of going back to their houses. Erosion leaves no option for that. People who get affected by erosion have to shift their homes before the actual erosion happens. In 2007 it was stated in the State Assembly that in 15 out of 23 districts in the state 40,414.98 bighas of land was lost due to erosion. 10,075 families have lost their houses due to erosion in that year. Many people who get displaced due to erosion opt to live on the side of the embankments in poor living conditions for years due to their inability to buy new land. They might not come to relief camp during floods which may result in their non-recognition in official displacement figures.
Such kind of reports also need to recognise clearly that among the disaster induced displacement, it is the poor people who are most at risk even in a fast growing country like India and climate change is making them even more vulnerable. Hence there is an urgent need to ensure that the climate action plans address the vulnerabilities of the poor. Unfortunately, Indian government’s National Action Plan on Climate Change (NAPCC) does not even recognise the vulnerable classes of people. In fact NAPCC increases the vulnerability of the poor, since it basically follows the business as usual development path.
This report by IDMC is an important initiative to document the plight of the people who face displacement due to the disasters. Recording and documentation of displacement is very important for policy formulation as well as for all related discussions and debates. The numbers presented are shocking but are clearly unsubstantiated and exaggerated. However exaggerated facts will also not lead to healthy policy formulation. Besides, factual inaccuracies may lead to questioning the credibility of such reports. We hope that IDMC will acknowledge these errors and bring more factual accuracy in their future reports. Such reports also need to highlight the issue of climate justice.
Parag Jyoti Saikia and Himanshu Thakkar
South Asia Network on Dams, Rivers & People (www.sandrp.in)
Email: ht.sandrp@gmail.com / meandering1800@gmail.com
Annexure 1: Extent of Damage (cumulative figures) (Provisional)
|
Name of States/ UTs |
Date when updated |
Population affected
|
No. of human lives lost |
No. of districts affected |
No. of villages affected |
No. of cattle/ Live- stock lost |
Cropped area affected (in ha) |
No. of houses damaged |
|
| Fully | Partially | ||||||||
| 15.06.12 | 13.06.2012 | – | – | 7 | 13 | – | 326 | – | – |
| 18.06.12 | 17.06.2012 | 66915 | – | 11 | 10 | – | 11783 | 07 | 02 |
| 28.06.12 | 27.06.2012 | 386762 | 14 | 19 | – | 23134.15 | 141 | 6592 | |
| 02.07.12 | 01.07.2012 | 1992727 | 81 | 27 | 1564 | – | 657558.07 | – | – |
| 03.07.12 | 02.07.2012 | 1233970 | 95 | 27 | 1543 | – | 657558.07 | – | – |
| 04.07.12 | 03.07.2012 | 916801 | 104 | 27 | 1281 | – | U/ Assesment | – | – |
| 15.07.12 | 14.07.2012 | 2391369 | 125 | 30 | 4540 | – | 2.55 | ||
| 19.07.12 | 18.07.2012 | 2391369 | 126 | 30 | 4540 | – | 2.55 | awaited | awaited |
| 24.07.12 | 23.07.2012 | 2391369 | 126 | 30 | 4540 | – | 2.55 | – | – |
| 31.07.12 | 23.07.2012 | 2391369 | 126 | 30 | 4540 | 0 | 2.55 | 0 | 0 |
Source: Flood Situation Report for June and July, 2012 available at http://ndmindia.nic.in/flood-2012/floods2012.htm
Annexure 2: Rescue and Relief (Provisional)
| Name of States/ UTs |
Date when updated |
No. of persons evacuated |
No. of relief camps opened |
No. of persons accommodated in the relief camps |
| 15.06.2012 |
– |
– |
– |
– |
| 18.06.2012 |
17.06.2012 |
245 |
27 |
14100 |
| 28.06.2012 |
27.06.2012 |
24647 |
187 |
175750 |
| 02.07.2012 |
01.07.2012 |
370265 |
622 |
439548 |
| 03.07.2012 |
02.07.2012 |
370265 |
551 |
255677 |
| 04.07.2012 |
03.07.2012 |
383421 |
650 |
255677 |
| 15.07.2012 |
14.07.2012 |
383421 |
622 |
484555 |
| 24.07.2012 |
23.07.2012 |
383421 |
622 |
484555 |
| 31.07.2012 |
23.07.2012 |
383421 |
622 |
484555 |
Source: Flood Situation Report for June and July, 2012 available at http://ndmindia.nic.in/flood-2012/floods2012.htm
[2] As defined by the 1998 Guiding Principles on Internal Displacement, internally displaced people (IDPs) are individuals or groups of people “who have been forced or obliged to flee or to leave their homes or places of
habitual residence […] and who have not crossed an internationally recognised state border.”
[3] This figure is clearly gross error. The total Disaster induced displacement in 2012 by all types of hazards is 32.4 million, so storm related disaster cannot displace 95.7 million people. We have used a corrected figure in the table here, based on total displacement subtracted by displacement by other (than storm) factors.
[4] SREX, p.80. Citing Oliver-Smith, 2009
[6] http://www.indiawaterportal.org/articles/assam-faces-worst-ever-floods-10-years-video-interview-dr-partha-j-das-programme-head-water


