Assam · Dam Induced Flood Disaster · Dams · Expert Appraisal Committee · Hydropower

Lower Kopili HEP: Oustanding issues that must be resolved before EAC can consider the project

The Lower Kopili Hydro Electric Project(HEP) will be considered for TOR clearance in the forthcoming Expert Appraisal Committee(EAC) meeting on September 23-24, 2013. This project was first discussed in the 63rd EAC meeting held on 12-13th October, 2012. It was again discussed in the 65th meeting of the EAC held on 26-27th December, 2012 for approval of Terms of Reference (TOR) for the Environmental Impact Assessment (EIA). EAC had sent back the project proposal seeking additional information/clarification on several issues. There were several critical issues which were not raised by the EAC. We have made a submission to EAC pointing out issues which need urgent attention.

Background of Hydroelectricity Generation on Kopili River

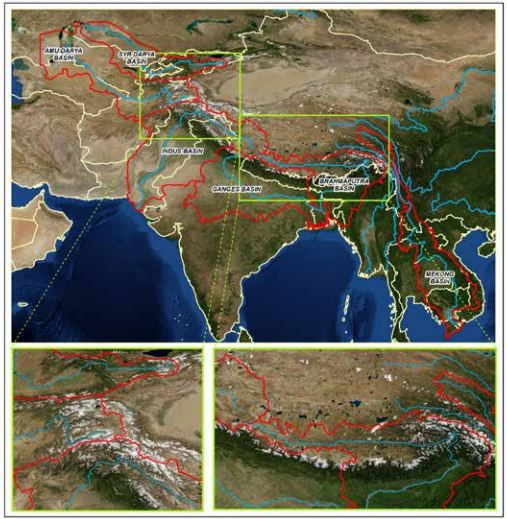
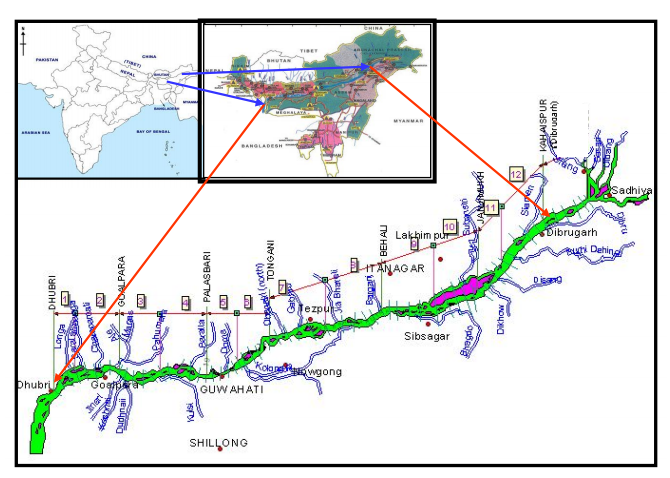
The Kopili River: Kopili is a south bank tributary of Brahmaputra which originates in the Borail range mountains in Meghalaya at an altitude of about 1600 m and has a total length of 290 km up to its confluence with Brahmaputra. Its basin is bound by the Jaintia Hills in the west and the South Cachar and Mikir Hills in the east. Kharkor, Myntriang, Dinar, Longsom, Amring, Umrong, Longku and Langkri are its major tributaries in its upper reaches.

After entering Assam the Kopili separates the Karbi Anglong district from the Dima Hasao North Cachar Hills district up to its confluence with Diyung River on its right at 135 km. After the confluence with Diyung, Kopili flows into the Nagaon district in a north-westerly direction. The Jamuna River with a catchment of 3960 km2 flows to the Kopili at Jamunamukh. The river then flows in western direction, and further downstream, the Umkhen-Borapani River which rises in the Shillong plateau and drains an area of 2038 km2 joins Kopili at a distance of 254 km from the left. The Killing River, known as Umiam in its upper reaches draining an area of about 1445 km2, flows into Kopili from the left at about 280 km. The Kopili River finally flows to Kalang, a spill channel of Brahmaputra, near Hatimukh after traversing a distance of 290 km2. The total catchment of Kopili River is about 16,421km2.

Kopili HEP: The Kopili Hydro Electric Project (HEP) has two dams, one on the Kopili River and one on its tributary Umrang stream. This project was developed by NEEPCO (Northeast Electric Power Corporation Ltd.). The first dam with 66 m height on the Kopli River is known as Khndong dam and the second one with 30 m height is known as Kopili dam located at Umranso.  Water from the Khandong reservoir is utilised in the Khandong power station through a 2852 m long tunnel to generate 50 MW (2 X 25 MW) of power. The tail water from this powerhouse is led to the Umrong reservoir. The water from Umrong reservoir is taken through a 5473 m long tunnel to the Kopili power station to generate 200 MW (4 X 50 MW) of power. An additional 25MW was added to the Khandong dam in the Stage two of the Kopili HEP, making the total power generation 275 MW. Both Khandong and Kopili dams are concrete gravity dams. The first unit of this Kopili HEP was commissioned in March 1984. Additional unit under stage two was commissioned in July, 2004.

Proposed Lower Kopili HEP: The proposed Lower Kopili HEP is coming up in Boro Longku village in Dima Hasao district. The project is developed by Assam Power Generation Corporation Limited (APGCL). The Lower Kopili dam will be a concrete gravity dam with 70.13 m high dam wall. This project will also have two power houses and the first power house, or the main power house will have an installed capacity of 110 MW (2X55MW). An auxiliary Power House with an installed capacity of 10 MW (2×2.5 MW+1×5 MW) has been planned  at  the  toe  of  the  dam  for  utilizing  the  mandatory  releases  for  ecological purposes, making the total installed capacity 120 MW. The Head Race Tunnel(HRT) of the project will be 7.25 m in diameter and 3.6 km long. The total land required for this project will be 1577 ha out of which according to the revised PFR and Form-I 552 ha will fall under submergence. But the old PFR and Form-I had mentioned the size of the submergence area as 620ha. The  free flowing river  stretch  between  Full Reservoir Level  (FRL) of  Lower  Kopili  HEP  and  Tail Water Level (TWL) of upstream  Kopili  HEP  is  about  6  km.

The water available at Lower Kopili dam site will consists of the following components:

1.   Tailrace releases from Kopili Power Station (4 x 50 MW)

2.   Inflow from intermediate catchment between Khandong and Longku Dam site

3.   Spill from Khandong and Umrong Reservoir.

Projects in Cascade on Kopili River

Some Key Issues Requiring Urgent Attention

After thoroughly going through Pre Feasibility Report (PFR) and Form-I of the proposed Lower Kopili HEP we have found that following issues have not been adequately dealt with by the project authorities. Infact some of them have not even been mentioned at all. EAC should not give TOR clearance to the project without satisfactory resolution of these issues.

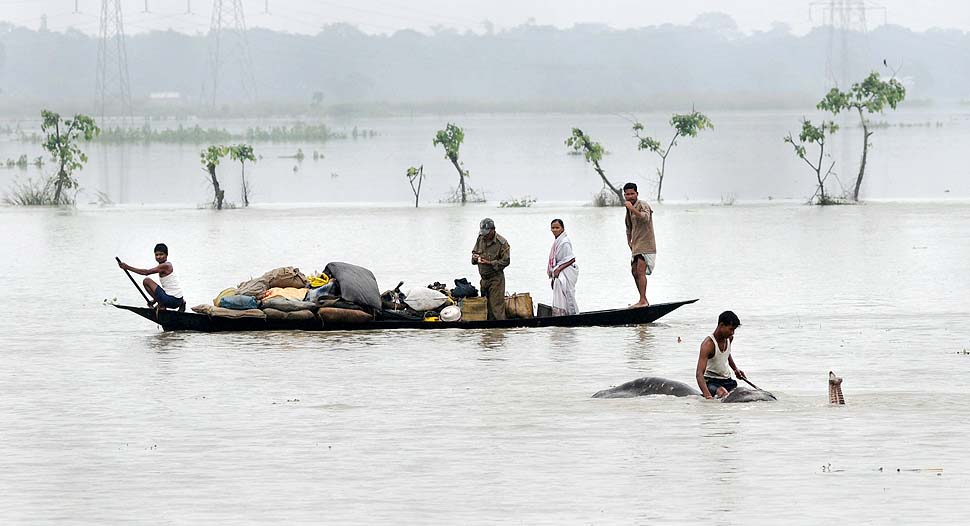
Dam induced Flood: Experiences of the people living in downstream suggest that floods have become more recurrent after construction of the dam. The Kopili dam has changed the character of flood in the river downstream for the worse. Before the construction of Kopili dam, floods occurred mainly during monsoon season. Increase in water volume due to heavy rains used to be the reason for flood. These were normal floods which occurred not more than two or three times a year. But after the construction of the dam, number of artificial floods occurring in a year has gone upto 5- 6 times. These floods mainly occurred from the month of August to the first one or two weeks of November. Government of Assam never made an attempt to investigate the source of these floods (this information is from a field visit done to the area). 

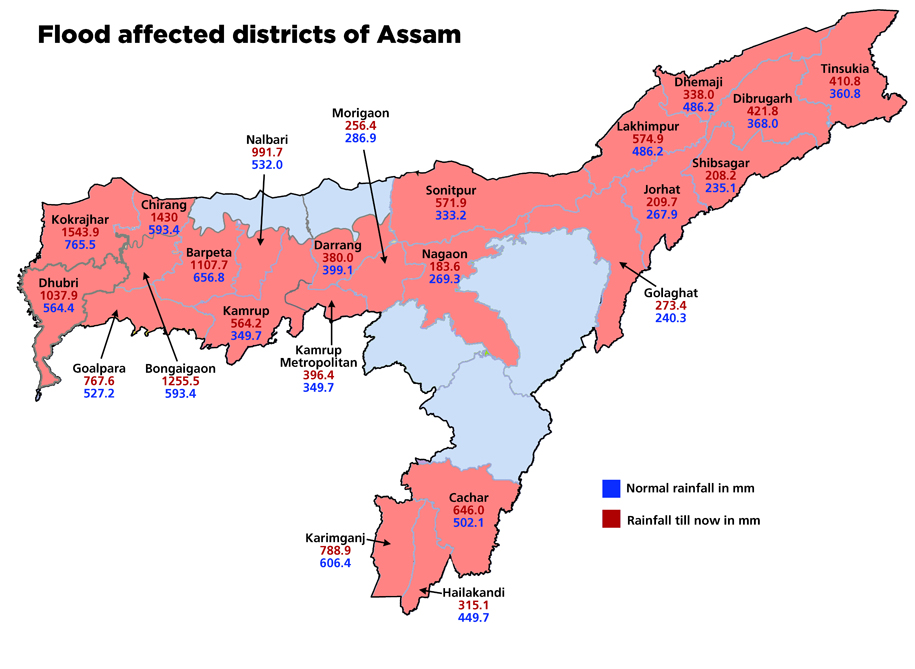
In the catastrophic floods of 2004, out of 140 revenue villages of Kampur circle of Nagaon district 132 were affected by floods with area of 135.12 sq. miles. Due to these floods 1,92,000 people were temporarily displaced. These floods also took the lives of 4 people. Even government had confirmed that the main reason for the devastation in these Nagaon and Morigaon districts was the release of the water from the NEEPCO’s Kopili project. The team that was deputed by the government found that water level of the Khandong reservoir went up to 727.70 meters against the FRL of 719.30 meters on 18th July 2004, which rolled down and led to catastrophic disaster. Flood release from the dam happened without prior warning and affected the whole valley. Kampur is one of the towns located in the downstream of Kopili dam where people were give only 2 hours to evacuate the area and move to nearby relief camps.  July 18 is less than midway through the monsoon and questions arise why was the dam allowed to be filled up so soon which had led to such disaster. Had the dam operations were conducted properly the disaster could have possibly been avoided.

The issue of flash floods in Kopili River was raised in the Assam state assembly. On 8th November, 2010 former Chief Minister of Assam Mr. Prafulla Kumar Mahanta, an MLA from Nagaon district made a call attention motion in the Legislative assembly on the issue flash floods in Kopili. He stated the NEEPCO is responsible for the flash floods in the Kopili River.[1] Then Water Resource Minister Prithvi Majhi in his reply accepted this claim by saying that “the government would take up the matter of providing prior warning before release of excess water with the NEEPCO authorities.”  From the above experiences of flood in Kopili River, it is clear that after the construction of the Kopili HEP (Hydroelectric Project) flood ferocity had increased in the downstream. In such situation construction of another dam in the immediate downstream of previous dam can worsen the flood scenario.

Besides, The Kopili reservoir of the Khandong dam is located at 82.5 km downstream from the origin of Kopili River. A major tributary Myntang with 512 sq kmcatchment joins Kopili at 86 km from origin[2]. This is one of the tributaries in the upstream of proposed Longku dam site. In rainy season excess of rains in the catchment of these streams can also lead to spillovers in the proposed dam itself. The PFR does not look into the cumulative impact of the operation of the two dams on the downstream riverine area.

Spillway Capacity Inadequate at Lower Kopili HEP: As per the PFR, the design spillway capacity of the proposed Lower Kopili project with catchment of 2106 sq km is 16110 cumecs. Compare this with the spillway capacity of the upstream Khandong dam on the same Kopili river with catchment area of 1256 sq km being 15471.3 cumecs. It is clear that the design spillway capacity of the proposed Lower Kopili Project is inadequate.

Acid Contamination due to Opencast Mining threatens Viability of Lower Kopili: In the item 9.9 of the Form-I it has been mentioned that the acidic mine discharge in the upper reaches of the Kopili catchment is posing serious threats to the existing Kopili HEP. The PFR states “The identified acid mine discharge has been reported to cause constant erosion/ corrosion of critical hydropower equipments leading to frequent outages of the power plants under Kopili HEP.” The minutes of 9th TCC (Technical Coordination Committee) & 9th North East Region Power Committee Meetings held on 11-12th August, 2010, stated “The Kopili HE Plant has faced an extraordinary and unprecedented situation owing to acidic nature of the reservoir water. Prima facie, the acidification of the reservoir water is caused due to unscientific coal mining in the catchment area as revealed by study through GSI, NER, Shillong. The increased wear and tear on the underwater metal parts of the Plant due to corrosive action of the acidic water has led to the increase in the number of breakdowns.” The minutes also mentioned “It is pertinent to mention here that, although massive repairing work has been carried out by NEEPCO as temporary measures; an integrated, interdisciplinary approach for preventing / tackling acidification at source must be opted for survival of the Plant.” The acidic contamination due to open cast mining is such that no living organisms could be found in the downstream of Kopili river up to Kheroni.[3] The situation is quite alarming as the PH value of the water has come down from 5.5 to 3.2 due to acidic contamination which is unfit for human consumption. State Power Minster was very much aware of the situation and expressing concerns over this he had asked the center to take up this issue with Meghalaya.[4] The PFR should have given detailed account of implication of this on the proposed Lower Kopili HEP and further downstream, but has not done that.

PFR overlooks Kopili Fault Line: The PFR of the proposed Lower Kopili HEP does not mention about the Kopili fault line[5]. In recent studies done in the Kopili river basin it has been found that the Kopili fault extends  from  western  part  of  Manipur  up  to  the  tri-junction  of  Bhutan,  Arunachal Pradesh  and Assam, covers  a  distance  of about  400 km. During the last 140 years, the Kopili fault has experienced 2 earthquakes of magnitude greater than 7 in R.S., three of magnitude 6 to 7 in R.S. and several of magnitude 4.5 to 6 in R.S.[6]   The study concludes that the North East region, more specially the Kopili Fault area is a geologically unstable region, surrounded by faults and lineaments and seduction zones in the east.  But the PFR of Lower Kopili, overlooking this issue states that there are only two minor faults in this area and both of them are much beyond the project area. This clearly wrong and misleading on the part of Lower Kopili PFR.

Besides, some of the EAC statements are not complete and stand in contradiction to each other. The EAC said that as the site specific seismic study had been completed by IIT Roorkee and considered it appropriate for 120 MW project. But it also mentioned “The project specific geo-morphological and neo-tectonic mapping has not been done so far. As the project area falls under the active seismic zone where the Disang-Naga Thrust and Dhauki fault merge which triggers high seismic risk, the proponent is to monitor the MEQ studies by installing a 3-4 seismograph network for a period of one year.” When EAC is aware of these site specific details, allowing an additional big dam in the area will only to increase disaster potential in the area. EAC needs to keep this in mind while considering this new dam.

Issues Tribal Land Relations: In the item 2.1 of the Form 1 the project authorities have stated that the 620 ha that will be submerged due to this project consists of medium to high density vegetation, scrubs open and barren land etc. But Dima Hasao people have expressed their fears of not getting proper rehabilitation.[7] The project seems to ignore this fact in the form 1. There can another reason also for the stating the submerged land as government land because the land holdings may not same as the ‘patta’ lands.[8] Besides, the area which has been considered for the construction of the dam is inhabited by Dimasa people who mainly depended on the system of shifting cultivation.[9] It is to be noted that in shifting cultivation there a cultivator cannot exercise permanent ownership over the land.

Defining ‘Other Forests’: The project as stated in item 1.1 of form 1 will also submerge 65 ha cultivation land. In the same item it is mentioned that an area of 585 ha will be submerged and this area has been mentioned as ‘other forests’. But the Form 1 did not define what this ‘other forests’ are or what they consists.

Impact on the Local People: In a memorandum submitted jointly by the Karbi Students’ Association (KSA), Sominder Kabi Amei (SKA) and Karbi Nimso Chingthur Asong (KNCA), to the State Power Minster Mr. Praduyut Bordoloi, the association demanded first preference in terms of employment should be given to the locally affected people. But the track record of dam building companies is very poor in this regard. The local people did not get promised employment and other benefits the in the Kopili project which came up in 1970s, 1980s and 1990s. On 20th March 2012, the Dimasa Students’ Union, Dimasa Welfare Association, Karbi Students’ Association and Sengia Tularam Club called for a 48 hours Umrangso bandh seeking “60 per cent of technical and non-technical posts in the project should be reserved for the local tribal populace, 100 per cent reservation for local tribal youths for Grade III and Grade IV posts, free electricity for locals, free treatment facilities in NEEPCO-run hospitals and so on.”[10] This is very crucial issues but surprisingly it finds no place in the PFR document.

Why the size of forest area significantly reduced: In the revised Form I and PFR, submitted on 23 August 2013, Section 1.1 mentioned that out of 1577 ha which is the total land required for the project, 552 ha will fall under submergence and 340 ha forest land will  be submerged in the reservoir. But the previous Form I and PFR, submitted on 14th November 2012, stated in the same section that the land falling under submergence and land converted into reservoir area is same i.e. 620 ha. The revised document does not give any rationale for reducing size of submergence area and reservoir area. It is also surprising to note that in the revised document, under the section “Impacts due to damming of river” in page 55, the old figures of submergence has been reiterated – “The  damming  of  river  Kopili  due  to  the  proposed  hydroelectric  project  in  creation  of  620  ha  of submergence  area.” So the new documents submitted in Aug 2013 have serious contradictions.

Issues Need to be Included in EIA report

Since several critical issues were not included in the previously submitted document, we have listed out the following issue which should be included in the Environment Impact Assessment (EIA) study of the proposed Lower Kopili HEP. Without detail analysis of all these issues EIA cannot be considered as complete.

Downstream Impact Assessment:  Downstream impact assessment is a burning problem in Assam. The state has already witnessed huge protests against dams due to lack of proper downstream impact assessment. In case of proposed Lower Kopili HEP, the EIA document should do a proper downstream impact assessment. In order to do a thorough downstream impact assessment, the EIA will have to go beyond the 10 km radius and assess the full downstream area. In case of Lower Kopili, going beyond 10 km downstream becomes all the more significant because major part of the Kopili river basin is in the downstream of the dam. The downstream impact assessment should specifically focus on the impacts of the dam on fisheries and livelihood of the people who are dependent on fisheries, change in character of flood and impacts thereof, change in sedimentation and impacts thereof, change in geomorphological issues, change in groundwater recharge, among others. The EIA should find which section of people will be affected the most by the dam and how to compensate those people.

It has been reported that bank erosion by the Kopili River has increased after the construction of the Kopili dam. The EIA report of Lower Kopili HEP, should do an analysis to find what will be impacts of the new project on river bank erosion.

Impacts Peaking Power Operations: The EIA should do a detail assessment of impacts of peaking power operation during non-monsoon months. Due to peaking power generation in non-monsoon months the river stretch downstream from power house will have very little water for most hours of a day with sudden flows in the river only for a few hours. This flow fluctuation leads to many severe impacts including on aquatic bio-diversity, on safety, on river bed cultivation, on erosion, among others. This has severe socio economic impacts along with issues of safety of the people and their livestock in this stretch of the river. Therefore the EIA should do a detail assessment of impacts of peaking power generation.

Assessment of Optimum Reservoir Operation: The EIA should do an assessment to prepare an optimum reservoir operations plan for the project in order to minimize the downstream impacts if a disaster occurs. It is also highly recommended that the local people should be made a part of the reservoir operations process. Then only the dam authorities can be expected to be more responsible to in reservoir operations.

Impacts of Silt Management operations: The EIA should include detail analysis impact of changing silt flows downstream from desilting chamber, from silt flushing in monsoon, on the downstream areas. The EIA study should give detailed account of how the silt from the dam will be flushed out annually and what will be the impact of this in the downstream. The EIA should also include how the desilting chamber will be operated and what will be its impacts.

Detailed and Thorough Options Assessment: The EIA should do a thorough options assessment for the project. There can be several other cost effective options for power generation in that area and options assessment should look into al those.

Here we can take the case of solar power. A recent example of proposed 1000 MW solar power generation in Rajastan[11] has showed that for 1 MW installed capacity only 2 Ha of land is required and the cost per megawatt installed capacity will be 7.5 crores and electricity will be provided at Rs 6.5 per unit. Another proposed 25 MW solar power project in Assam[12] has similar figures.

At this rate, for a 120 MW (the target capacity of the proposed Lower Kopili HEP) solar power plant, the land required will be 240 ha. But for Lower Kopili HEP the land required is 1557 ha of land out of which nearly 900 ha will be used for the project even if we subtract 680 ha projected to be used for compensatory afforestation. This implies that for 1 MW installed capacity for the proposed dam the land requirement will be about 7.5 ha, about 3.75 times the land required for solar project of same capacity. Besides, the total cost for the Lower Kopili project is expected to be Rs. 1489.64 crores implying cost per MW installed capacity will be Rs. 12.41 crores, compared to Rs 7.5 cr for solar plant. Even if we were to put up 240 MW installed capacity of solar project, it would require 480 ha land, will not have impacts on the river, on people’s livelihoods, on forests, on climate change, and so on.

Increased Costs: It is important to note here that EAC in its 65th meeting in March 2013 discussing this projects had noted “In  comparison  to  other  HEPs  being  examined  recently,  the  cost  per  unit  of installed capacity of this project is almost double!” and this was said when the cost per megawatt installed capacity was Rs. 9.79 crores. Now in the revised document, the cost has gone up further to Rs 12.41 cr, the project proponent need to explain this further escalation from the earlier already high cost.

Groundwater Depletion in Downstream areas: People in the downstream of Kopili dam have reported that there has been depletion of groundwater in the downstream areas of Kopili dam. From a field visit done in the downstream areas of Kopili dam, it was reported that the ground water level at certain areas had reduced to 140 feet. River like Borapani, Kopili and Nisari dry up in the winters affecting the winter cultivations. Besides, wetlands which are known as Beel or Duba locally have disappeared. The reduction in groundwater can also be due to reduced groundwater recharge due to the dam. Impact of the dam on groundwater recharge should be a part of the EIA study.

Impacts of Tunneling and Blasting: The EIA should analyze the impacts of tunneling and blasting as these activities can increase in risk of landslide and disaster in a hilly area. Blasting in hilly area also will have impacts on water and people. These impacts should be thoroughly assessed by the EIA of the proposed project.

Impacts of Mining: The project will require large quantities of sand, coarse and fine granules and boulders. These are likely to be mined from the nearby areas. The EIA should include a study on the impacts of mining on the people as well on the local environment. Mining for the project will be done in the nearby areas and it will have severe impact on people as well as on the river, bio-diversity, hills, flora-fauna and aquatic bio-diversity etc. The study on the impacts of mining should include all these issues.

Impacts of Backwater Effects: The PFR of proposed Lower Kopili HEP states that Maximum Water Level (MWL) of the river is 229.60m where as the FRL of the reservoir is 226.0m. The MWL is thus 3.6m higher than FRL and this will have serious back water effects during the times of monsoon. The EIA must do an assessment of the submergence at MWL level and backwater effect measured at MWL and follow it up with an impacts analysis.

Detailed analysis about the existence of wetlands, watercourses and other water bodies: The revised PFR in page 17 under section ‘Environment Sensitivity’ states that there are no wetlands, watercourses and other waterbodies reported within the 15 km of the project. This statement seems incorrect. The EIA should do a detailed and thorough analysis regarding the existence wetlands, watercourses and other water bodies within 15 km of the project site.

 Impacts of Climate Change: The EIA of the proposed Lower Kopili dam should do a study of  possible impact of the climate change on the dam as well as on the Kopili river. Besides, it should also include the impacts of the dam on adaptation capacity of the local people.

Smaller Size Documents should be Uploaded for Public Dissemination: The EIA and other documents which would be uploaded on the internet should be about the size of 10 MB or less. The Revised Form I and PFR which uploaded on the MoEF website was 114 MB and it was difficult to download such a huge document even in a metropolis. These heavy documents will nearly be impossible to download from a small town or a village. The MoEF should insist from projects proponents that PP should be careful about this and should reduce the size (less than 10MB) documents for uploading from next time.


Parag Jyoti Saikia

with inputs from Himanshu Thakkar and Pooja Kotoky

Email – meandering1800@gmail.com

South Asia Network on Dams, Rivers & People (https://sandrp.in/https://sandrp.wordpress.com/)


[2] Patowary, A., “The Kopili Hydroelectric Project, Downstream People Rise in Struggle” published in “Water Conflicts in Northeast India – A Compendium of Case Studies” edited by Das, Partha J. et. all, 2013

[5] Mahanta,  K. and et all (2012): “Structural Formation & Seismicity of Kopili Fault Region in North-East India and Estimation of Its Crustal Velocity” International Journal of Modern Engineering Research,Vol.2, Issue.6, Nov-Dec. 2012 pp-4699-4702

[6] ibid

[8] It is to be noted that in many of the tribal areas of Assam and India’s north eastern states, the tribal law of land is community of ownership of land and there are no government ‘patta’ system.

Bihar · CAG Report · Floods

CAG Review of Flood Control measures in Bihar: When will Auditors learn about ecology?

CAG Review of Flood Control measures in Bihar:

When will the auditors learn about Ecology?

Image

Recently tabled CAG (Comptroller and Auditor General of India) audit report on Bihar contains a performance review of implementation of flood control measures[i] in this most flood prone state. Most of the rivers in North Bihar originate in the Himalayan range in Nepal and cause floods in downstream Bihar with recurrent frequency. 73 percent of geographical area in Bihar is said to be under the threat of flood every year and 16.5 percent of total flood affected areas of India is located in this state.

On reading this performance review, one gets an idea of how CAG audit teams’ knowledge base on flood issue in Bihar relied heavily on Ganga Flood Control Commission (set up by Government of India in April 1972) recommendations, Bihar Flood Management Rules of 2003, Guide on Flood Management Programmes issued by Govt of India etc. However, the performance audit fails to draw upon the numerous writings by Dinesh Mishra of Barh Mukti Abhiyan (Freedom from Floods campaigns) and others. The performance audit also fails to draw upon the recommendations in the civil society fact finding mission following the massive floods due to Kosi embankment breach at Kusaha in Nepal[ii], Kosi Deluge: the Worst is Still to Come.

So when a performance audit report fails to draw upon the writings from ecologists and environmental historians, what recommendation flows from it? The same that would have flowed from the various official Ganga Flood Control Commission (GFCC) reports: build high dams in Nepal to trap the silt, at Barah Kshetra and on the tributaries of the river Kosi, a reservoir with adequate flood cushion at Noonthore on the Bagmati river, three dams over the river Gandak and a multipurpose reservoir at Chisapani on the river Kamla Balan. It is out of this blind faith in looking at high dams as providing flood control and flood cushion solution that CAG audit raised an audit observation that Bihar had failed to prepare even the Detailed Project Report on these proposed dams. The reply that state flood control department filed in November 2012 stated that a Joint Project Office was established at Biratnagar (Nepal) to study the feasibility of proposal of dam on Bagmati, Kamla Balan and Kosi rivers and the DPR of dam at Barah Kshetra was expected to be prepared by February 2013. The audit could have raised the question about the appropriateness of spending money on such futile exercise.

Misplaced faith in structural solutions Dinesh Mishra responds to this fallacy of the auditors stating, “The CAG report repeats what is told to it by the Govt. of Bihar (GoB) as the long term plan that was proposed for the first time in 1937 and nearly eight decades later the proposal is still under ‘active’ consideration of the two governments. Neither the GoB nor the CAG brings out this fact that there is massive resistance to any dam building in Nepal and more so if it is done by India. That is the reason why it has taken 16 years to work on the DPR so far without getting the same ready for any negotiation.” Dinesh Mishra adds, “There is no talking about seismicity, downstream impacts of large dams and strategic defence of the dam itself. We are not sure whether these structures would ever be built, but it is a carrot dangled before the flood victims of the state as if once the dam is built, all the flood problems of the state will be solved” (emphasis added).

No review of reasons for the Kosi disaster of 2008 Also missing from performance review are references to reasons for massive floods in the year 2008 following the breach in Kosi embankment at Kusaha and the pending recommendations by the still ongoing enquiry committee of Kosi High Level Commission. The audit fails to go indepth into how improper maintanance of the embankment lead to this flood disaster, who were responsible for improper maintanance and what system is needed to ensure such blunders are not repeated in future. The audit could have also gone into the role played by GFCC, Kosi High Level Committee and others in the Aug 2008 Kosi flood disaster. The audit continues to display an understanding that looks at more and more embankments straight jacketing the river, or unproved technological remedies such as Intra Linking of Rivers as potential solutions. Hence it raises questions on the non-completion of DPRs on Intra-linking of rivers and on completion of only 61.47 kms embankment against the target of 1535 kms as envisaged in the 11th Five Year plan.

Need to audit CWC’s flood forecasting performance The audit report does however mention those long term non-structural measures, such as flood plains zoning bill and establishment of flood forecasting units at field levels in upstream Nepal that were also recommended in 2004 by GFCC. The audit scrutiny showed that the state water resource dept had failed to enact flood plain zoning bill as well as in establishing flood forecasting units at field levels in all 16 test checked divisions out of 60 flood control divisions. The Audit should have also looked at the quality and use of flood forecasting by the state government and central agency like the Central Water Commisssion. CWC’s flood forecasting and its role in other aspects of flood management in Bihar also need a performance appraisal urgently. The Role played by Farakka Dam in creating backwater effect in Bihar, thus prolonging the flood duration in Bihar and also increasing the height of floods is another aspect that needs scrutiny.

Non implementation of Flood Plain Zoning Bill The flood plain zoning bill would have provided framework for regulation of development activities with the help of flood management maps. In November 2012, replying to this audit observation, department sought to justify its inaction by arguing that flood plain zoning is “impracticable and hindrance in the pace of development of state”. In the wake up of recent disaster in Uttarakhand, Bihar as well as other states would do well to give up on this misconceived tactic of shooting down any advocacy for environmental regulations by terming it as arresting ‘the pace of development’.

Bihar evaluating detention basin DPRs? The audit also pointed out that the suggestion of creating detention basins, i.e. adapting natural depressions/ swamps and lakes for flood moderation was not implemented by the dept as they had neither identified any sites nor released any funds to any divisions to undertake this work during 2007 to 2012. When this was pointed out by CAG auditors, the dept replied in August 2012 claiming that the DPRs of detention basins was under evaluation and final plans would be prepared by December 2012. However, till February 2013, no further progress on this was communicated by dept.

The audit also observed very serious deficiencies in financial management by the department. During the five year period 2007 to 2012, the dept had failed to utilise 11 to 44 percent of the available funds mainly due to delayed/ non-sanctioning of the schemes, delay in land acquisition, opposition by local people and non-passing of bills by the treasuries. Worse still, audit scrutiny showed that the dept had made 30 allotments amounting to Rs 47.47 crore to divisions on the last day of financial year.

Audit scrutiny of flood protection scheme revealed that the contract management of the dept was deficient as was evident from the cases of non-publicity of tender, allotment of works to ineligible contractor, loss to government owing to undue favour extended to a particular contractor and loss of Rs 103 crore due to non-availing of the benefit of competitive bidding in execution of Bagmati extension scheme. Audit also noticed other deficiencies such as non adherence to flood calendar in 44 percent of test-checked works, infructuous expenditure worth Rs 68.50 crore in four test-checked divisions and excess payment of Rs 6.25 crore in two test-checked divisions. Audit also pointed out that dept had incurred an unfruitful expense of Rs 20.21 crore due to abandoning, closure/ postponement of zamindari bandh in two test-checked divisions.

The office of CAG of India has indulged in lot of talk around the idea of environmental auditing. An International Centre for Environment Audit and Sustainable Development was inaugurated at Jaipur in May 2013 and the office of the CAG of India has held a few consultations on environment auditing in recent past. However, performance reviews such as this one clearly points out the need for CAG auditors to equip themselves better in the realm of understanding the ecological aspects around flood, flood plains and flood management; rather than simply drawing up from the reports in official domain such as Ganga Flood Control Commission etc. Will the newly appointed head of India’s Supreme Audit Institution devote his labour to this urgent tak?

Himanshu Upadhyaya

(Author is a research scholar at Centre for Studies in Science Policies, JNU, New Delhi.)

brahmaputra · Climate Change · Indus

IWMI report on Glaciers and Snow cover in Himalayas in Changing Climate: Significant Impact on Seasonal flow of the Rivers in India

International Water Management Institute (IWMI) has recently published a study named  Glacier Systems and Seasonal Snow Cover in Six Major Asian River Basins: Hydrological Role under Changing Climate, authored by Oxana S. Savoskul and Vladimir Smakhtin which claims that the hydrological role of the melt-water resources in six major rivers e.g. Indus, Ganges, Brahmaputra, Syr Darya, Amu Darya and Mekong of the Hindukush-Himalayan region (HKH) has been comprehensively assessed for the first time on a basin scale. Reviewing already published studies, this report draws some interesting conclusions regarding the role of glacier and snow meting for six river basins which includes three major rivers basins of India.

The map below shows area of the river basins included in this study. In this report, the term ‘melt-water resources’ has been used to cover glacier systems and seasonal snow cover. This report uses 1961-1990 status of melt-water resources as the baseline and compares with the 2001-2010 using the following characteristics: specific glacier runoff (average depth of annual discharge from glacier-covered area), basin total glacier runoff, shares of renewable and nonrenewable components in glacier runoff, total seasonal surface snowmelt from non-glaciated areas, portion of seasonal snowmelt lost for the recharge of groundwater aquifers, the contribution of glacier runoff and seasonal snowmelt to mean annual flow (MAF).

Map from the report showing the boundaries of the study basins (red line), state borders (light yellow line) and snow-covered high-altitude belts where glaciers are located (white spots
Map from the report showing the boundaries of the study basins (red line), state borders (light yellow line) and snow-covered high-altitude belts where glaciers are located (white spots)

The authors have used Glacier mass budget-based methods and hydrograph separation techniques which they stated as suitable for basin-scale assessments instead of the temperature-index methods. They say that application of these two methods in semi-distributed models can give the highest currently possible accuracy of +30%. The authors opine that many of the studies done previously had confused between the ‘snowmelt’ and ‘glacier-melt’ because these studies have not dealt with terminologies and methodologies in detail. The report states that there is a scarcity of glacier runoff estimates in peer-reviewed papers, “An analysis of publications on modeling runoff from large- and medium-scale glaciated catchments….. indicates that not many of these dealt with modeling glacier runoff per se. Even fewer report their evaluations of glacier runoff separately from snowmelt, if at all.”

For the three of the six river basins studies and which flow through India, i.e. Indus, Ganges and Brahmaputra the total annual glacier runoff for the period of 1961-1990 was 41 km3,16 km3 and 17 km3 respectively. But in the recent periods of 2001-2010, total glacier runoff was reduced to 36 km3, 15 km3 and 16 km3 respectively for the three basins, see Table 1 for details.

It is clear from the table that while Indus and Brahmaputra basins have similar percentage of  area under glaciers and snowmelt, the reduction in the glacier and snow cover area are more pronounced in Indus basin. Besides, in all the three basins the reduction in glacier area is more pronounced that the snow cover area. However, the contribution of glacier melt and also snow melt to run-off is much higher in Indus basin compared to Brahmaputra basin, showing the greater role of precipitation in Brahmaputra basin. Within the Indus basin even though seasonal snow covers 28% of the total area, much than the 2.6% occupied by glaciers during 1961-90, the contribution of two sources to Mean Annual Flow is almost same. But a question arises, has the contribution of glacier melt to the runoff increased in any of the basins in the recent decade? The answer is surprisingly, no.

Table 1: Recent changes in the glaciers and seasonal snow and their contributions to MAF

Basin Part of basin area(%) covered by Contribution to MAF (%)
Glaciers Seasonal Snow Glacier runoff Seasonal Snowmelt

1961-1990

INDUS

2.6

28 18

19

GANGES

1.2

6 4

2

BRAHMAPUTRA

2.7 27 2

2

2001 -2010

INDUS

1.8 25 15 16
GANGES

0.9

6 3

1

BRAHMAPUTRA

2.2 26 2

2

For the Ganges basin, the report says that heavy summer precipitation almost solely determines MAF volume for the basin. Maximum seasonal snow area in the Ganges basin makes just 6% of the entire basin area. Similar situation were reported for the Brahmaputra basin, where the lower parts of the basin i.e.  Southeastern Tibet and Eastern Himalayas where nearly 75% of the basin’s glaciers are located, witness heavy summer monsoon rains. Regarding Indus basin the report says, “Precipitation in the IndusBasin is more evenly distributed between the seasons, but is highly variable spatially – similar to Brahmaputra and Amu Darya, where annual precipitation in some catchments is tenfold (3,000 mm) of that in the other glacier-covered parts of the basin (300 mm).”

Reviewing already published documents the report states “it appears that the research in High Asia is concerned much more with CC impacts than with objects of the impact. Yet, understanding of the expected basin-scale changes in glacier runoff in response to climate change remains largely unclear.”

The report does an analysis of assessments done on impact of climate change on water availability in Himalayas and concludes that many assessments rely on poorly verified sources. The report refers to the statement made by Cruz et al. (2007) “The current trends of glacier-melts suggest that the Ganga, Indus, Brahmaputra and other rivers that criss-cross the northern Indian plain could likely become seasonal rivers in the near future as a consequence of climate change…,” This statement was admitted as a typing error after publication but even then this has been reiterated as an apocalyptic vision in NGO reports.

Using the Table 2 given below, the report states that glacier contribution is a minor item in the annual river water budgets in the Ganges and Brahmaputra basins. The report says “The impact of climate change was found to be more prominent on seasonal rather than annual water availability.” It is clear from the table that, in the recent decades non-renewable component in all three basins have gone up while renewable and total volume of water from glacier melt have come down. It is also noteworthy that, even though Brahmaputra basin has more area under glacier cover than the Ganges basin (see Table 1), the volume of water from non renewable glacier flow was more in both periods in the Ganges basin. Besides, the percentage of increase in nonrenewable glacier runoff components during 2001-10 is highest among all three basins, signifying that glaciers are melting fastest in Ganga basin.

Table 2: Contribution of renewable and non-renewable components to glacial runoff

Basin Glacier runoff components Total Glacier runoff (km3) Total Glacier runoff contribution to MAF (%)
Renewable (km3) Nonrenewable (km3)

1961-1990

INDUS

33.0

8.14 41.2

18

GANGES

11.0

4.74 15.7

4

BRAHMAPUTRA

12.7

4.29 17.0

2

2001 -2010

INDUS

24.5

11.62 36.1

15

GANGES

8.1

6.95 15.0

3

BRAHMAPUTRA

10.6

5.05 15.7

2

The reports also states, “Glaciers and seasonal snow in CC-impact assessments should be perceived as natural water reservoirs with gradually diminishing storage and flow regulation capacity, both on intra-annual and inter-annual scale. Potential changes of precipitation regime coupled with effects of temperature rise on evapo-transpiration will impact future hydrological regimes of the major rivers much more significantly, affecting both MAF and flow seasonality.”

The authors of this report clear some fog around climate change and Himalayan glacier system and snow-melt. One lacuna of the report is that even though the report discusses glacier run-off it makes no mentions of glacier lakes and glacier lakes induced floods. There are several incidents of glacier lake induced floods happening in the basins discussed. There is evidence to show that in the recent flood devastation in Uttarakhand in India glacial lakes played significant role.

Parag Jyoti Saikia

with inputs from Himanshu Thakkar

South Asia Network on Dams, Rivers and People (www.sandrp.in)

Bihar

People’s Advocacy for Protecting Ponds and Lakes in Bihar

 MITHILA (North Bihar) can be called a land of ponds. There are 9115 ponds in 1269 villages of Darbhanga district. Area of pond varies from about 1 acre (0.3 hectare) to 150 acres (60 hectares). Some of them are 500 to 1000 years old. The excavation of a pond was considered as a very pious act. After excavation of a pond, it is dedicated (UTSARGA) by its excavator to all living beings (human, cattle, bird, insect and species which survive in water) for their survival and need of water.

14. pond bund as a shelter for wild animals

This way, community has an age old tradition of customary rights over a pond for irrigating agricultural land; to use water for bathing, washing and cooking purpose; and water for bathing & drinking their cattle. Besides, these ponds help in recharging ground water; about 70 to 80 varieties of birds survive on small fishes and insects provided by these.

15. Pond bund for shelter for bird and wild animals

Moreover, the ponds in Mithila provide nutritional food in the forms of fish, snail, crabs to people and livelihood to weaker section/fish farmers; pond bund covered with trees, grasses and bush/shrub/herbs become a natural shelter/forest-belt for wild animals in rural areas. In fact, many ponds are a centre of religious and cultural festivals of all castes and sects.

10. Popular Religious Festival called Chhatha Pooja at Harahi Pond (1)

They also play a vital role in mitigation of flood and drought, and in harvesting of rain and river water.

13. Pond Bund & Bird shelter

In spite of several laws and judicial orders for protection of ponds, their very existence is in danger. Hundreds of ponds have been leveled to the ground and illegally sold by land mafia.  Pond bund, slope of pond bund to water bed, and inlet & outlet of pond have been illegally sold/occupied or encroached for construction of houses, shops, schools, hospitals and commercial complex by greedy, criminals and influential persons. People’s right to the ponds is denied and prevented by land/pond mafia. Sewage, garbage and medical garbage are routed to ponds, which is polluting its water to dangerous level.

12. Pond Bund as a Forest Belt

 With this background, Mithila Gram Vikas Parishad (MGVP) has started an initiative for protecting Mithila’s and Bihar’s Ponds through Advocacy and an extensive awareness-raising campaign:

— to protect community’s traditional right to the ponds and safe water.

— to protect livelihood, pond’s diversity and ecosystem including water security .

— to influence policy makers & planners to set up a ‘Bihar Pond Development Authority’ with clear

     defined responsibility to protect & conserve the ponds with local participation

—to prevent encroachment and illegal building construction over pond’s area, and health

    hazards due to dangerous pollution of pond water.

—to prepare Technical Guidelines, based on community practices and traditional wisdom of pond conservation, for protection, reclamation and conservation of ponds in Bihar, in consultation with environmentalist  & experts.

6. Ganga Sagar Scene of Encroachment

Contact Details of MGVP:

 MITHILA GRAM VIKAS PARISHAD, Professor Colony, West of Dighi Pond, Darbhanga,  Bihar, India, PIN: 846004,        

Contact Person: Narayan Jee, Email: mgvp4water@gmail.com,  Phone:06272-254085, Mob: 9955344811

Also see Dr. Sudhirendar Sharma’s article on this: http://www.thehindu.com/news/national/other-states/ponds-in-distress/article4960246.ece

Arunachal Pradesh · Assam · brahmaputra

Brahmaputra – The Beautiful River or The Battleground?

Capture 3

The Brahmaputra River, geologically is the youngest among the major rivers in the world yet it is known as a moving ocean. The river Brahmaputra travels 2880 km from its origin in the young Himalayan range through the Tibet and India and finally merges with the sea in Bangladesh by opening its streams like the roots of a large Banyan tree. While traversing through India the river is astonishingly wide at some areas. In Upper Assam near Dibrugarh the river is 16 km wide where as in lower Assam at Pandu, near Guwahati the river is 1.2 km wide but in the immediate downstream it is nearly 18 km wide. Brahmaputra which is mainly a glacier fed river has also the distinction of being the river with highest sediment yield 852.4 t/km2/y in the world and second highest water yield at delta, next only to Amazon.[1]

Origin and Path

The BrahmaputraRiver originates in the Chemayungdung mountain ranges which nearly sixty miles south-east of Mansarovar lake in the MountKailash range in Southern Tibet at an elevation of 5300 m.A spring called Tamchok Khambab spills from the glaciers which later gather breath and volume to become the Tsangpo, the highest river in world.

A Buddhist shrine called a stupa overlooks the Brahmaputra River in southern Tibet. Source: http://kids.britannica.com/comptons/art-67000/A-Buddhist-shrine-called-a-stupa-overlooks-the-Brahmaputra-River
A Buddhist shrine called a stupa overlooks the Brahmaputra River in southern Tibet.
Source: http://kids.britannica.com/comptons/art-67000/A-Buddhist-shrine-called-a-stupa-overlooks-the-Brahmaputra-River

Out of its total length of 2,880 km the Brahmaputra covers a major part of its journey in Tibet as Tsangpo. Tsangpo or the BrahmaputraRiver flows 1625 km in Tibet parallel to the main range of Himalayas before entering India through Arunachal Pradesh.

Apart from the name Tsangpo, the Brahmaputra is also known by its Chinese name, Yarlung Zangbo in Tibet.  There are several tributaries of Tsangpo in Tibet. According to Encyclopedia Britannica,  Raka Zangbo (Raka Tsangpo), Lhasa (Kyi) and Nyang Qu (Gyamda) are prominent north bank tributaries where as Nyang Qu (Nyang Chu) is a tributary on the south bank. The Raka Zangbo (Raka Tsangpo) joins Tsangpo in the west of Xigazê (Shigatse) and Nyang Qu (Gyamda) River joins the river from the north at Zela (Tsela Dzong). The Lhasa (Kyi) river flows past the Tibetan capital of Lhasa and joins the Tsangpo at Qüxü.  The right bank tributary Nyang Qu (Nyang Chu) meets the Tsangpo at Xigazê.

Before entering India, the river passes Pi (Pe) in Tibet and suddenly turns to the north and northeast and cuts a course through a succession of great narrow gorges between the mountain Gyala Peri and Namjabarwa (Namcha Barwa) in a series of rapids and cascades.

The Great Bend of Tsangpo where China planning to build world’s biggest hydropower project Source: http://greenbuzzz.net/nature/the-biggest-canyons-in-the-world/
The Great Bend of Tsangpo where China planning to build world’s biggest hydropower project
Source: http://greenbuzzz.net/nature/the-biggest-canyons-in-the-world/

The river then turns south and southwest and flows through a deep gorge across the eastern extremity of the Himalayas with canyon walls that extends upward for 16,500 feet (5,000 meters) and more on each side. This is the celebrated great bend where China has plans to build the world’s biggest hydropower project of 40 000 MW capacity and also divert water from here to the North China, though China is currently denying any such plans.

Siang River Source: https://www.facebook.com/lovely.arunachal/media_set?set=a.117543018322855.21150.100002014725686&type=3
Siang River
Source: https://www.facebook.com/lovely.arunachal/media

The river enters Arunachal Pradesh near Gelling where it is known as the Siang or Dihang. The total length of Siang River is 294.5 km till its point  of confluence  with Dibang and Lohit River. The elevation of Siang river catchment area ranges from 90 m to around 5800 m. In India the total catchment of Siang river up to its confluence with Dibang is 14965.30 sq km.[2]

The SiangRiver meets two other major tributaries of Brahmaputra, Dibang and Lohit in the west of Sadiya, at a place named Kobo. From this confluence point, the river is known as the Brahmaputra till it enters Bangladesh. In India the journey of the river Brahmaputra is 918 km long.

A recent study has shown that Kobo used to be confluence point in 1915.  By 1975 the confluence shifted to a place called Laikaghat which is 16 km downstream of the earlier point of confluence. In 2005 through satellite images it was observed that the confluence point has shifted “19 km farther downstream”.[3]

The river crosses Assam below Dhubri and enters Bangladesh where the river is known as Jamuna and it flows for 337 km. Regarding Brahmaputra’s role in Bangladesh a study writes “The Jamuna is the local name given to the river for its entire length in Bangladesh to the Ganges junction.

Jamuna River in Bangladesh Source: http://www.trekearth.com/gallery/Asia/India/North/Uttar_Pradesh/Agra/photo322311.htm
Jamuna River in Bangladesh
Source: http://www.trekearth.com/gallery/Asia/India/North/Uttar_Pradesh/Agra/photo322311.htm

The Brahmaputra-Jamuna has one principal tributary input, the TeestaRiver in the north-west, and two major offtakes on the left bank that are the Old Brahmaputra and the Dhaleswari. The Brahmaputra/Jamuna River contributes ~51% of the water discharge and 38% of the sediment yield to the Padma (Schumm and Winkley, 1994), with the sediment yield being estimated at 590 MT/ yr and the sand fraction contributing 34% of this total (Sarker, 1996).”[4] The Jamuna joins the Ganges at Goalundo Ghat and from here the combined flows of these two mighty rivers are known as Padma which joins Meghna in the downstream. The united stream thereafter known as the Meghna and with this name the river Brahmaputra ends its journey, entering the Bay of Bengal.

Bhutan forms an integral part of the Brahmaputra river basin even though it does not come in the path of the river. In our subsequent blogs we will bring a detail account of Bhutan’s role in Brahmaputra river basin.

 The Brahmaputra River Basin

The Brahmaputra river is an international river and its river basin is spread over four countries Bhutan, Tibet , India and Bangladesh with a total basin area of 5,80,000 sq. km. Out of this total catchment area 50.5% lies in Tibet, 33.6% in India, 8.1% in Bangladesh and 7.8% in Bhutan. For geologist and environmentalist the Brahmaputra is a very unique river because “drains such diverse environments as the cold dry plateau of Tibet, the rain-drenched Himalayan slopes, the landlocked alluvial plains of Assam and the vast deltaic lowlands of Bangladesh.”[5]

Map of Brahmaputra Basin from its origin to its confluence Source: http://en.wikipedia.org/wiki/Brahmaputra_River

In India the total basin area of BrahmaputraRiver is 197 316 sq. km. which 5.9% of the total geographic area of the country. In India the river is spread over states of Arunachal Pradesh, Assam, West Bengal, Meghalaya, Nagaland and Sikkim.

In India state-wise the drainage area of the BrahmaputraRiver is as follows:

State

Drainage area (sq. km)

% of state area in Brahmaputra basin

Arunachal Pradesh 83 740 100%
Assam 71 216 90.79%
West Bengal 12 585 14.18%
Meghalaya 11 780 52.52%
Nagaland 10 895 65.71%
Sikkim 7 100 100%
Total 197 316

Source: ‘Intregrated Water Resource Development: A Plan for Action’, MoWR, Govt. of India, September, 1999

The Arunachal Pradesh and Nagaland portion of the Brahmaputra river basin is mainly covered by mountain ranges and narrow valleys. Meghalaya part of the basin is majorly covered by hills where as Assam and West Bengal are mostly plain areas.

Politically in India the basin is spread over 22 parliamentary constituencies (2009) comprising 12 in Assam, 4 in West Bengal, 2 in Arunachal Pradesh, 2 in Meghalaya, 1 in Sikkim and 1 in Nagaland.

Projected Water Use for Diverse Purposes in the Brahmaputra Basin

Catchment Area 197 316 km2
Population (1991 census) 29.1 million
Surface-Water Potential (Av Annual) 629 km3/year
Utilisable Surface Water 24 km3/year
Total Replenishable Ground Water (Av. Annual) 26.55 km3/year
Natural Groundwater Recharge from Rainfall 25.72 km3/year
Estimated Utilisable Flow excluding Ground Water 21 km3/year

Source: ‘Integrated Water Resource Development: A Plan for Action’, MoWR, Govt. of India, September, 1999

Tributaries of Brahmaputra

Sub-basin map of Siang River Source: Environment Assessment Report Siang Basin In Arunachal Pradesh, Interim Report June 2012
Sub-basin map of Siang River
Source: Environment Assessment Report Siang Basin In Arunachal Pradesh, Interim Report June 2012

Studies have stated that the Brahmaputra river in its entire course receive water from a large number of tributaries. A study called “Study of Brahmaputra River Erosion and Its Control” done by IIT Roorkee[6] stated “the Brahmaputra receives as many as 22 major tributaries in Tibet, 33 in India and three in Bangladesh.” However this study did not mention anything about the river in Arunachal. We have already mentioned about the few of the tributaries Tibet. In Arunachal the major tributaries of Siang River are Ringong Asi, Yang Sang Chhu, Sigong/ Sirapateng, Niyikgong, Angong, Simang, Yamne, Siyom, Yargyap, Hirit Korong.[7]

In the course of journey through Assam from east to west, some of the important tributaries of the BrahmaputraRiver which join the river on the north bank are Lohit, Dibang, Subansiri, Jiabharali, Barnadi, Puthimari, Pagladia, Beki, Manas, Ai, Gabhoru, Chompawati, Sankosh, Raidhak, Torsa, Teesta etc. Burhidihing, Desang, Dikhow, Jamji, Bhogdoi, Kakdonga, Dhansiri, Kopili, Kolong, Sonai, Digaru, Bharalu, Krishnai, Dudhnoi are the major tributaries on the left bank. The actual number of rivers and rivulets which joins the mighty river is much larger than this list. In subsequent blogs we will try to go into details of some of the tributaries of the river Brahmaputra.

Hydrology of Brahmaputra

For the river Brahmaputra the average annual flow (water discharge) throughout Assam vary from 8500 to 17000 cubic meters per second. At Pandu Ghat near SaraighatBridge the average annual floods recorded was 16,000 cubic meters per second. During floods water discharge reaches its peak and the yearly average peak flow recorded was approximately 51,000 cubic meters per second.[8] At its mouth in Bangladesh, the average annual discharge of the river is 19,830 cubic meters per second. This is the fourth highest average annual discharge in the world. For the river Brahmaputra the highest daily discharge was recorded in August 1962 at Pandu which was 72,726 cubic meters per second. The lowest daily discharge at the same place was 1757 cubic meters per second in February 1968.[9]

Satellite image of the river Brahmaputra (2008) just downstream of Guwahati city indicating intense braiding. width of the river at pandu is 1.2 km but donstream is about 18km. Source: ‘Riverbank erosion: a perspective” a presentation by Dr. Bipul Talukdar, Assam Engineering College
Satellite image of the river Brahmaputra (2008) just downstream of Guwahati city indicating intense braiding
Source: ‘Riverbank erosion: a perspective” presentation by Dr. Bipul Talukdar, Assam Engineering College

Though the Brahmaputra has been described as a braided river, recent studies have shown that the river does not fit into the conventional definition of braided river. A recent study states “In the study reach of the upper Assam area, the Brahmaputra appears to be a multichannel and multi-pattern river that has a tendency to very frequently generate ananabranching[10] (Latrubesse, 2008) pattern in decadal scale.” [11]

The Brahmaputra has been widening its (riverbed) size continuously from the last century. Reports from Water Resource Department showed that in Assam the river Brahmaputra was spread over for 4000 sq km in 1920 but in 2008 this has increased to 6000 sq km.[12]

The Brahmaputra along with several of its major tributaries like Subansiri, Jia Bharali, Manas had very high water yields[13]  which are higher than most of the major rivers in the world. The reason behind such high water yield for Dr. D.C. Goswami, one of the renowned environmental scientist from Assam is “High monsoon rainfall in the upper catchments and their steep gradients are considered to be the major factors responsible for the high rates of unit discharge which in turn help generate the high sediment yield from the basin and contribute significantly towards causing drainage congestion in the valley.”[14]

Seismicity and Brahmaputra Basin

The Brahmaputra river basin and its adjoining hill ranges are seismically very unstable because it is located in the Eurasian (Chinese) and Indian tectonic plates. The most severe earthquakes with Richter magnitude 8.7 was recorded twice in the valley, in 1897 and 1950. The latter one particularly had severe impacts on the river Brahmaputra. As a result of this earthquake river bed was raised at least by three meters at Dibrugarh which had increased the flood and erosion intensity of the river. In the opinion of geomorphologists “the region’s active seismicity has a significant impact on the hydro-geomorphic regime of the Brahmaputra system of rivers, causing landslides that result in the natural damming of rivers, flash floods due to the bursting of landslide-induced temporary dams, raising of riverbeds by siltation, fissuring and sand venting, elevation of existing river and lake bottoms and margins, creation of new water bodies and waterfalls due to faulting.”[15]

Climate Regime

The Brahmaputra in its path from snow covered mountains of Himalaya to the deltaic flood plains of Bangladesh covers different climatic regimes. The mean annual rainfall in the Brahmaputra basin excluding the Tibetan portion is 2300 mm.  The distribution of rainfall is different at different parts of the basin. In the southern slopes of Himalaya the rainfall is over 6000 mm but in parts of Nagaland this is 1200 mm. The monsoon rainfall (June to September) contribute 60-70% to the annual rainfall of the basin.[16]

In this basin, areas which are above or equal to the elevation of 1500 m experience snowfall. In the Indian part of Brahmaputra basin there are 610 glaciers which covers an area of 928.91 sq km and the volume of these glaciers are 49.57 cubic km. Out of these 449 glaciers are in Teesta basin and 161 glaciers are in Arunachal.[17]  In the Brahmaputra basin, Himalayan snow and glacial melt waters play a very significant role in water availability and climate change will have severe impacts on this. Climate change will also impact the rainfall and snowfall pattern in the Brahmaputra basin. This issue needs more serious attention and we will come up with more detailed blogs on this.

Bio-Diversity in the Brahmaputra Basin

The Lohit flooplains, immediately dowsntream of Lower Demwe HEP, constitute an Important Bird Area as per international criteria and is also a potential Ramsar site Photo: Neeraj Vagholikar
The Lohit flooplains, immediately dowsntream of Lower Demwe HEP, constitute an Important Bird Area as per international criteria and is also a potential Ramsar site
Photo: Neeraj Vagholikar

The Brahmaputra river basin hosts very rich and unique bio-diversity. The whole of northeastern region is a globally recognized bio-diversity hot spot.  In the Indian territory the total forest cover of the Brahmaputra basin is 1,14,894 sq. km. which is 54% of the total basin area. In the distribution of forest cover among 6 states in Brahmaputra basin, Arunachal Pradesh tops the list with 82.8% forest cover but it is sad that the highest number of hydro-electric dams are planned in this state inviting disastrous impacts for the biodiversity, forests, people and environment. The tally of rest of the five states is as follows – Nagaland (68.9%), Meghalaya (63.5%), Sikkim (38.1%), West Bengal (21.4 %) and Assam (20.6 %).

Besides, the aquatic bio-diversity of the Brahmaputra and its tributaries is also very rich. Here we should also take the case of ‘beel’ or wetlands in the Brahmaputra flood plains which according to experts work as ”ecotonal zones” and ”play an important role in the dynamics of the Brahmaputra ecosystem, as these are natural feeding and breeding grounds for a number of fish species and other aquatic fauna.”[18]

Flood and Erosion

Brahmaputra river basin is known to be very prone to flood and erosion and these two hazards have led to many problems in the basin. In India, out of the eight northeastern states, Assam faces the most severe brunt of flood and erosion. Both flood erosion has been severely affecting the economy as well political, social and cultural milieu of Assam.

Experts opine that natural as well anthropogenic factors lead to devastating floods in northeastern region. “The unique geo-environmental  setting of the region vis-à-vis the eastern Himalayas, the highly potent monsoon regime, weak geological formation, active seismicity, accelerated erosion, rapid channel  aggradations, massive deforestation, intense land use pressure and high population growth especially in the floodplain belt, and ad hoc type temporary flood control measures are some of the dominant factors that cause and/or intensify floods in the Brahmaputra and the Barak basins (Goswami, 1998).”[19] The Brahmaputra river basin is also prone to flash floods and some of the worst flash floods have occurred in the valley in the new millennium.

Along with floods, erosion is also threatening the lives of the people in the state of Assam as it leads to permanent loss of land.  Here we can take the case of the river island Majuli, which had been one of the worst sufferers of the erosion done by Brahmaputra. In 1853 the total area of Majuli was 1129 sq km but it has now reduced to 3.55 sq km.[20]

Ilish fishing, Dauladia, Bangladesh, 2001 Source: http://www.npr.org/blogs/pictureshow/2011/11/14/142219164/capturing-the-unseen-side-of-bangladesh
Ilish fishing, Dauladia, Bangladesh, 2001
Source: http://www.npr.org/blogs/pictureshow/2011/11/14/142219164/capturing-the-unseen-side-of-bangladesh

In Bangladesh the Brahmaputra river which known as Jamuna is also infamous for severe floods and erosion. The river carries huge water and sediment discharge in this deltaic region. Because of its geographical setting, Bangladesh is very much dependent on its river for fertile fields and diverse flora and aqua culture but rivers also brings several hazards in the form of floods and erosion. Bangladesh has witnessed severe annual floods but the floods in 1987, 1988, 1998 and 2004 were the most severe ones in recent decades. But studies have shown that, “The people of Bangladesh have adapted their lifestyle for centuries to live with river flooding – frequently moving their temporary bank-side homes, planting on newly emergent river bars, and sometimes raising their homesteads above water level in flood periods (Paul, 1997). However, a growing population, coupled with the expansion of infrastructure and economic development, has resulted in an increase in the intensity of flood damage (FPCO, 1995; Paul, 1997; CPD, 2004). The lives of many millions of Bangladeshi citizens is thus reliant on these rivers, with up to 600,000 people living on the riverine islands and bars alone (Sarker et al., 2003).”[21]

In order to protect people from the fury of floods and erosion the main measure taken in India as well in Bangladesh is the construction of embankments. In Assam the total length of embankment is 4,473.83 km constructed on a total of 130 small and big rivers. But recent reports say that out this, 3376 km embankments are in a vulnerable condition and need immediate strengthening and repair.[22] As a deltaic region Bangladesh too has put its thrust on increasing length of embankments. In 1989 Bangladesh launched an elaborate flood control programme through construction of embankments which was named as ‘Flood Action Plan’. But this plan was vehemently criticized both at national and international level.

Protest against big dams – KMSS (Krishak Mukti Sangram Samiti) members protesting in Pandu Ghat in Guwahati against the ship carrying the turbines for the Lower Subansiri project. Source: http://peakwater.org/wp-content/uploads/2011/07/Lower-Subansiri-turbines-protest.preview.jpg
Protest against big dams – KMSS (Krishak Mukti Sangram Samiti) members protesting in Pandu Ghat in Guwahati against the ship carrying the turbines for the Lower Subansiri project.
Source: http://peakwater.org/wp-content/uploads/2011/07/Lower-Subansiri-turbines-protest.preview.jpg

In order to control the floods in Brahmaputra valley one of the proposed solution is construction of multi-purpose dams. In fact flood control was one of the pretexts for hydro-development in the northeastern region. But the idea that multipurpose dams can lead to flood control along with hydro-power generation is actually contradictory and unviable as seen from experience of such projects. Studies done on some of the biggest multi-purpose river valley projects of independent India, e.g. ‘Unravelling Bhakra’ by Shripad Dharmadhikary, ‘Drown and Dammed’ done on Hirakud by Prof Rohan D’Souza, “One Valley and a Thousand: Dams, Nationalism, and Development, Studies in Social Ecology & Environmental History” on Damodar Valley dams by Daniel Klingensmith have shown how unviable this proposition is. A number of these dams have actually created avoidable flood disasters in the downstream areas due to wrong operation of the dams[23]. In case of the mightly Brahmaputra river, this is likely to prove even greater disastrous considering its characteristics described above.

Today Brahmaputra valley is witnessing severe opposition against hydro-power dams.  The struggle against the Lower Subansiri hydro-electric project can be regarded as milestone. In the Brahmaputra valley the hydropower projects have been opposed also because of the impacts which it will going to have in the downstream as well as on the biodiversity, seismicity, society and culture of one of the most ecological sensitive areas. .

Institutional Mechanism over Brahmaputra in India

The Brahmaputra Board is the foremost body on Brahmaputra established by Government of India under an Act of Parliament i.e. The Brahmaputra Board Act, 1980 (46 of 1980) under the Ministry of Irrigation which now renamed as Ministry of Water Resources. The main task entrusted on Brahmaputra Board is ‘planning and integrated implementation of measures for the control of floods and bank erosion in the BrahmaputraValley and for matters connected therewith.’ Both Brahmaputra and Barak valleys are under the jurisdiction of Brahmaputra Board. Even though this independent board was established to better manage the flood and erosion problem of the two river basins, but its activities have come under severe public criticism. Besides Brahmaputra Board, the State Water Resource Department and Central Water Commission also looks after water issues in the river basin. Recently international funding agency Asian Development Bank (ADB) has come to be associated with flood and erosion control in the Assam but from the experiences of Bangladesh, the advent such agencies must be dealt with precaution.

Brahmaputra Valley as the Point of Confluence for People and Cultures

The Brahmaputra is a dynamic river whose dynamism is not only limited to its physical characters or features of the river, but immersed in social, political, economic and cultural aspects. The Brahmaputra valley has been the space of assimilation for people from different races and the one can find large variety of languages and dialects being spoken in this valley. The northeastern region falls under the Brahmaputra and Barak River basin[24] which is home for more than 166 separate tribes, 160 scheduled tribes and over 400 other tribal and sub-tribal communities and groups, speaking a wide range of languages (Climate Change in India: A 4×4 Assessment, 2010). The northeastern region can also be considered as an ‘ethnological transition zone’ between India and the neighbouring countries of Bhutan, Tibet, Burma and Bangladesh. In this region one can find 220 languages belonging to three language families – Indo-Aryan, Sino-Tibetan and Austric.[25]

Relevance of Brahmaputra for Assam

For Assam, the state located at the center of the northeastern region, the river Brahmaputra paves its way through this state like the lifeline of the state. The river ‘Brahmaputra’ literally means ‘Son of Brahma’. It is also one of the few rivers in India which is regarded as a ‘male’ river. There are several myths and legends about the Brahmaputra’s origin and we will bring those together in our coming blogs.

Bogibeel, the fourth bridge on Brahmaputra is under construction between Dhemaji and Dibrugarh district. Photo – Parag Jyoti Saikia

In Assam Brahmaputra River is also known by several other names  i.e. ‘Luit’, ‘Siri Luit’, ‘Bor Luit’ ‘Bor Noi’. For the people of Assam, the Brahmaputra is a symbol of great pride due to its ‘moving ocean’ size but this also ignites fear when it rises to its strength during floods. People of Assam have faced difficult times when the river has come to its full strength. Famous singer Jayanta Hazarika wrote, when he formed ‘Xur bahini’ to gather relief for flood victims “Luitor Bolia baan, toloi koloi nu dhapoli meliso, hir hir sowode kal roop dhori loi kaak nu bare bare khediso (Oh the maddening floods of Luit, where are you heading this time. Whom are you chasing again with frightening sound of your waves)”.

But this river is also the source of strength for the people of Assam. Time and again, they have expressed their unity as ‘Luitporia’ or ‘people from the banks of Luit’. The famous cultural icon of Assam, Jyoti Prasad Agarwala wrote in 1942 during Indian Freedom movement “Luitor parore ami deka lora, moriboloi bhoi nai (we are the youth from the banks of Luit and we don’t have any fear of death)”.  For another legendary cultural icon, Dr. Bhupen Hazarika  who is known as the bard of Brahmaputra, the river’s power of destruction was the source which will awaken the people. In his famous song “Bistirno parore” he asked the river – “Sahasro barishar, unmadonar, avigyotare, pangu manobok sawal songrami aru agrogami kori nutula kiyo (with your maddening experience of thousand monsoons, why don’t you arouse the disabled human beings for struggle and progress)”.

This blog is a small step to document the various aspects of the river Brahmaputra. It is the need of the hour since a flood of dams are proposed to submerge the Brahmaputra valley. Chinese plans of dam construction is not very much in the public domain but the impacts of dam construction of in the upstream Tibet will have severe impacts on the Brahmaputra river. Besides, the bogey of Chinese threat to divert the waters of Siang is used by the Indian government to push for rapid dam construction sidelining all the social, environmental, safety, sustainability, climate change concerns and impacts on the river ecosystem. The government very shamelessly has also put aside all the democratic processes to push for rapid dam construction. Though there is no proposal for a dam on the Brahmaputra in Assam, there are proposals to dam its major upstream tributaries.  This upsurge of dams, if they do get constructed will have huge impacts on the Brahmaputra River which are yet not known due to lack of credible projects specific or cumulative impacts assessment studies. These studies should include issues like  the river ecosystem, river bio-diversity, forests and wildlife, climate change, floods and erosion and economic and socio-cultural impacts. However, we are hopeful that the ongoing struggles against such unjustifiable projects will succeed and all these projects won’t come up. Through a series of blogs we will also try to bring together all these different streams of concerns.

Himanshu Thakkar, Parag Jyoti Saikia

South Asia Network on Dams, Rivers & People (www.sandrp.in)
Email: ht.sandrp@gmail.com, meandering1800@gmail.com


[1] Lahiri, S.K., Sinha, R., Tectonic controls on the morphodynamics of the Brahmaputra River system in the upper As-sam valley, India, Geomorphology (2012)

[2]EnvironmentAssessmentReport  SiangBasin In Arunachal Pradesh, Interim Report June 2012, Prepared for Central Water Commission(CWC

[3] Lahiri, S.K., Sinha, R., Tectonic controls on the morphodynamics of the Brahmaputra River system in the upper As-sam valley, India, Geomorphology (2012)

[5]GoswamiD.C., “Managing the Wealth and Woes of the River Brahmaputra” available at http://www.indianfolklore.org/journals/index.php/Ish/article/view/449/514

[7]EnvironmentAssessmentReport  SiangBasin In Arunachal Pradesh, Interim Report June 2012, Prepared for Central Water Commission(CWC)

[9] Goswami D.C., “Managing the Wealth and Woes of the River Brahmaputra” available at  http://www.indianfolklore.org/journals/index.php/Ish/article/view/449/514

[10] An anabranch is a section of a river or stream that diverts from the main channel or stem of the watercourse and rejoins the main stem downstream.

[11] Lahiri, S.K., Sinha, R., Tectonic controls on the morphodynamics of the Brahmaputra River system in the upper As-sam valley, India, Geomorphology (2012)

[13] Water yield means volume of water drained by unit area of the basin.

[14] “The Brahmaputra River”, India  by D.C. Goswami and P. J. Das in The Ecologist Asia Vol. 11 No 1 January- March 2003

[15] ibid

[16] ibid

[17] “Water Sector Options for India in a Changing Climate” by Himanshu Thakkar, SANDRP, New Delhi, March 2012

[18] ‘Stemming the Flood, Killing Biodiversity’ by Dr. Sanchita Boruah and Dr. S.P. Biswas in The Ecologist Asia Vol. 11 No 1 January- March 2003

[19] Goswami D.C., “Managing the Wealth and Woes of the River Brahmaputra” available at  http://www.indianfolklore.org/journals/index.php/Ish/article/view/449/514

[24]Barak River is located in south Assam and also an international river but smaller than the Brahmaputra.

Hydropower · Hydropower Performance · Indus

HydroPower Performance in Indus Basin

Indus river rises in the southwestern Tibet Autonomous Region of China. Originating in the Tibetan plateau of western China in the vicinity of Lake Mansarovar in Tibet Autonomous Region, the river runs a course through the Ladakh district of Jammu and Kashmir and then enters Pakistan via the Northern Areas (Gilgit-Baltistan), flowing through the North in a southerly direction along the entire length of Pakistan, to merge into the Arabian Sea near the port city of Karachi in Sindh.

The Sub-basin wise generation data of large hydro with installed capacity of the basin in the latest year 2012-13.

Projects

Inst Capacity  (MW)

Generation (MU)

MU/MW

Sutlej

4534.3

18979

4.19

Beas

2267

9125

4.03

Ravi

2059

7383

3.59

Chenab

1530

8159

5.33

Jhelum

690

3828

5.55

Total

11080.3

47474

4.28

indus

  • The above graph shows the trend line of power generation of Big Hydropower projects for last 28 years in the basin, the trend-line shows diminishing generation from existing hydro power projects of Indus River Basin.
  • It shows that the per MW generation in 2012-13 (4.28) has dropped by a huge 17.69% from the highest per MW generation (5.2) achieved in the year 1988-89.
  • All generation figures have been taken from official data of Central Electricity Authority (CEA).

List of other projects (up to 25 MW) under operation (for which latest generation figures not available):

SN Project

Ins Cap (MW)

State

In main basin


1 Iqbal

3.75

Jammu & Kashmir
2 Hunder

0.40

Jammu & Kashmir
3 Sumoor

0.10

Jammu & Kashmir
4 Igo-Mercellong

3

Jammu & Kashmir
5 Haftal

1

Jammu & Kashmir
6 Marpachoo

0.75

Jammu & Kashmir
7 Bazgo

0.30

Jammu & Kashmir
8 Stakna

4

Jammu & Kashmir
Total

13.30

In Sub Basins
1 Sutlej

31.55

Himachal Pradesh
2 Beas

61.8

Himachal Pradesh
3 Ravi

110.6

HP, J&K and Punjab
4 Chenab

33.8

Jammu & Kashmir
5 Jhelum

51.6

Jammu & Kashmir
 

Grand Total

302.65


Source: http://www.hpseb.com/hydro_potential.htm

http://jkspdc.nic.in/exist.htm

List of proposed and under construction projects in the basin:

  Project

Ins Cap (MW)

State

Status

In Main Basin


1 Rongdo

9

Proposed IPP Project
2 Bairaas

9

Proposed IPP Project
3 Tamasha

9

Proposed IPP Project
Total

27

In Sub Basins
1 Sutlej

6055

Himachal Pradesh
2 Beas

3270.1

Himachal Pradesh
3 Ravi

1292

HP, J&K
4 Chenab

8225

HP, J&K
5 Jhelum

864.55

Jammu & Kashmir
Grand Total

19733.65

Source: http://jkspdc.nic.in/up.htm

http://www.hpseb.com/hydro_potential.htm

http://envfor.nic.in

Map of Hydroelectric Projects in Indus River Basin available at:

https://sandrp.in/basin_maps/Hydropower_Projects_in_Indus_Basin.pdf

South Asia Network on Dams, Rivers & People (www.sandrp.in)                                           July 2013

ht.sandrp@gmail.com

Assam · Floods

CWC Flood Forecast 2013 for Assam: Issues Started Arriving before Floods

The season of flood havoc has just started in Assam. The Assam State Disaster Management Authority in its daily report published on 28th June 2013, stated that in the last 24 hours 55 villages in Dhemaji, Lakhimpur and Tinsukia district have been affected by flood. All three of these districts are located in upper Assam and three of them shares borders with Arunachal Pradesh. Dhemaji till now is the worst affected among these three. In this district, 13 villages in Dhemaji revenue circle, 28 villages in Sissiborgaon revenue circle and 7 villages in Gogamukh revenue circle has been affected. In Lakhimpur 1 village in Subansiri revenue circle and 6 villages of Doomdooma revenue circle in Tinisukia district has been affected by floods. The report also said that the cumulative number of villages affected till 28th was 70 in four districts which include Golaghat, Kamrup, Jorhat and Karimganj. Continue reading “CWC Flood Forecast 2013 for Assam: Issues Started Arriving before Floods”

Arunachal Pradesh · Assam · Hydropower

Review of “Water Conflicts in Northeast India – A Compendium of Case Studies”: A Welcome Initiative

Forum for Policy Dialogue on Water Conflicts in India (Forum hereafter) has published its latest compendium titled ‘Water Conflicts in Northeast India – A Compendium of Case Studies.’ Forum since its inception has been working towards documenting water related conflict in the country. Forum has already earlier published a book titled ‘Water Conflicts in India: Million Revolts in the Making’ where they published 63 case studies of conflicts related to water from all over India.

In the NE compendium, Forum has put together water related conflict case studies from the northeastern region of India. This is the first document from northeast where issues related to water sectors has been put into the framework of conflict and analyzed. Northeast is already witnessing a lot of hue cry regarding water issues. These issues include annual flood havoc in the Assam valley, the unprecedented rise in hydropower construction in Arunachal Pradesh, the threat of water diversion by China in the upstream of Brahmaputra, shortage drinking water in towns and hill areas etc. The northeastern region is surrounded by international boundaries and linked to mainland India though a 27 km wide Siliguri corridor. The Brahmaputra and BarakRivers, two of the major rivers in the region along with many of their tributaries are international rivers. Therefore water related conflicts in the region carry a lot of geo-political importance. However, from the side of government of India the thrust today is for hydropower development and bargain for water sharing with China.

Cover of the Compendium

Different Cases with Inherent Conflicts:

This compendium has 18 case studies which covers several important issues related with water in the region.  This compendium also has 3 chapters along with the note from the editors which brings to fore the rationale for this compendium.  Out of the 18 case studies nine case studies deal with hydropower development. Rest of the nine case studies brings to light other burning issues related with water in the region.

The introductory chapter is an article titled ‘Damming of rivers and Anthropological Research: An Introductory Note’ written by Dr. A.C. Bhagbati, a renowned social anthropologist from northeast. Dr. Bhagbati wrote this article in 1983 but there are several issues which are still relevant.  The time when he wrote this, the feasibility report for Ranganadi Hydroelectric project was prepared and lower Subansiri project was still in papers. During that time possibly he was the only one who expressed concerns for the social-ecological consequences of dam construction in the region. He said that no anthropological research was incorporated in development planning of the country at that time and impacts of dam on local inhabitants receives attention as a mere technical question in the survey report prepared for the dams. The situation has not changed much even though 30 years have passed.

Natural Resources and Impact on Water:

There are two case studies, which analyse the process of natural resource extraction in the region and how it is affecting the water resources in the area. The first case study “Seismic Survey for OIL in the Brahmaputra River Basin: Scientific Understanding and People’s Perceptions” deals with how lack of transparency of concerned authorities regarding the technologies used for seismic surveys as well as oil exploration and their likely negative impacts coupled with uneven sharing of costs and benefits have resulted in differing perceptions and contestations in Assam.

The other case study named  “The Barak River: Conflict around the impending Oil Extraction in Manipur” talks about the impending oil extraction in Manipur and how it can worsen the conflicts in the region around the Barak river from its source in Manipur through Assam and up to Bangladesh.  The case study also brought the issue of water contamination through oil extraction.

Drinking Water Safety and Security:

The next set of two case studies ‘Water Quality in Assam: Challenges, Discontent and Conflict’ and ‘Conflicts over Drinking Water in Tripura’ brings to fore the problems of drinking water safety and security in the region. Even though the first case study is not focused on a specific area, it discusses the overall situation of water quality and the problems of water contamination due to arsenic, fluoride & other heavy metals along with bacteriological contamination. The second case study discusses how drinking water shortage becoming acute in the state of Tripura and how it is impacting the people living in urban areas as well in the refugee camps.

Embankment and Erosion – Failure of structural measures:

The case study ‘Jiadhal River Catchment: Conflicts over Embankments’ by Partha J Das discusses issue of frequent changing of river course Jiadhal river and how it is failing all the structural measures taken in the state. This case study also presents the dynamic and unpredictable nature of the rivers in the region and how human interventions in the river, e.g. embankments can do no good to ‘protect’ the people from the fury of the river.

The case study by Sidharth Kumar Lahiri ‘Riverbank Erosion in Rohmoria: Impact, Conflict and Peoples’ Struggle’ is focused on the worst erosion affected area of Assam, Rohmoria (in Dibrugarh district in upper Assam) which has witnessed the loss of 30 revenue villages, 5 huge tea gardens and 1 state government run sericulture firm along with 7 schools, police station and post office buildings. The rapidity of erosion in the region was such that no structural measures did any good to stop this. This case study also shows the nature of resource orientated state as government started giving attention to this area only after the oil-blockade, started in 1999. In both these cases there were open confrontation of people and government forces as the people staged protests, dharnas and road-blocks demanding solutions.

Transboundary River issues:

The two case studies ‘The Kurichu Project in Bhutan: Transboundary Hydropower Projects and Downstream Impacts’ and ‘Uncharted Waters: Navigating the Downstream Debate on China’s Water Policy’ details about the transboundary nature of rivers in the northeast and how this is adding to the complexities of water conflicts in the region. The first case study talks about the catastrophic flash floods which occurred on 10 July 2004 due to the bursting of the Tsatichu landslide dammed lake in Bhutan. This had led too flash floods in the Manas and Beki rivers and submerged parts of the Barpeta and Nalbari districts in downstream Assam.

The latter case study by Nimmi Kurien, discusses the Chinese plans of hydropower development and water diversion and its role in the water dynamics of northeast. This case study analyses the China’s water resources choices in its overall water policy directions, the possible conditions under which the China is planning to exercise these choices, the ripple effects they are likely to have across the borders and some key concerns that have flown downstream. This case study indicates that hydro-power projects in China has given an impetus to Indian government to build mega dams in the sub-basins of the Siang, Lohit and Subansiri rivers to establish first-user rights over the water. In doing so, India has kind of sidelined all the environment and ecological concerns.

Case studies on Hydro Power Projects:

The next set of nine case studies is focused on issues related with hydropower dams in the northeast. These nine case studies are from Manipur, Sikkim, Arunachal Pradesh and Assam. This region has been identified as the future powerhouse of the country and as a result the region is witnessing rapid increase in the proposals for construction of hydropower dams in the region.  In fact MoUs for 157 dams in a single state of Arunachal Pradesh has been signed, damming almost all the free flowing rivers in the state. Due to the staggering number of MoU former Union Minister of Environment and Forests Jairam Ramesh had once opined that the state was infected by ‘MoU Virus’.

It can be observed that though these case studies are located in different states, they bring together similar issues or instances which in a way lead to the larger critique of the hydropower development regime in the region.

Impacts of Tipaimukh Dam in Manipur:

The case study by R. K. Ranjan Singh titled “Tipaimukh High Dam on the BarakRiver” states that construction of the Tipaimukh dam will lead to permanent displacement and loss of livelihoods of indigenous communities, mostly belonging to the Zeliangrong and Hmar people. This dam was originally planned for flood control but later on a hydropower element was added to it. The constriction of the dam has been questioned due to several critical grounds which include geological and seismic factors, environmental impacts, downstream impacts which extends up to Bangladesh, conservation of socio-cultural heritage, impacts on health and hydro dynamics of the dam itself. The case study states that a total of 25,822 hectares of forest area in Manipur will be affected by this which will lead to felling of 7.8 million trees. If this happens this will invite serious climate change impacts.

Impacts of Hydropower projects in Sikkim:

Dams underconstruction and planning in Teesta Basin, Sikkim. Map by SANDRP

The three case studies on hydropower development in Sikkim presents situation where the indigenous people of the state have been shown a false dream of development through hydropower generation. The three case studies brings an in depth analysis of the fall out of hydro-development on the rivers and environment as well as how it is impacting the lager political arena in this small Himalayan state.

In the case study ‘Hydropower Projects on the Teesta River: Movements against Mega Dams in Sikkim’ the author Tseten Lepcha discusses the detrimental impacts of many hydropower projects on the ecosystem, livelihoods, religion, cultural identity, political rights of the people and demographic changes due to influx of outsiders for dam construction. The story of the valiant struggle of the project affected people under the banner of Affected Citizens of Teesta (ACT)’s can also be found here.

The case study by Ghanashyam Sharma and Trilochan Pandey titled ‘Water Resource Based Developments in Sikkim: Exploration of Conflicts in the East and West Districts’ describes how the government’s strategy of increasing state’s revenue through the hydropower route has been putting a huge stress on the local environment, the people and the culture.

The case study ‘Hydropower in Sikkim: Coercion and Emergent Socio-environment Justice’ by Amelie Huber and Deepa Joshi, brings to light that the new hydropower development discourse is couched in ostensible win-win scenarios: securing energy for the rapidly developing national economy, accelerating development hitherto ‘backward’ but hydro-potent areas; and generating ‘clean’ energy and thus taking the discourse away from the earlier dam related critique.

Four Case studies on Hydropower Development in Arunachal Pradesh:

There are four case studies on the hydropower development in Arunachal Pradesh and these case studies show the extent of damage which the construction of dams will do to the environment, society, culture and economy of the state. The greed of the state government for hydro-dollar is actually eroding societal values and rich bio-diversity of the state.

Hydropower Dams in various stages in Arunchal Pradesh. Photo Courtesy: International Rivers

The case study by Raju Mimi, titled ‘The Dibang Multipurpose Project: Resistance of the Idu Mishmi’ is focused on the Dibang Multipurpose project in the Dibang basin in Arunachal Pradesh and discusses two main issues of conflict. Firstly, the underlying justification of the project on grounds of economic viability as the displacement is considered to be negligible. Secondly the fear of Idu Mishmi’s of demographic imbalance in the Dibang valley due to huge influx of outside labourers for dam construction. The case study highlighted that total population of Idu Mishmi’s is only about 11,000 whereas the planned 17 projects in the Dibang basin will bring about 100,000 outsiders.

In this compendium there are two case studies on the Demwe Lower Hydro-Electric Project which is the lower most project of the 11 projects in the Lohit river basin and will be constructed near Parshuram Kund, culturally significant site. The LohitRiver enters the plains leaving the hills just after this site.

The first case study by Girin Chetia titled ‘Damming the Lohit: Claims and Counter Claims’ brings to light that even though there are 11 hydropower projects proposed in the Lohit river basin but no cumulative impact assessment study has been conducted for the river basin. Besides, the Demwe Lower project is situated in the border of Arunachal Pradesh and Assam but no downstream impact assessment have been taken up to assess the impacts on densely populated plains in Assam.

The second case by Neeraj Vagholikar ‘Demwe Lower Hydroelectric Project in LohitRiver Basin: Green Clearances Bypass Ecological and Socio-Cultural Concerns’ analyses this project from the perspective of environmental governance. The author shows that this proposed project violates various environmental and wildlife related laws in the country. The Expert Appraisal Committee (EAC) had prescribed a cumulative impact assessment of multiple projects in the Lohit river basin; it delinked the environment clearance of the Demwe Lower and Demwe Upper from the results of the Lohit river basin study.  There was also no public hearing held for this project in downstream Assam.

The case study by Azing Pertin titled ‘The Lower Siang Hydropower Project: A Peaceful Valley Erupts’ is focused on the proposed 2700 MW Lower Siang HEP one of the series of projects proposed in the Siang Basin. The project faced vehement opposition, led by Adi Student Union(AdiSU), Siang People’s Forum and Forum for Siang Dialogue on the grounds of social and ecological destruction – submergence of large tracts of forests and agricultural landscapes, destruction for rivers, massive socio-cultural and demographic changes, very little opportunity of sustainable livelihoods, increased seismicity in the region, and other major downstream impacts.

Dam induced Flood in Assam:

The case study titled ‘The Kopili Hydro-Electric Project: Downstream People Rise in Struggle’ is the only case study of a dam located in Assam. This case study presents how the excess water released from the Kopili Hydro Electric Project, led to floods in the downstream on 21 and 22 July, 2004. Due to this flood nearly one lakh people had to flee from their homes and the economic loss was immense. The calculations presented for a single farmer in the case study shows the extent of damage. This case study is very significant in order to present the situation of people leaving in the downstream of a dam.

The last case study ‘State Water Policy of Assam 2007: Conflict over Commercialising Water’ by Chandan Kumar Sharma shows that the draft State Water Policy 2007 bears clear signal for commodification of water and provides for river linking and construction of big dams. The author argues that this draft of state water policy was made by the state government under the pressure of the union government to fall in line with the National Water Policy where not much civil society participation was allowed. But civil society’s vehement objection and pressure on draft had resulted in making the community as the primary repository of rights to water, says the paper. While  this may be true, this is difficult to ascertain since the state government has not finalised the water policy and final water policy is not available in public domain.

The compendium has two concluding chapters. The article ‘Water Conflicts in Northeast India: The Need for a Multi-track Mechanism’ by N.G. Mahanta is focused on the approach to be adopted in order to engage with water conflicts in the northeastern region. The author opines that large dams can further intensify the conflicts over water in the region.

The article by Sanjib Baruah titled ‘Whose River is it, Anyway? The Political Economy of Hydropower in the Eastern Himalayas’ was first published in Economic and Political Weekly and it is reproduced here. Though article focuses particularly on the Lower Subansiri project, but it also discusses most of the issues which have been addressed by various case studies in the compendium. In the article the author highlights that the government of India is aiming to take the ‘great leap forward in hydropower generation’ in the coming years and this will be done majorly on the basis of the hydropower projects in northeast. According to a vision document of Central Electricity Authority, by 2025-2026, India aims to add 400 hydropower dams with a total capacity of 107,000 MW. Out of this, according to CEA estimates Northeast India could generate as much as 58,971 MW of hydropower. Arunachal Pradesh alone has the potential of producing about 50,328 megawatts of hydropower – the highest in the country. A report published in Down to Earth in September 2011 stated that government of Arunachal has signed memoranda of understanding for 148 hydropower projects. An estimate done by Human Rights Law Network shows that, in a ten-year period, Arunachal Pradesh proposes to add hydropower capacity which “is only a little less than the total hydropower capacity added in the whole country in the 60 years of Independence.” In his article Baruah concludes that with so many dams in the upstream people of northeast, specially Assam have to live with the risk of sudden floods and at the mercy of the dam authorities.

Critical Issues:

The issues mentioned in this compendium bear great significance for the economy, polity and society of the northeastern region. This compendium was an opportunity to bring together water related issues of the region under one umbrella and the Forum has been successful in doing so. However there are a few critical issues which we would like to point out.

In the concluding chapter by Sanjib Baruah and as well as in the editorial it was highlighted that there is a fundamental difference “between the hydropower projects of postmillennial India and the multipurpose river valley projects of an earlier period in India’s postcolonial history. In the mid-20th century large multi-purpose river valley projects were taken up, to develop river basin region. They were driven by the spirit of decolonization itself…. by contrast, what is bring designed and built these days are almost all single-purpose hydropower dams with power to be produced and sold for profit by private as well as public sector companies.”  It is clearly a wrong proposition that in mid 20th century large multi-purpose RVPs were the best options before the society than or were taken up in any participatory democratic way. History shows that the dams have actually created more flood disasters where there need not have been any. There are many other serious issues of performance of large dams in post Independent India.

In the concluding chapter by Sanjib Baruah, I also find it difficult to agree with the opinions made citing John Briscoe. The author said quoting him ‘In the Brahmputra Basin, there are large benefits from multi-purpose storage projects that are being forgone because power companies are licensed to develop “power only” projects, which are typically run-of-the river projects with few flood control or navigation benefits’. The idea that multi-purpose projects can be an optimum option for northeast is very problematic. Some of the issues with such projects can be found in the case study by Raju Mimi in the same compendium. In the conclusion part again quoting Briscoe (in fact quoting Briscoe, a senior officer of the World Bank who served for long in India and Brazil in early years of current millennium is seriously problematic since he stands discredited for his rabidly pro large dam views and who campaigned to ensure that the World Commission on Dams report was not adopted by the World Bank) Baruah writes, “unfortunately, despite there being a history of successful multipurpose projects in India, the Government of India now does not have an enabling framework which facilitates the same socially-optimal outcomes.” Here again we fail to find where is the successful history of multipurpose projects in India. There are detailed critiques available of some of Independent India’s biggest multi-purpose river valley projects, including those for Bhakra(“Unravelling Bhakra” by Shripad Dharmadhikary), Hirakud (by Prof Rohan D’Souza and others), Damodar Valley Projects (“One Valley and a Thousand: Dams, Nationalism, and Development, Studies in Social Ecology & Environmental History” by Daniel Klingensmith among others). SANDRP has been monitoring dam related concerns for more than a decade now and we find it hard to agree with this statement. For more details of SANDRP’s work one can look at the our website https://sandrp.in/ and our blog https://sandrp.wordpress.com/.

Though the case studies of the compendium have brought out several important concerns, some of the case studies need more detailed analysis.

The case study on seismic survey for oil exploration in the Brahmaputra brings to light a new dimension of water issues but could not justice to it. The case study said more about oil then water or river. There are several boxes which talks about the impacts of the seismic survey in a haphazard manner but those cannot be substantiated as an analysis of water conflict.

The case study on conflicts over drinking water in Tripura should include data of drinking water availability in the state. The author can dwell upon on each issue with more detailed emphasis or can take up one area out of the areas mentioned in the case study. The case study can also be substantiated through an analysis of policies on drinking water and sanitation in Tripura.

The case study on Kurichu dam project in Bhutan views the issue of trans-boundary conflicts between the two countries from a narrow perspective. The case study should have covered several more aspects of the Trans-boundary water issue.  Specifically the case study does not give any detail of how much damage actually happened on the ground. The larger political and economic rationale for hydro-development in the small Himalayan state could have given better idea of the conflict.

Besides, this case study should have also included the element of flash floods which could help in broadening the scope of the case study. In fact flash flood is one of the important water related issues in northeast. There was a severe flash flood in GaiRiver in Dhemaji district in upper Assam on 15 August, 2011. This was due to breaching of the earthen dam[1] in the upstream of the river. This flash flood had submerged 17 villages and diverted its path making its way through the villages. In fact the cover page of this compendium (photo by the author of this review) depicts the guide bundh of the Gai river railways bridge which was washed away by the same flash flood.

The case study on floods in KopiliRiver could have elaborated more on the aspect how dams were constructed with false promises to people. As the whole region is speculating about the impacts of hydropower development in Arunachal Pradesh, this case study actually brings to light the after effects of dam construction. However this case study too could have elaborated its scope by bringing a comparison with the Ranganadi river floods which submerged the Lakhimpur town and other areas on 28th June 2008.  This flood too was the result of water release from the upstream Ranganadi hydroelectric project.

The compendium overlooks some major issues related to floods which severely affect Assam every year. As the compendium wishes to cover water related issues in the region there should been a case study or a chapter dedicated to the overall situation of floods.

The compendium should have include issues related to climate change and impact on water in northeast, the trans-boundary issues with Bangladesh where India will be upstream state and hydropower dams which government of India wants to build in Mizoram. Though the impacts on Bangladesh was mentioned in some of the case studies, keeping the magnitude of the issue there should have been either a separate chapters on this. Analysis of water issues in northeast India from the perspective of gender is also missing in the compendium.

The compendium can also include a case study on the Pagladia dam project which was proposed in 1960s but faced strong opposition from the people. This project was seen as a multi-purpose project but even then people opposed it as they were aware of the inherent nature of the river. The name ‘Pagladia River’ means ‘mad river’ because it changes its course widely, drastically and suddenly.[2] This can also be taken as an example of how multipurpose river valley projects cannot be the answer to floods. According to the government records the project was supposed to be completed by 2008 but many say this project is out of the government’s priority list for now.

This compendium was released on 21st June, 2013 in a public function organized in Guwahati[3] and it was announced that this compendium will soon be out in the form of a book which will be useful. As first of its kind of initiative for northeast this compendium is very welcoming and we hope that the book will be able to bring the issues raised in the compendium in a more comprehensive and updated manner.

Parag Jyoti Saikia

South Asia Network on Dams, Rivers & People (www.sandrp.in)

Email: meandering1800@gmail.com


[1] According to local people living in the villages of the Gai river basin, the high amount of sand in river bed had formed an artificial lake in the upstream which got breached on the day the flash floods occurred.

[2] Bharali Gita, “Pagladia Dam Project in Assam: A Case Study”, Conference on Redressing Inequalities of Displacement by Development: Dams and Mines. Ranchi: Council for Social Development, November 6-8, 2004.

Arunachal Pradesh · Assam · brahmaputra · Floods

2012 Floods Displaced 6.9 Million in Northeast-IDMC: Staggering but Highly Exaggerated

According to a new report, the largest climate induced displacement in the world for the year 2012 happened

Cover of the IDMC Report on Disaster Induced Displacement

in two states of Northeast India, Assam and Arunachal Pradesh in June 2012 due to the monsoon floods which displaced 6.9 million people, constituting about 21.2% of the population of the two states[1]. This staggering fact was revealed in the report named “Global Estimates 2012 – People Displaced by Disasters” published by The Internal Displacement Monitoring Centre (IDMC) based in Geneva, Switzerland in May 2013. More people were displaced in India by natural disasters last year than in any other country, says the report. A closer scrutiny shows that the figure seems highly exaggerated, raising question mark over the accuracy of the work of IDMC and Norwegian Refugee Council (NRC), who jointly published the report.

IDMC is an international body monitoring internal displacement worldwide. This was established in 1998 by the NRC. IDMC defines displacement as a non volunteer nature of movement. People who are compelled to evacuate their homes in order to avoid the impacts or the threat of a disaster will come under this definition. But from this definition it is also clear that those people who are affected by any disaster but have not evacuated their place living will not be defined as displaced. IDMC states that majority of people who face displacement are internally displaced people (IDPs).[2]

Displacement by type of related hazard, 2012 and 2008-2012

Total displaced

Type of hazard

2012

2008-12

Flood

22,010,000

89,181,000

Storm/ Typhoon

9,603,100[3]

29,051,000

Earthquake(Seismic activity)

637,000

23,604,000

Extreme Cold

2,000

923,000

Landslide(wet)

47,000

577,000

Volcano

40,000

472,000

Wildfire

59,000

103,000

Landslide (dry)

200

3,200

Extreme Heat

1,700

1,700

TOTAL

32 400 000

143 900 000

This report states that in 2012, an estimated 32.4 million people in 82 countries were newly displaced by disasters associated with natural hazard events. Over five years from 2008 to 2012, around 144 million people were forced from their homes in 125 countries. The majority of this displacement (98% in 2012 and 83% over five years) occurred due to climate and weather related hazards which include floods, storm, etc.

Disaster-induced Displacement Worldwide in 2012  Source: http://idmcnrc.files.wordpress.com/2013/05/world-map-global-estimates-2012.jpg
Disaster-induced Displacement Worldwide in 2012
Source: http://idmcnrc.files.wordpress.com/2013/05/world-map-global-estimates-2012.jpg

In the year 2012, twenty disaster-induced displacement events were recorded, which were induced by flood and storm related disasters.  Out of these, fourteen happened in Asia which includes the mass displacement in India, China and Philippines. Large scale flood displacements also happened in African countries of Nigeria, Chad, Niger and South Sudan. In fact the Nigerian floods also displaced over six million people.  Hurricane Sandy brought the disaster for the west which rendered 775,000 people homeless in America and 343,000 people in Cuba.

Why Disaster Induced Displacements are Increasing The report says that related and interconnected global changes like population growth, rapid urbanisation and the exposure of vulnerable communities, homes and livelihoods to hazards will increase the risk of global disasters. Even though increasing use of life saving drugs have brought down mortality rate related with weather related hazards, number of disaster survivors getting displaced will not decrease.

Global Disaster-Induced Displacement  Source: http://www.nrc.no/?did=9675023
Global Disaster-Induced Displacement
Source: http://www.nrc.no/?did=9675023

The analysis done in the report shows that disaster induced displacement takes a toll on both high income and low income countries.  However, it is the middle and low income countries where majority of the people were displaced.  The report states that for the year 2012, 96.09% of disaster induced displacement happened in the middle and low income countries, whereas for the period of 2008-2012 it was 98.27%.  The report also identifies that the South Asia region had the highest disaster related displacement (36.4%) for the year 2012. From 2008 to 2012, the highest disaster induced displacements have happened in China (49,782,000) which is followed by India (23,775,000) and Pakistan (14,991,000).

Risk of the Unseen – Climate Change The impact of climate change on disaster induced displacement has been emphasized in the report. The report states that climate change is an important concern which will impact extreme weather events which could lead to more displacement. Intergovernmental Panel on Climate Change (IPCC) published a report in March 2012, Managing the Risks of Extreme Events and Disasters to Advance Climate Change Adaptation (SREX) in which relationship between extreme weather or climate events (“climate extremes”) and displacement has been acknowledged, “Although data on climate change-forced displacement is incomplete, it is clear that the many outcomes of climate change processes will be seen and felt as disasters by the affected populations. For people affected by disasters, subsequent displacement and resettlement often constitute a second disaster in their lives.”[4] Evidence suggests that climate extremes are becoming more and more unpredictable due to the impact of climate change which has changed the frequency and magnitude of these climate extremes. This could be very serious issue considering the impact climate extremes can have on displacement. The report however fails to point out that while high income countries have been responsible for the climate change to the greatest extent, the impacts of their emissions are being felt by the poorest people in the low income countries and middle income countries.

Displacement in Northeast The report says that that around 900,000 people were evacuated in Arunachal Pradesh in June-July 2012; two thirds of the state’s population. In Assam, the report says, quoting Central Water Commission that as many as six million, 20 per cent of the state’s population, were forced to flee by rising waters. It says, officials claimed the 2012 floods were the worst since 2004 when eight times more houses were recorded as damaged than in an average year.

Rainfall in June 2012 does not corroborate IDMC claims – Monsoon rain is the reason for the floods in June 2012. The table below presents the rainfall figures of Assam and Arunachal Pradesh during June 2012.

1-13 June 14-20 June 21-27 June 28 June – 4 July
Arunachal Pradesh 191.6 (+1%) 64.1 (-47.1%) 249 (+78%) 66.2 (-51%)
Assam & Meghalaya 189.4 (-3.5%) 123.7 (-9%) 251.8 (+105%) 65.2 (-51%)

Note: Rainfall in mm, figures in bracket indicate the % departure from Normal, all figures from weekly and seasonal rainfall maps of India Meteorological department.

It is clear from the above table that rainfall in June 2012 in Assam and Arunachal Pradesh was normal or below normal in all weeks except during June 21-27, 2012. Even the excess rain in this period is not too high to cause unprecedented flood displacement. This raises some doubt about the figures in the IDMC report.

Flood Effected Districts in Assam in 2012 Source: http://www.downtoearth.org.in/content/assam-arunachal-pradesh-face-worst-ever-floods-recorded-june
Flood Effected Districts in Assam in 2012
Source: http://www.downtoearth.org.in/content/assam-arunachal-pradesh-face-worst-ever-floods-recorded-june

Assam suffers annually from flood disasters. The havoc of floods paralyses the state for several months every year.  International recognition of this problem is very important for the state. However, that seems to be some significant exaggeration in the figure of displacement in NE India due to floods in June 2012.

The total population Arunachal Pradesh is 1,382,611 according to 2011 census[5] and displacement of 900,000 people would mean displacement of massive 65% population of the state. But we could not find any report or news confirming displacement of this huge extent. There was news about floods in several districts in Arunachal Pradesh in June and July 2012, but none corroborated the displacement figure of 900,000. In fact displacement of 65% population of Arunachal Pradesh due to floods have never been heard of for even the worst ever floods in the state.

For Assam, the flood in June 2012 was recorded as the worst floods in last ten years. The flood in June 2012 was termed as unprecedented by Dr. Partha Jyoti Das, a senior researcher working on flood and environment related issues in Assam. He said that the flood occurred quite earlier than the previous years, i.e. in the first few weeks of June.[6]  However we found it difficult to find any document corroborating the displacement figure of six million in Assam due to floods in June 2012.

On the National Disaster Management website of Government of India (http://ndmindia.nic.in/flood-2012/floods2012.htm) the highest number of people affected during the month of June and July was 1,992,727 (reported on 2nd July 2012). The highest number of people evacuated during this time was 383,421 (reported on 4th July 2012). The highest number of people found in the relief camps was 484,555 (reported on 15th July 2012). The Assam State Disaster Management Authority also corroborated this figure as the highest number of people reported in the relief camps during that period. Two tables providing extent of damage (cumulative figures) and rescue and relief (provisional) are given in Annexure1 and Annexure 2.

A mahout moves an elephant to higher ground as villagers paddle with their belongings through flood waters in the Pobitora Wildlife Sanctuary, some 55 km from Guwahati, the capital city of Assam, India on June 28, 2012. Source: http://photoblog.nbcnews.com/_news/2012/06/29/12478381-india-floods-displace-more-than-850000?lite
A mahout moves an elephant to higher ground as villagers paddle with their belongings through flood waters in the Pobitora Wildlife Sanctuary, some 55 km from Guwahati, the capital city of Assam, India on June 28, 2012.  Source: http://photoblog.nbcnews.com/_news/2012/06/29/12478381-india-floods-displace-more-than-850000?lite

Figures from Oxfam India, one of the leading organizations providing flood relief in the state also validated the fact that the flood in June 2012 was unprecedented early flood and worst in last ten years. They maintained that due to this flood nearly 2.4 million people have been affected and half a million people have been displaced.[7] The IDMC report also refers to the information gathered from Sphere India and Inter Agency Group (IAG). We found that in a Joint Assessment Report of IAG Assam on Assam Flood 2012 (published on 6th July, 2012) the number of affected people was stated as 2,391,369 in 4,540 villages. In the same report 383,421 inmates were reported to be staying in 650 relief camps in 15 districts of the state.

We had written to IDMC (at the email address idmc@nrc.ch as provided in the document for any further information and referred documents) on June 13, 2013, for copies of the documents referred in end note 11 and in table A2.1, and also request to “provide any other report that provides details and support for the figure of 6.9 million people displaced by flood disaster in North East India in June July 2012”. Our email remains unanswered as we write this.

Dr. Arupjyoti Saikia, an environment historian working on northeast after seeing the report said that “I have no accurate estimate of the people being displaced. But equally the estimate provided by the IDMC seems little awkward. The numbers of people affected in AP is surely less for very natural reasons. Often IDMC reports are criticized for their over-reaction. Official figures matter a lot as this numbers help in procuring relief from the GOI as well as other agencies. I presume GOA reports will come closer to the truth.” Dr. Dulal Chandra Goswami, another senior scholar from northeast, said that the displacement figures for northeast, quoted in the report appear to be highly exaggerated. Dr. Partha Jyoti Das also expressed similar opinions saying that the figures mentioned in the IDMC report for northeast are overestimated. Many reporters may accept the figures in such reports uncritically and report them, which lead to spreading of wrong information. This was evident from the reports published in Down to Earth[8] and Thomson Reuters Foundation[9].

Moreover, displacement in Assam is not only induced by floods but also by erosion. The report does mention “Shelter needs were a primary humanitarian concern as the authorities encouraged IDPs to leave relief camps and return to water-logged villages, destroyed houses and eroded land”.  But this is not completely correct as erosion leads to permanent displacement of people from their original land. Floods lead to inundation of a certain area for a period of time displacing people temporarily from their homes. But erosion displaces people permanently from their land. In displacements induced by floods the displaced people have the option of going back to their houses. Erosion leaves no option for that. People who get affected by erosion have to shift their homes before the actual erosion happens. In 2007 it was stated in the State Assembly that in 15 out of 23 districts in the state 40,414.98 bighas of land was lost due to erosion.  10,075 families have lost their houses due to erosion in that year. Many people who get displaced due to erosion opt to live on the side of the embankments in poor living conditions for years due to their inability to buy new land. They might not come to relief camp during floods which may result in their non-recognition in official displacement figures.

Such kind of reports also need to recognise clearly that among the disaster induced displacement, it is the poor people who are most at risk even in a fast growing country like India and climate change is making them even more vulnerable. Hence there is an urgent need to ensure that the climate action plans address the vulnerabilities of the poor. Unfortunately, Indian government’s National Action Plan on Climate Change (NAPCC) does not even recognise the vulnerable classes of people. In fact NAPCC increases the vulnerability of the poor, since it basically follows the business as usual development path.

This report by IDMC is an important initiative to document the plight of the people who face displacement due to the disasters. Recording and documentation of displacement is very important for policy formulation as well as for all related discussions and debates. The numbers presented are shocking but are clearly unsubstantiated and exaggerated. However exaggerated facts will also not lead to healthy policy formulation. Besides, factual inaccuracies may lead to questioning the credibility of such reports. We hope that IDMC will acknowledge these errors and bring more factual accuracy in their future reports. Such reports also need to highlight the issue of climate justice.

Parag Jyoti Saikia and Himanshu Thakkar
South Asia Network on Dams, Rivers & People (www.sandrp.in)

Email: ht.sandrp@gmail.com / meandering1800@gmail.com


Annexure 1: Extent of Damage (cumulative figures) (Provisional)

Name of States/

UTs

Date when updated

Population affected


No. of

human lives lost

No. of districts affected

No. of villages affected

No. of cattle/

Live- stock lost

Cropped area affected

(in ha)

No. of houses damaged

Fully Partially
15.06.12 13.06.2012 7 13 326
18.06.12 17.06.2012 66915 11 10 11783 07 02
28.06.12 27.06.2012 386762 14 19 23134.15 141 6592
02.07.12 01.07.2012 1992727 81 27 1564 657558.07
03.07.12 02.07.2012 1233970 95 27 1543 657558.07
04.07.12 03.07.2012 916801 104 27 1281 U/ Assesment
15.07.12 14.07.2012 2391369 125 30 4540 2.55
19.07.12 18.07.2012 2391369 126 30 4540 2.55 awaited awaited
24.07.12 23.07.2012 2391369 126 30 4540 2.55
31.07.12 23.07.2012 2391369 126 30 4540 0 2.55 0 0

Source: Flood Situation Report for June and July, 2012 available at http://ndmindia.nic.in/flood-2012/floods2012.htm


Annexure 2: Rescue and Relief (Provisional) 

Name of States/ UTs

Date when updated

No. of persons evacuated

No. of relief camps opened

No. of persons accommodated in the relief camps

15.06.2012

18.06.2012

17.06.2012

245

27

14100

28.06.2012

27.06.2012

24647

187

175750

02.07.2012

01.07.2012

370265

622

439548

03.07.2012

02.07.2012

370265

551

255677

04.07.2012

03.07.2012

383421

650

255677

15.07.2012

14.07.2012

383421

622

484555

24.07.2012

23.07.2012

383421

622

484555

31.07.2012

23.07.2012

383421

622

484555

Source: Flood Situation Report for June and July, 2012 available at http://ndmindia.nic.in/flood-2012/floods2012.htm


[2] As defined by the 1998  Guiding Principles on Internal Displacement, internally displaced people (IDPs) are individuals or groups of people “who have been forced or obliged to flee or to leave their homes or places of

habitual residence […] and who have not crossed an internationally recognised state border.”

[3] This figure is clearly gross error. The total Disaster induced displacement in 2012 by all types of hazards is 32.4 million, so storm related disaster cannot displace 95.7 million people. We have used a corrected figure in the table here, based on total displacement subtracted by displacement by other (than storm) factors.

[4] SREX, p.80. Citing Oliver-Smith, 2009

Assam · brahmaputra · Embankments · Floods

NDMA Commissioned IIT Roorkee Study on Brahmaputra River Erosion: A Biased and Structural Solution Oriented Report?


Image

Pic:  1  Erosion in Rohmoria in the Upstream of Dibrugarh. Source: The Assam Tribune

The National Disaster Management Authority (NDMA) has recently published a report named “Study of Brahmaputra River Erosion and Its Control”. NDMA had commissioned this study to the Department of Water Resources Development and Management of IIT Roorkee. NDMA is an apex body constituted under the Disaster Management Act, 2005 to prepare the country to face natural and human-made disasters. NDMA is headed by the Prime Minster of India. Under the natural disasters category it includes earthquake, flood, tsunami, land slide and avalanches while nuclear, chemical or biological disasters have been categorized as human-made disasters. This report provides a lot of information and data on the Brahmaputra and its tributaries. The information about erosion is also very much detailed and descriptive. The report can be found at http://ndma.gov.in/ndma/latestdisasterupdates/NDMA%20Final%20Report%20Brahmaputra%20River.pdf

Image

Pic:  2 Recent News Reports of Erosion in Subansiri River, One of the Largest Tributaries of Brahmaputra on the North Bank. Source: Dainik Janambhumi

ImagePic:  3 Houses on the side of the Old Embankment in Matmora. Source: Parag Jyoti Saikia

This reports deals with a very serious issue of erosion in the Brahmaputra river basin in Assam. Erosion should not be confused with floods even though both are annual phenomena in the Brahmaputra river basin. Erosion can be seen to have a more severe impact than floods because erosion leads to permanent loss of land and property. During floods land and houses are submerged for a period of time. But erosion displaces people from their land and property for good. Erosion inflicts severe damage to agriculture, economy and cultural relations of people. Erosion compels people to migrate to different places. Villages get eroded one after another and people living in those villages have to move to another location with their belongings. But this may not be possible and affordable for all those who lost their land in erosion. So for many of them, living on the side of embankments in very poor living conditions remains as the only option. Erosion also leads to migration of rural youths to urban areas in search of jobs. In the last few decades erosion has posed as a greater threat to the people of Assam than floods. The severity of erosion can be seen from the Table 7 of the report in which Satellite Based Estimation and Comparison of Area Eroded In Brahmaputra during the Period 1990 to 2007-08 and 1997 to 2007-08 have been presented.

Image

Map of the Study Area from the Report

The study divides the river length into twelve segments from Dhubri to Dibrugarh and that is why there are 12 reaches mentioned in the table.  It is clear from this table that the while the erosion prone length of the river is 10% higher along the South Bank of Brahmaputra compared to the same along North Bank. Areas facing erosion is 123% higher in South bank during the last decade (1998-2008) of the study period. The highest erosion area/per km of erosion prone bank is upstream of Dibrugarh, where the river enters the plains from the hills.

Areawise division into 12 reaches in the river

North Bank

South Bank

Total Erosion Length

(in km)

1990 to 2007 – 08 (in sq. km)

1997 to 2007-08 (in sq. km)

Total Erosion Length

(in km)

1990 to 2007 – 08 (in sq. km)

1997 to 2007-08 (in sq. km)

1. Dhubri

40.19

124.461

94.129

7.05

194.983

10.791

2. Goalpara

39.5

79.046

40.902

4.85

17.816

5.052

3. Palasbari

54.87

48.668

42.914

14.02

23.006

15.859

4. Guwahati

21.02

7.92

1.654

24.38

5.385

12.079

5. Morigaon – Mangaldai

6

35.606

2.138

47.91

96.979

103.7

6. Morigaon – Dihing

24.86

29.057

7.275

47.8

10.795

56.72

7. Tezpur

8.58

38.758

4.733

52.95

16.628

44.774

8. Tezpur-Gohpur

8.85

31.187

5.794

44.16

26.098

71.227

9. Majuli-Bessamora

24.69

25.562

12.327

47.17

32.788

28.998

10. Majuli Sibsagar

16.93

60.657

16.878

54.95

44.018

42.118

11. Dibrugarh

37.86

37.506

43.529

43.89

46.595

6.066

12. U/s Dibrugarh

70.5

20.376

55.454

57.54

399.529

333.416

Total

353.85

538.805

327.726

389.13

914.62

730.8


The Study Report:
There have been a lot of studies done on the river, to find a solution to the issue. But what comes as a surprise is the attempt to shy away with some of the crucial issues of the riverine eco-system in the northeast. But before going into crucial issues, a brief note about the report is provided.

The March 2012 study is divided into two phases. The first phase is named as ‘Sattelite Data Based Assessment of Stream Bank Erosion of Main Stem Brahmaputra and Its Major Tributaries’. In the second phase processing and analysis of the hydrological data of the Brahmaputra and its tributaries has been done.

In the first phase of the study information and data of 18 years (1990 to 2008) has been put together. The study pertains to a reach of 620 km on the main stem of Brahmaputra River, i.e., its entire course in Assam from upstream of Dibrugarh up to the town Dhubri near Bangladesh border.  23 major tributaries (13 northern and 10 southern) within India have also been considered. The data for this whole area was collected using an integrated mechanism of Remote Sensing and Geographical Information System.

In the second phase of the study a new method of analysis called Artificial Neural Networks (ANNs) has been used. The data processed through this analysis has been used for modeling the rainfall-runoff process and runoff-sediment process for the study area.

The report identifies inherent ‘sediment overloading’ of the river fluvial system as the main cause for river bank erosion vis-à-vis channel instability in Brahmaputra. The report recommends by proposing river training works for two pilot areas on Brahmaputra River. The first site is in Bhuragaon of Morigaon district and second one is near the Guwahati airport.

Critical issues:

The team of investigators for this study was led by Prof Nayan Sharma of the Department of Water Resources Development and Management at IIT Roorkee. This is a very descriptive report from the point of information and data about the river Brahmaputra and its tributaries. But even then there are several things that the report does not mention at all.

The report mentioned that inherent ‘sediment overloading’ as the prime cause for erosion in the river Brahmaputra. But another study named “River Bank Erosion and Restoration in the Brahmaputra River in India” has identified several other factors responsible for bank erosion.[1] That study states “The salient hydraulic and bank material factors responsible for bank erosion of the Brahmaputra system are i) rate of rise and fall of river water level, ii) number and position of major channel active during flood stage, iii) angle at which the thalweg approaches the bank line, iv) amount of scour and deposition that occurs during flood, v) variability of cohesive soil in bank material composition, vi) formation and movement of large bed forms, vii) intensity of bank slumping, and viii) progression of abandoned river courses to present-day channel.”

Identifying only ‘sediment overloading’ as the main reason for a dynamic river system like Brahmaputra seems an over simplification that overlooks the critical issues.

 Image

Pic:  4  A view of the Balijan Tea Estate Eroded by the Brahmaputra in Rohmoria in Dibrugarh district of Assam. Source: The Hindu

Even though the report identifies sediment overload as the prime cause of erosion, it has provided insufficient analysis as to why the sediment load is actually increasing in Brahmaputra. The report rightly states “Accelerated erosion has occurred in this region due to intensive deforestation, large – scale road construction, mining and cultivation on steep slopes.”

Pro Hydro Bias: Here the report completely ignores case of hydropower development in Arunachal Pradesh and its impact on Brahmaputra and its tributaries. The report nowhere mentions about the proposals for 168 hydroelectric dams in Arunachal Pradesh and its impact in the rivers in Assam. In the recent times, the state has witnessed mass protest against hydropower development in Arunachal Pradesh. In fact the report shows a pro-hydro bias when it laments that “less than 5% of the existing hydropower potential” have been put to use so far. At a time when people are demanding for cumulative impact assessment of dams on the rivers of Assam, reports like this attempt to create confusion among people. It is to be noted that when Assam was witnessing the mass protest against big dams, it was Dr. Nayan Sharma who appeared in the electronic media advocating for big dams.

Image

Pic:  5  Erosion protection work at Nimatighat on the Brahmaputra in Jorhat District on May 5th 2013.       Source: http://www.prokerala.com[2]  

Bias for Structural Intervention: This report advocates for structural intervention for flood protection and reiterates the need for more embankments. Lots of analysis has been done on the ill effects and poor performance of embankments. Embankments essentially transfer the problems to the downstream. There are ample examples of how structural interventions made for erosion protection have failed. We can take the example of Rohmoria, located in the upstream of Dibrugarh town in this regard. There were a series of structural interventions made to control erosion but it failed.[3]

The embankments proposed in this report for the two pilot-study areas are proposed to be constructed using geo synthetic bags. The geo-synthetic bags will be put inside polymer rope gabions[4] and installed in the critical toe of the bank line. The efficacy of controlling erosion through geo-tube embankments still not established, but even then geo-tubes have become the buzz-word for flood protection in Assam. The Asian Development Bank has offered a loan of $12 million for erosion protection through construction of geo-tube embankments. But Assam government engineers working on Brahmaputra and its tributaries are critical of ADB’s programme of erosion control through geo-tube. In a report published in regional news paper on March 2010, it was stated that revetments like geo-bags cannot be successful in Brahmaputra because it creates a permanent deep channel along the existing river bank.[5] The report also stated that geo-synthetic bags which were installed for bank protection in Palashbari-Gumi area were washed away by Brahmaputra. This area is in the downstream of Saraighat Bridge and close to Guwahati airport area where one of the pilot projects has been proposed.

Impact of Structural Interventions Ignored: The report provides structural solution for erosion control but ignores erosions which were a result of structural interventions in the river. Studies on Brahmaputra basin have shown that during and after the construction of bridges in the river Brahmputra erosion and floods have increased in the downstream areas.[6] In the case of Saraighat Bridge, unprecedented flood and erosion was witnessed in Palasbari and Gumi area. Morigaona and Nagaon districts suffered the same after the construction of Koliabhomora Bridge. Construction of Naranarayan Setu, led to flood and erosion in Dakshin Salmara, Pancharatna and Mancachar.

Similar fears have been expressed for the fourth bridge on Brahmaputra which is under construction between Bogibeel of Dibrugarh district and Kareng Chapori of Dhemaji district. The river is nearly 9 km wide at this point. But for the construction of this bridge, the river had been shrunk to almost 5 km through the boulder spurs. This is posing a great threat of flood and erosion for the downstream areas which include famous river island Majuli and Matmora, where India’s first geo-tube embankment was constructed. Engineers who are involved in the construction of the dykes of the fourth bridge had been reported saying that Matmora area would come under severe threat due to the increased river pressure in the area. The report completely ignores all these facts and shows ‘sediment overloading’ as the cause of erosion.

Besides, the study gives a feeling that erosion in the river Brahmaputra operates in ceteris paribus[7]. The report made no mention about climate change and how it is going to impact a river like Brahmaputra which is flowing right from the Himalayan mountain range. At a time when impacts of climate change are taken into account for every possible environment related matters, ignoring this is another major lacuna of this report.

These critical lacunas put a question mark over the usefulness of the otherwise informative study. Credibility of IIT Roorkee reports have been questioned in the past too.[8] NDMA may keep this in mind and focus on more basic issues. For starters as monsoon sets in and rounds of floods start along Brahmaputra, NDMA’s flood forecasting links have stopped functioning for five days as we publish this in the 1st week of June 2013.

 Parag Jyoti Saikia 

South Asia Network on Dams, Rivers & People (www.sandrp.in)

Email: meandering1800@gmail.com


[4] Gabions are sausages made of Polymer ropes that are appropriately woven by a special process to fabricate the Gabions in various sizes. Gabions are generally available in a prefabricated collapsible form. Images of polymer rope gabions can be found here – http://www.garwareropes.com/polymer_rope_pro_g.htm

[6] Mahanta, C; Mahanta, A., ‘Bridge over The Brahmaputra’ Economic and Political Weekly, pp 579-581, 2006

[7] Ceteris paribus is a Latin phrase which can be literally translated as “holding other things constant” and usually rendered in English as “all other things being equal”