Climate Change · Floods · Hydropower

Climate Change & Himalayan Glaciers: A News Round up

This year has witnessed erratic rainfall, increased snowfall, rising sea levels and other extreme weather conditions and the situation is not likely to improve in the coming months. Recent assessments have declared that this is the result of climate change, which we so conveniently blame for every untoward weather condition without properly addressing our own role in bringing it about or perhaps minimizing its effects. The climate is changing and the urgency to address this now is more than ever. Climate change acts as a catalyst and multiplies the threat we already face from certain environmental circumstances. The effects of climate change are being felt worldwide and global urgency is being expressed through various seminars and assessments being carried out by different international bodies like the IPCC (Intergovernmental Panel on Climate Change). Scientists have warned that extreme weather events will increase in intensity if climate change goes unchecked. Unchecked climatic change is also responsible for loss of life and property. According to the World Bank Report ‘Building Resilience: Integrating Climate and Disaster Risk into Development’, “from 1980 to 2012, disaster-related losses amounted to US$3,800 billion worldwide. Some 87% of these reported disasters (18,200 events), 74% of losses (US$2,800 billion) and 61% of lives lost (1.4 million in total) were caused by weather extremes (Munich Re 2013)[i].”
1

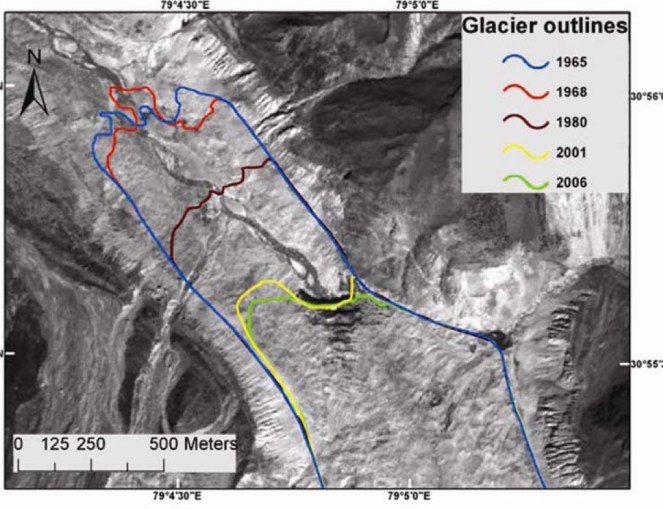
Image showing the retreat of the Gangotri glacier (http://glacierchange.files.wordpress.com/2010/01/gangotri-2006.jpg)

These weather extremes can cause and are in turn caused by changes in various water resources such as seas, lakes, rivers and glaciers. The Himalayas, spreading across over 2500 kms are the source of various life giving rivers in India and other parts of South Asia. The Ganga, Brahmaputra and the Indus, among the most important rivers for the South Asian region, originate in the Himalayan glaciers. The Himalayas have the highest concentration of glaciers outside the polar caps. These glaciers are natural stores and regulators of water in these rivers, which in turn support needs and livelihoods of millions of people, provide water for irrigation, domestic consumption and energy generation. Climate change is likely to result in smaller glaciers and less melt water. For rivers like the Indus, which gets almost half of its water from the melting of glaciers, this can lead to the endangering of the livelihood of millions of people living in low lying areas.

Rapid retreat of Himalayan Glaciers as compared to global averages Courtesy ICIMOD

Even though such fears are being expressed by various groups of people, studies done by the ICIMOD in collaboration with Netherlands’ Utrecht University and research organization FutureWater, observe that the water levels in the Indus, Ganga and the Brahmaputra are likely to increase at least until 2050[ii]. This, they say, is due to an increase in melt-water in the Indus and an increase in precipitation in the Ganges and the Brahmaputra. But these projections, as even the scientists acknowledge, do not say anything about the future of these rivers. With retreating glaciers, what will the fate of rivers like the Indus be, which depend largely on melt-water, is still to be ascertained.

Soaring temperatures, melting glaciers A study prepared by the Uttarakhand government has predicted that the mean annual temperature (MAT) in the Himalayan region is likely to rise by up to 2 degree centigrade by 2030. It has also predicted a rise of 5-13% in rainfall in the next 2 decades. This was disclosed in the Rajya Sabha on 5th of August, 2013 by the then Science and Technology minister, S Jaipal Reddy[iii].

According to a report presented in the Second India Water Forum in 2013, melting of glaciers will lead to a reduction in the critical water supplies for the people of the Himalayas. The International Centre for Integrated Mountain Development (ICIMOD) predicted that Himalayan water flow from the glaciers to the basin would reduce by about 25-50% by the end of this century[iv]. The significant effects of this will be seen in the upper reaches. Taking the case of Ganga, it is seen that though its snow and ice melts contributes only about 1-5% of the water in the Ganga and its tributaries, this is only an annual averageiv. The percentage of melt water becomes higher in the months of March, April and May. This then becomes a very crucial amount of water in the rivers in those summer months where it cannot be recharged through rain.

This is also very important for the hydro projects downstream. Seasonal melt-water serves as the main source of power for an increasing number of hydroelectric dams on the rivers served by the glaciers. The amount of electricity generated depends on the amount of water flow in the river. Thus with changing river patterns in South Asia, the hydropower production will be disrupted. A 1% reduction in stream flow can reduce electricity output by roughly 3%[v]. The unreliable and potentially decreasing flow of water implies that whole hydropower development plans need a comprehensive rethink, also considering the increaed threat of flashfloods and related disasters in changing climate.

Another report by the ICIMOD has found that glacier runoff contributes majorly to river flow for about 2-4 months, mainly from early/mid-summer, till late summer/early fall and reaches its maximum in the Northern hemisphere in July-August. The total mass of the glaciers is much more than what is recharged every year, thus leading to smooth inter-annual flow variability and thus reducing risks of the late summer droughts in hot and dry summers. Climate Change, however, may lead to consistent mass loss in glaciers, hence reducing their inter-annual storage capacity[vi].

The report further reads:

The withdrawal of glaciers and seasonal snow covers as the transient storages for precipitation in certain areas implies first and foremost the loss of flow regulation capacity in basin’s headwaters… Combined effect of the reduction of glacier area and seasonal snow extent on the seasonality of flow from the alpine catchments will be characterized by an increase of the magnitude of the short-term flow variability, in particular, an increase of autumn and winter flow, shift of late spring-early summer peak to earlier dates and possible decrease of mid-late summer flow (assuming no changes in precipitation). Hydrological regimes will be gradually changing from glacio-nival to fluvial, i.e., dependent primarily on rainfall… The glacier runoff simulation results suggest that relative shares of renewable and nonrenewable components in total glacier runoff have undergone a remarkable change: the nonrenewable component increased from 16-30% of total glacier runoff in 1961-1990 to 26-46% in 2001-2010 in all the study basins. However, the increase of non-renewable runoff in none of the basins has been large enough to overweigh the decrease of the renewable component of glacier runoff due to overall reduction of the glacier-covered area.[vii]

According to another study co-authored by Anil Kulkarni, visiting scientist at the Divecha Centre for Climatic Change, entitled, The state and fate of Himalayan glaciers, the rate of loss of glacial mass in the Himalayan and Karakoram (H-K) region, has increased after roughly 1995. Rough estimates suggest that glaciers in the Indian Himalaya are losing mass at the rate of 16 Billion T per year[viii]. The loss in mass for many small glaciers located in low altitude range could be larger than the average suggests, being as high as 1 m per year. This is substantial loss considering mean depth of small glaciers could be between 30 and 50 mviii.  These small glaciers and ice fields are important source of water for many mountain communities. This source of water is and could be significantly influenced in near future and could affect sustainability of many mountain communities. There is today neither a mapping of such vulnerable communities, nor any plans to compensate them for the losses they are suffering and will suffer for no fault of theirs.

This loss of mass, especially if it comprises of non-renewable runoff, can also lead to further complications. According to geophysicist and seismologist, Geological Survey of India, Mr. O.P. Mishra, melting of glaciers due to increasing temperatures and high rainfall also add to the already existing complex of factors influencing earthquake activity in the Himalayan region[ix]. According to him, the ice sheet melting leads to the loosening of the litho static pressure (vertical pressure on the underlying crust)ix. As a glacier retreats and its weight eases, the earth could show a tendency to bounce back up in the form of a moderate or even a strong earthquake. According to him, there is a strong correlation between the retreat of ice sheets and increased seismic activityix. This increase in seismic activity can also lead to further melting of glaciers and a change in their behavior as it has the capacity to alter the axis of rotation, which can then lead to changes in surrounding areas.

According to a study conducted by the Chinese Academy of Sciences (CAS), the glaciers in the Tibetan plateau, which form the source of vital rivers such as the Brahmaputra, have shrunk by about 15%, which would mean about 8,000 square kms since 1980[x].

Retreating glaciers in Tibet Photo: ecns.cn

They also found that the perennial frozen earth in the plateau had decreased by 16% over the past 30 yearsviii. This does not present a favourable scenario for water security in the region and downstream areas of the Brahmaputra. According to scientists, this glacial retreat has accelerated since the 1990s and is making the plateau more vulnerable to the effects of climate change. This again means the plans for hydropower projects in North East India will need a review, but unfortunately, the Environmental and Social Impact Assessments of these projects are not even considering these factors and the MoEFCC’s (Ministry of Environment and Forests and Climate Change) Expert Appraisal Committee on River Valley Projects is not even taking these into consideration while appraising these projects in spite of repeated submissions on this by SANDRP.

2

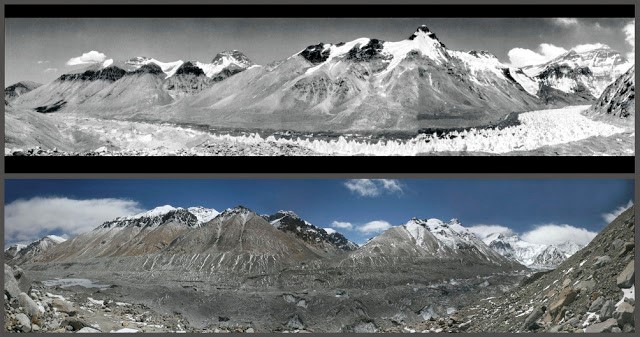
Above: The scale of glacial melting on the west Rongbuk Glacier located in Southern Tibet,between 1921 and 2008. Photo by: RGS and David Breashears. (http://tibet-edd.blogspot.in/2012/03/glacial-meltdown-and-glacial-lake.html)

The situation is similar in the case of the Gangotri glacier. Scientists at the GB Pant University of Himalayan Environment and Development have observed that the gangotri glacier is reducing in volume and size. The glacier is 30.2 km long and is the origin of the Bhagirathi, one of the main tributaries of the Ganga. This has retreated more than 1500 metres in the last 70 years. According to researchers, from the year 2000 onwards, the average rate of retreat of the glacier per year has been about 12-13 metres[xi].

Even while this is happening, there have not been any efforts to sensitize the scores of pilgrims who flock to Gangotri every year towards the condition the glacier is in, and how they can help in not letting it deteriorate further or at least in slowing down the process. They need to be made aware of the danger that the environment is faced with and should be encouraged to take steps towards its conservation. The state and union government also needs to ensure that local projects do not lead to worsening the situation. It is also the responsibility of the local people of the area to conserve what is important for them. They have to come out and take responsible action to ensure that they have a say in the plans made for their area.

Pilgrims at Gomukh, snout of Gangotri Glacier Photo from : http://savegangotri.org/scenes-of-ecological-degradation-and-destruction/

The impact of glacier melting is felt in the upper reaches of the river and also in low-lying areas. For example, the Tawi river in Jammu has become shallow over time so much so that one does not need a boat to cross it anymore at certain locations and certain times. According to the retired director of operations M.M. Munshi, Geological Survey of India, “the glaciers and barrier lakes in the Jujdhar and Seojdhar ranges, which contribute a larger share of water to Tawi, have almost disappeared… water flow in all the rivers is declining… the perpetual snow line in Jammu and Kashmir has gone up to 16,000 feet from 13,000 feet in the last hundred years”[xii]. Such changes affect those who mainly rely on water for their livelihoods, i.e., farmers as also ground water recharge. It is not only the unavailability of water, but also the floods caused due to untimely or heavy rains. In such situations, which are recorded to be increasingly occurring in this region, people have to suffer the loss of land, livestock and thus even livelihood.

Such floods in the upper reaches by the headwaters can also be caused due to the flooding/breaking of glacial lakes. These glacial lakes can either already exist or even get formed in case the precipitation and/or glaciers melt increases. Global warming is seen as one of the key causal factors in their formation. According to recent reports, melting of glaciers is leading to the formation of small lakes in the high reaches of Himachal Pradesh. These lakes pose danger to the villages downstream. Out of the 249 glacial lakes in Himachal, 11 have been identified as having high potential for breach. Glaciers and ice-bodies cover a total of 2472.49 sq km (4.44%) of the total area of 55673 sq km in the state[xiii]. This is made worse by the uncertainty of rainfall and increasing frequency of higher intensity rainfall.

These kind of glacial lakes are forming in many areas in the Himalayas. Such lakes can also have loose moraines with them, which pose a greater threat to downstream areas as there could be a sudden breach of the moraine dams leading to flooding. One of the ways to prevent excessive harm to the people is if the rate of glacier melting can be studied with some degree of attentiveness, then alarm systems can be installed in areas downstream to warn the people in case of a Glacial Lake Outburst Flood (GLOF).
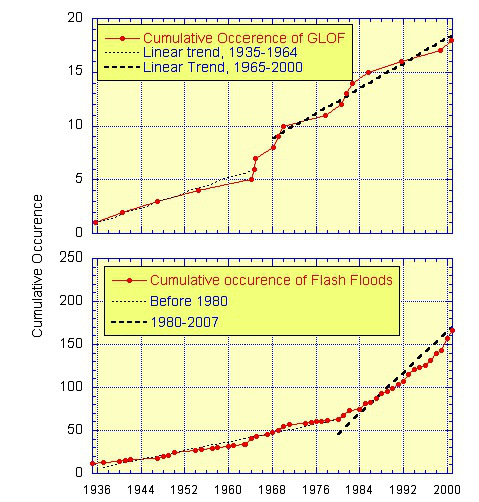
Rapidly increasing frequency of flash floods and GLOFs in Hindukush Himalayas Courtesy: ICIMOD


.3

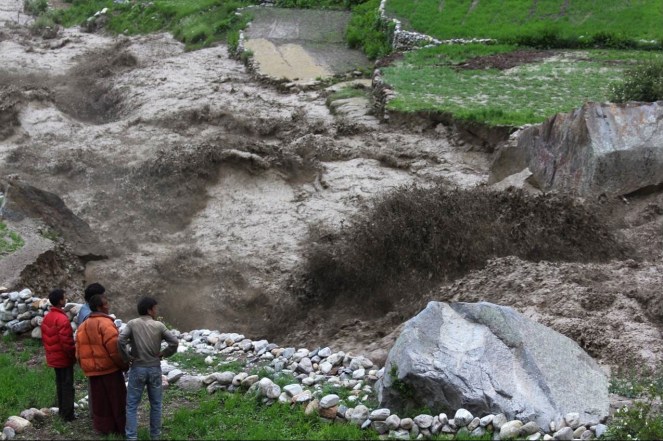
Above: People in Halji Village, NW Nepal, watch as a GLOF destroys their fields. (http://www.asianart.com/articles/halji2/index.html)

The monsoon is likely to become even more unpredictable in the coming years. Thus the threat to our environment from climate change is on the rise and it increases every day that we choose to ignore it. The government had set up the National Action Plan on Climate Change (NAPCC) in 2008 which was intended to serve as a road map on how India plans to combat climate change. There are various missions under the NAPCC amongst which are the National Water Mission and the National Mission for Sustaining the Himalayan Ecosystem, which has been constituted primarily to understand to what extent the glaciers are retreating and how the problem can be addressed. The government plans to review all the missions in 2017. However, as SANDRP publication “Review of NAPCC: There is little Hope here” showed, both content and process of formulation of the NAPCC had nothing to be hoped for particularly as far as vulnerable communities were concerned. A more detailed review of the National Water Mission in SANDRP’s 2012 publication “Water Sector Options for India in a Changing Climate” showed, the process, content and implementation of the National Water Mission is not going to bring any help to sustainable water resources development or to the vulnerable sections.

We have seen various so-called natural disasters happen since 2008, a very significant one of which was the Uttarakhand flood disaster of June 2013. The Uttarakhand government, at the end of last year, proposed a Rs 9,000 crore action plan to minimize the effects of climate change. Under this plan, it had allocated Rs 108 crore to be spent on water resources, like the treatment of catchment areas and flood control, etc. These measures just show the desperation of the government to show that something is being done in the namesake, even though it is not based on any scientific studies or participatory process. It seems to be the same way in which the Disaster Management cell was set up in Uttarakhand to try and manage any disaster that might strike the region, the campus of which was affected in the 2013 floods. The affected people have still not received sufficient help from the government. Even the basic minimum facility like the road that leads into Uttarkashi has not been constructed. The local people have to cross tracts of dusty and congested roads to reach from one place to the other when it has been over a year since disaster struck the town.

What we need is for the community to be involved at every stage from planning, impact assessments, decision making, implementation, operation and maintenance process and awareness creation in the areas which are most vulnerable. The current top-down approach that pushes business as usual situation will clearly not help.

Padmakshi Badoni, SANDRP, padmakshi.b@gmail.com

Standing Proud: Chewang Norphel from Ladkah who has been constructing small check dams and helping form artificial glaciers. Photo: climateheroes.oeg
Standing Proud: Chewang Norphel from Ladkah who has been constructing small check dams and helping form artificial glaciers. Photo: climateheroes.org


END NOTES:

[i] http://www-wds.worldbank.org/external/default/WDSContentServer/WDSP/IB/2013/11/14/000456286_20131114153130/Rendered/PDF/826480WP0v10Bu0130Box37986200OUO090.pdf

[ii] http://timesofindia.indiatimes.com/Home/Environment/Global-Warming/Water-supply-in-Ganga-Brahmaputra-will-increase-Study/articleshow/35955391.cms

[iii] http://economictimes.indiatimes.com/environment/global-warming/mean-annual-temperature-in-himalayan-region-to-rise-by-2-degrees-by-2030/articleshow/21625356.cms

[iv] http://www.thethirdpole.net/glacier-melt-will-reduce-crucial-water-supplies-for-people-living-in-the-himalayas/?utm_source=third+pole+newsletter&utm_campaign=8590241a4e-thethirdpole+June+newsletter+2013&utm_medium=email&utm_term=0_43686cf8d5-8590241a4e-46415029

[v] http://www.nature.com/news/climate-change-melting-glaciers-bring-energy-uncertainty-1.14031

[vi] http://www.iwmi.cgiar.org/Publications/IWMI_Research_Reports/PDF/PUB150/RR150.pdf)

[vii] http://www.iwmi.cgiar.org/Publications/IWMI_Research_Reports/PDF/PUB150/RR150.pdf

[viii] http://www.iisc.ernet.in/resehig_himalayan_glaciers.html

[ix] http://www.thethirdpole.net/in-the-jigsaw-of-himalayan-risk-climate-change-and-earthquakes-are-linked/?utm_source=third+pole+newsletter&utm_campaign=f192aa85b1-thethirdpole+June+newsletter+2013&utm_medium=email&utm_term=0_43686cf8d5-f192aa85b1-46415029

[x] http://www.thehindu.com/sci-tech/energy-and-environment/tibetan-plateau-glaciers-have-shrunk-by-15-per-cent/article6130865.ece

[xi] http://www.thehindu.com/sci-tech/energy-and-environment/gangotri-glacier-is-retreating-report/article5549905.ece

[xii] http://www.trust.org/item/20140225155301-lt9p4/?source=hpeditorial

[xiii] http://timesofindia.indiatimes.com/home/environment/global-warming/Melting-glaciers-giving-rise-to-new-lakes-in-Himachal-Pradesh/articleshow/38889169.cms
Climate Change · Maharashtra

Gawadewadi: A success story of participatory small scale water conservation

Background

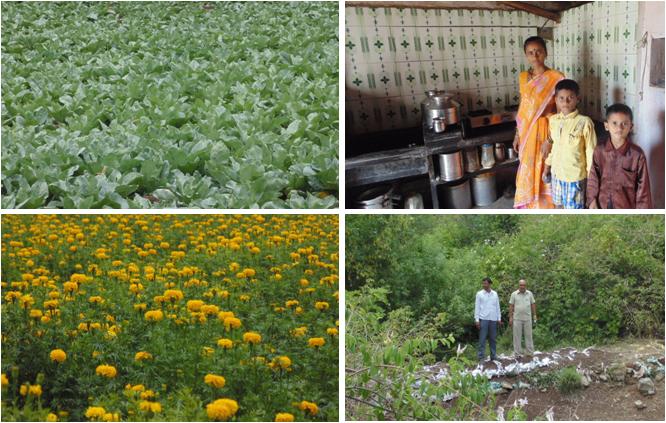
Clean roads, lush green farms and wells having water even at the peak of summer is what one notices when one enters Gawdewadi Village of Ambegaon Taluka in Pune Distrct.

Ralegan Siddhi and Hiware Bazar villages of Maharashtra are two widely discussed success stories of sustainable village development through soil and water conservation works. There are however lesser known success stories of equal caliber. Gawadewadi is possibly one such story. Participatory soil and water conservation work started for improving water availability in the village for drinking and agricultural purposes has led to multiple other initiatives like cooperative dairy, gobar gas plants for the households, horticulture etc. A chain of benefits has unfolded over more than ten years of hard work put in by the villagers. The village is now tanker free, crops have diversified, agricultural production has gone up and so have income levels. Most rewarding benefit has been the homecoming of more than 165 families which had migrated to Pune or Mumbai in search of work.

Gawadewadi has successfully demonstrated how small scale ‘active solution’ of participatory soil and water conservation works can become a successful alternative to large scale ‘passive solution’ such as building dams.

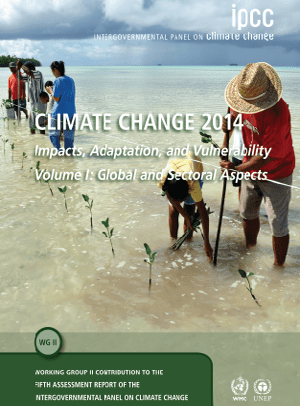
The success story is even more important in the context of changing climate. The Working Group II of Inter-governmental Panel on Climate Change (IPCC), in its report titled Climate Change 2014: Impacts, Adaptation, and Vulnerability’released on 31st March 2014[i][ii], acknowledges that Ecosystem Based Adaptation (EBA) to Climate Change (such as soil and water conservation works) is a lower risk option as against engineering solutions (such as dams) as their application is more flexible, more responsive to unanticipated environmental changes and is more cost effective & sustainable. It also acknowledges that building large dams is not a climate friendly option. The report further states that EBA may contribute to achieving sustainable development goals (e.g. poverty reduction, sustainable environmental management, and even mitigation objectives), especially when they are integrated with sound ecosystem management approaches.

In this regard the success story of Gawadewadi assumes greater importance.

Journey towards sustainability

Gawadewadi (Ambegaon taluka, Pune district) with a total area of 1243 Ha is a village located about 10 km away from Manchar on the Pune-Nashik road and 70 KM away from Pune city. It is a rainfed watershed lying in the rainshadow region of Maharashtra state (Figure 1[iii]). Average annual rainfall is about 500 mm. The terrain is mostly flat. Southern boundary of the village is hilly which flatten in central and northern portion. Out of 1,243 ha of land 878 ha is cultivable. Most of the families in this village are small land holders. Current population of the village is about 3190. After drought of 1972-73 the village was dependent on tankers for drinking water during summer, agricultural productivity was low and a large number of people had migrated to Pune and Mumbai in search of employment.

Gawadewadi Figure 1

In 1985, residents of Gawadewadi with local leadership of Anna Pimpale visited Ralegan Siddhi village in Parner taluka of Ahmednagar District. Impressed by the holistic development of the Ralegan Siddhi the residents were determined to transform Gawadewadi. Vanarai, a voluntary organization based in Pune that was approached by the villagers agreed to act as a catalyst in this process of development. Soil and water conservation works started in 1991. Technical inputs needed for the watershed development works were given partly by Irrigation Department and partly by Agricultural department. Along with these funds no grazing and no cutting of trees was diligently followed. Since there are no landless cattle breeders following no open grazing regulation was easier.

Sr. No. Structure Number
1 Soil bunds 18
2 Loose Boulder Bunds 03
3 Underground Bunds 03
4 Gabion Structures 01
5 Check dams 03
6 Percolation Tanks 05
7 Vanrai Bund 01

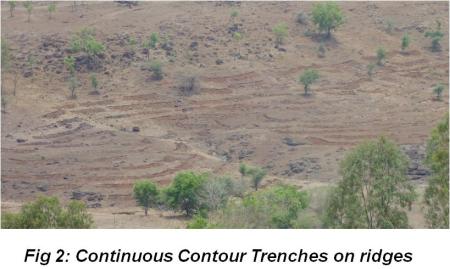
There are four catchment areas spread over 1400 Ha. Adopting top to bottom approach for watershed treatment Continuous Contour Trenches (CCT) (Figure 2), loose boulders and stone bunds were constructed on the ridges; soil bunds, cement bunds, gabion structures and percolation tanks were constructed at the bottom of the catchment. CCT works on the ridges is carried out by forest department. Under social forestry programme Village Panchayat has planted 1,10,000 trees on 34 acre land. Table above lists the existing watershed structures.

Gawadewadi Figure 2


Gawadewadi Figure 3

Total expenses incurred for the project were Rs 60 lakh for construction of watershed structures and Rs one lakh for trainings. This money was spent during first 5 to 6 years of work during 1991-97 and funded by various government departments like Agriculture Department, Social Forestry Department, Ground Water Survey and Development Agency and also by Vanarai.

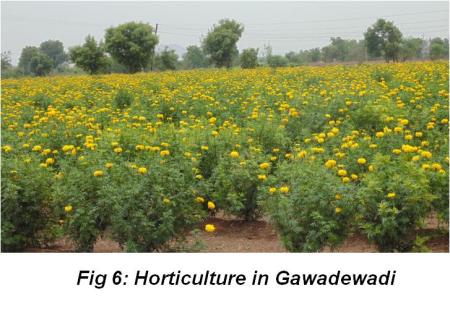
Water availability has slowly increased. After the great drought 1972-73 the village survived entirely on tankers post February every year. Government had to send two to three tankers per day to cater for drinking water. The village is now completely tanker free. Wells that had no water after December earlier now have water even at May end (Figure 4). Earlier the only crops harvested were bajra and jowar. Farmers could barely cultivate once a year. Now the crop diversity includes tomatoes, potatoes, groundnut, wheat, sugarcane etc. Village also produces export quality custard apples, pomegranates and grapes. Farmers take three rounds of crops in a year instead of one. The village now has irrigated area of 150 Ha. In 1991, 500 people from the village were daily wage labourers. Now there are nil. Area under horticulture was 11 Ha in 1991 which has now increased to 142 Ha (Figure 5 & 6). Increased fodder development resulted in increased milk production. Milk collection which was 200 lt per day in 1991 has gone up to 12000 lt per day. The village experienced no scarcity of water in drought of 2012. Domestic demand for water was unaffected by drought. For agriculture the usual round of water is once in 10 days which had to be adjusted to once in 20 days during the drought. “We did not even realize that there was a drought” says Jaywant Gawade a villager.

Gawadewadi Figure 4

Gawadewadi Figure 5

Gawadewadi Figure 6Vanarai has played a role of facilitator. It coordinated the local officers of various ministries & departments and pooled different resources to make them available to the village. Vanarai awakened the local leadership and conducted training programmes for developing different skills and also worked for empowerment of women and youth.
Watershed development worked as a platform for the villagers to come together. With resources made available from Vanarai the participatory initiatives soon diversified to other livelihood generating and development initiatives. Following footsteps of Ralegan Siddhi the village followed the principles of ban on alcohol, no use of axe, no grazing, shramdan and family planning. Latrines were constructed in all the households. Biogas plants have been constructed in 265 households and latrines have been connected directly to the biogas plants. Entire cooking for all these families is taken care of by biogas. Increased fodder availability has made it feasible to rear cattle and thus has ensured the availability of cow dung. There are 13 women Self Help Groups (SHGs) involved in activities like sericulture, vermi composting etc. The village now has nine dairies. These dairies were actively functioning till 2-3 years back. The milk collected was sent to Katraj Doodh Sastha (Pune). Since last two three years private milk product companies collect milk from individual households and pay for the same. Villagers opted for this as it is a more convenient option. In 1994 the villagers established Hirkani Vidyalay, a local school with contribution from village. The momentum of village development which geared up 10-12 years back is still very much alive. Currently Vanarai is involved in improving the marketing of agriculture produce. The villagers now want to focus on improving the agricultural practices. After increase in the water availability the cultivated area under sugarcane has also increased. Currently the area for sugarcane cultivation is 60% of the total cultivated land. The sugarcane is sent to Pargaon Cooperative Sugar Factory. The factory has been existing for last 15 years. About 90% of the sugar cultivators from the village are members of this sugar factory.

This is a matter of concern in such low rainfall area and it has intensified the water use. With this realization the villagers are slowly shifting towards drip irrigation. They are also keen on learning sound crop water management and organic farming practices. Data for the current water use and ground water levels for past few years could not be available for this study.

Dynamics with Dimbhe dam

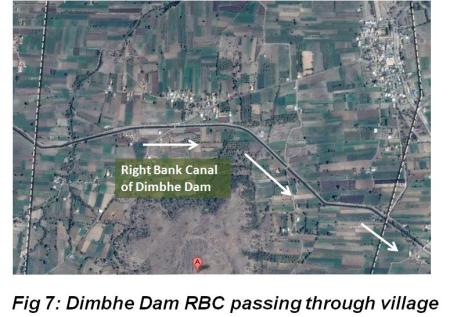
The village was self reliant in terms of water availability four to five years prior to irrigation canal provided by the government. Right Bank Canal (RBC) of Dimbhe dam which was constructed in 1997 passes through the village (Figure 7[iv] & 8). Dimbhe dam was filled to capacity in 2000, submerging 2202 hectares land of tribals in the Ambegaon taluka. 1253 families had to shift out, 11 villages were submerged fully and another thirteen villages were partially affected. Villagers inform that there is no fixed schedule followed for releasing water in RBC of the dam. The Left Bank Canal (LBC) constructed in 1987 has water throughout the year since it carries water downstream to Yedgaon dam[v]. However RBC receives water only thrice a year. The latest round of water release, as I write this was in February 2014. The water lasted for crops for about 30 to 35 days. The next round of water was due in May 2014 which is yet to be released. Agricultural fields only in the belt of 200 ft on both the sides of canal are benefitted. Villagers inform that in absence of watershed development work, coping with summer solely with canal irrigation was impossible.

Gawadewadi Figure 7

Gawadewadi Figure 8

Dimbhe Dam and its RBC share some more interesting dynamics with the village. Gawadewadi has hosted more than 70 families which were displaced because of Dimbhe Dam. Villagers point out that these families are a classic example of how the displaced families often remain away of benefits of the dam. The displaced families stay more than two KM away from the RBC and have no access to water from RBC. They were given land for land around 20 KM away from the houses that were built for them in Gawadewadi. Many of them sold the lands given to them under rehabilitation package as commuting was a problem. Problems of Dimbhe dam that have interface with Gawadewadi may just be a tip of ice berg. Even so these links with the government irrigation projects further highlight the need for participatory and decentralized water conservation.

Conclusion

Taking a close look at the development of Gawadewadi shows that the essential element behind success was the active public participation. This participation and ownership of the work resulted in completion of soil and water conservation works on 1400 Ha of area when no funding was available. This participation was also responsible for spurring of other allied developmental initiatives in the village which almost took a form of movement. Villagers voluntarily participated in various training programmes and diversified their livelihood options, improved farming practices, increased crop variety, increased milk production and in turn increased their income. In this sense such eco-system based works for conservation of natural resources like land and water become ‘active solutions’ as against the ‘passive solutions’ such as dams which come at a tremendous social and environmental cost.

It is worth noting that over 40% of India’s under construction dams are in Maharashtra. The state has spent about Rs 75000 crores over the last decade and will need to spend about Rs 76000 crores to complete the under construction projects[vi]. When Maharashtra is on such an irrigation spree, highlighting and replicating stories like Gawadewadi which demonstrate success of small scale solutions is definitely the need of the hour.

Amruta Pradhan, SANDRP, amrutapradhan@gmail.com, Photos by Author

 Note: This article is based on field visit, accompanied by Vanrai in early June 2014.

END NOTES:

[i] http://ipcc-wg2.gov/AR5/report/final-drafts/

[ii] https://sandrp.wordpress.com/2014/04/03/dams-are-not-climate-friendly-readings-from-ipcc-wg-ii-report/

[iii] Base map adopted from Wikipedia

[iv] Base map adopted from Google Maps

[v] Water from Yedgaon dam is further carried to Visapur dam and then to Karmala Dam.

[vi] https://sandrp.in/irrigation/MAHA_Irrigation_Scam_Nov2012.pdf

Climate Change

Why is the IPCC’s Mitigation (WG3 summary) report so disappointing?

Extracts from and comments on WG3 summary report of IPCC of April 13, 2014

The summary for policy makers[i] of the Working Group 3 (WG3) report of IPCC (Inter Governmental Panel on Climate Change) Assessment Report 5 (AR5) was made public on April 13, 2014 in Berlin. As Dr Youba Sokono, a co-chair of the IPCC’s working group 3 said said science has spoken with a road-map and as IPCC chair Dr Rajendra Pachauri hoped, high-speed mitigation train was all ready to leave the station with all on board, as reported by BBC.

IPCC scenarios showed world emissions of greenhouse gases would need to tumble by 40-70 % from 2010 levels by 2050, and then to almost zero by 2100, to keep rises below 2C. “Ambitious mitigation may even require removing carbon dioxide from the atmosphere,” the IPCC said. The trouble is, the emissions are still rising as the WG3 report summary report shows and there are no plans in sight to reverse that trend and achieve even these targets that may not be sufficient. In such a situation to talk about rather business as usual low carbon technologies do not sound convincing. 

Here are some important relevant extracts and comments thereon. As IPCC statement in Berlin while releasing this report highlighted, this report is endorsed by the governments and is supposed to provide the main scientific guide for nations working on a UN deal to be agreed in late 2015. While governments of the world have promised to limit the increase in global temperature within 2 degrees C above pre-industrial level (there are many who have questioned if this will be good enough), this report does not provide clear implications of current global warming path and credible road-map to achieve that objective in a equitable, sustainable and democratic way. Many of solutions suggested in this report  including Carbon Capture & Storage, Nuclear Energy, Redd+, CDM and plantations are in reality false solutions, as is also proved by increasing trajectory of emissions in spite of so called actions being taken since over a decade. As a Guardian report on leaked copy of the report warned, it seems this report is largely making business as usual recommendations without showing will to face the reality or learn from past experiences.

According to IPCC, the IPCC WG III assesses options for mitigating climate change through limiting or preventing greenhouse gas emissions and enhancing activities that remove them from the atmosphere. The main economic sectors are taken into account, both in a near-term and in a long-term perspective. The sectors include energy, transport, buildings, industry, agriculture, forestry, waste management. The WG analyses the costs and benefits of the different approaches to mitigation, considering also the available instruments and policy measures. In case of some of the issues, our comment on the IPCC statements is also included. The overall conclusion is that the report is disappointing, but let us first go through some note worthy aspects.

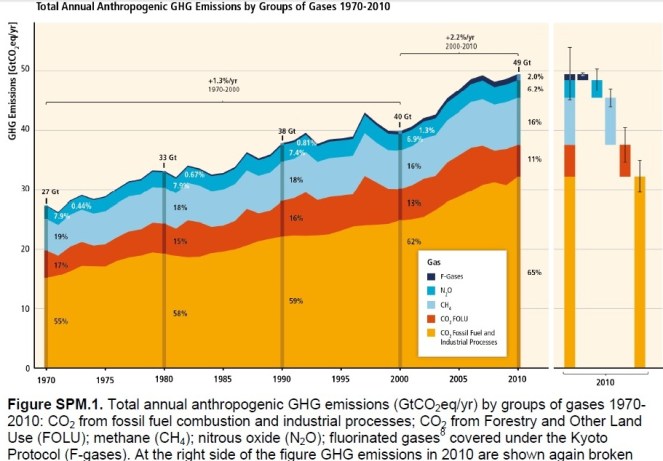
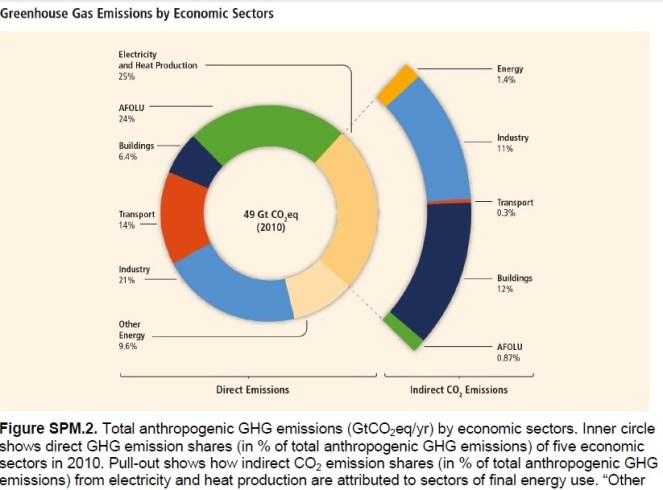
“Total anthropogenic GHG emissions have continued to increase over 1970 to 2010 with larger absolute decadal increases toward the end of this period (high confidence). Despite a growing number of climate change mitigation policies, annual GHG emissions grew on average by 1.0 giga tonne carbon dioxide equivalent (GtCO2eq) (2.2%) per year from 2000 to 2010 compared to 0.4 GtCO2eq (1.3%) per year from 1970 to 2000. Total anthropogenic GHG emissions were the highest in human history from 2000 to 2010 and reached 49 (±4.5) GtCO2eq/yr in 2010.” The figure below provides how the emissions across sectors have been changing over the years. Even at conservative estimates, the emission is likely to have reached 53 GtCO2eq by 2014.

GHG emissions graph WG3 report

“About half of cumulative anthropogenic CO2 emissions between 1750 and 2010 have occurred in the last 40 years (high confidence). In 1970, cumulative CO2 emissions from fossil fuel combustion, cement production and flaring since 1750 were 420±35 GtCO2; in 2010, that cumulative total had tripled to 1300 ±110 GtCO2. Cumulative CO2 emissions from Forestry and Other Land Use (FOLU) since 1750 increased from 490±180 GtCO2 in 1970 to 680±300 GtCO2 in 2010.” It is not clear why the full emission from all sectors was not counted to arrive at this comparative statement.

GHG by sector WG3 report

“Globally, economic and population growth continue to be the most important drivers of increases in CO2 emissions from fossil fuel combustion. The contribution of population growth between 2000 and 2010 remained roughly identical to the previous three decades, while the contribution of economic growth has risen sharply (high confidence). Between 2000 and 2010, both drivers outpaced emission reductions from improvements in energy intensity (Figure SPM.3). Increased use of coal relative to other energy sources has reversed the long‐standing trend of gradual decarbonization of the world’s energy supply.” The equating of contribution from population growth and economic growth this way is a bit inappropriate and in any case, since contribution from economic growth went up, separate figures for the two should have been given.

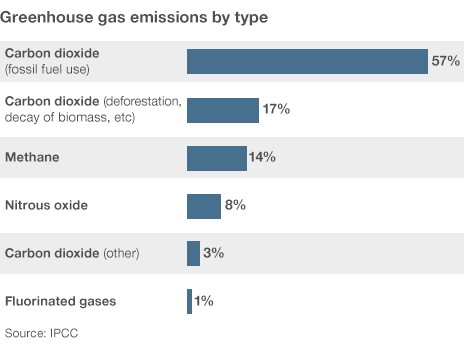
GHG by type
GHG by type

“Without additional efforts to reduce GHG emissions beyond those in place today, emissions growth is expected to persist. Baseline scenarios, those without additional mitigation, result in global mean surface temperature increases in 2100 from 3.7 to 4.8°C compared to pre-industrial levels” (the increase could be 7.8°C when including climate uncertainty). “For comparison, the CO2eq concentration in 2011 is estimated to be 430 ppm” (uncertainty range means it be as high as 520 ppm).

The Cancún Pledges are likely to keep temperature change below 3°C relative to pre-industrial levels and not below 2°C as is required. This admission that Cancun Pledges (which still does not  a credible road map for implementation) are insufficient is welcome.

“In the baseline scenarios assessed in AR5, direct CO2 emissions from the energy supply sector are projected to almost double or even triple by 2050 compared to the level of 14.4 GtCO2/year in 2010, unless energy intensity improvements can be significantly accelerated beyond the historical development (medium evidence, medium agreement).” In the last decade, the main contributors to emission growth were a growing energy demand and an increase of the share of coal in the global fuel mix.

Regarding electricity generation, RE (Renewable Energy) accounted for just over half of the new electricity‐generating capacity added globally in 2012, led by growth in wind, hydro and solar power. However, the IPCC should not have put all hydro on same pedestal as solar and wind, it is well known that large hydro is not considered among Renewable source of energy.

Questionable certificate to Nuclear Energy and CCS This certificate of the IPCC report to Nuclear Energy is certainly going to be questioned: “Nuclear energy is a mature low‐GHG emission source of baseload power, but its share of global electricity generation has been declining (since 1993). Nuclear energy could make an increasing contribution to low‐carbon energy supply, but a variety of barriers and risks exist (robust evidence,high agreement). Those include: operational risks, and the associated concerns, uranium mining risks, financial and regulatory risks, unresolved waste management issues, nuclear weapon proliferation concerns, and adverse public opinion (robust evidence, high agreement). New fuel cycles and reactor technologies addressing some of these issues are being investigated and progress in research and development has been made concerning safety and waste disposal.”

Similarly, the claim of IPCC report about CCS is questionable: “Carbon dioxide capture and storage (CCS) technologies could reduce the lifecycle GHG emissions of

fossil fuel power plants”. In this respect, the warning issued by the Guardian[ii] based on a leaked copy of the report seems to be correct: “The underlying assumption appears to be that business as usual economic growth must be sustained, and industry and corporate profits must be protected and maintained. But if we focus on ‘business-as-usual economics’, seeking and accepting only bargain basement options for addressing global warming – the costs will be far more severe.”

Hopeful forecast for AFOLU GHG emissions The IPCC report is hopeful about emissions from AFOLU (Agriculture, Forestry and Other Land Use) sector: “Most recent estimates indicate a decline in AFOLU CO2 fluxes, largely due to decreasing deforestation rates and increased afforestation… in the future, net annual baseline CO2 emissions from AFOLU are projected to decline, with net emissions potentially less than half the 2010 level by 2050 and the possibility of the AFOLU sectors becoming a net CO2 sink before the end of century”. However, this is not the situation for India where deforestation continues to be on the rise. Moreover, it is not clear if the IPCC report equates forests with plantations. Similarly it is disappointing to note the IPCC saying that REDD+ is a “cost effective policy option” in forest sector, neglecting to note the huge opposition such measures are facing from the forest dependent populations in India and elsewhere.

No mention of SRI The report concludes, “In agriculture, the most cost‐effective mitigation options are cropland management, grazing land management, and restoration of organic soils”. However, it is disappointing that there is no mention of the huge potential of emission reduction through use of cropping methods like the System of Rice Intensification for rice and various other crops. It is good to see that the report notes that suitability of the conclusion “Bioenergy can play a critical role for mitigation” is limited by concerns of food security, water resources and biodiversity conservation.

Urbanisation “As of 2011, more than 52% of the global population lives in urban areas. In 2006, urban areas accounted for 67–76% of energy use and 71–76% of energy-related CO2 emissions. By 2050, the urban population is expected to increase to 5.6–7.1 billion, or 64–69% of world population. Cities in non-Annex I countries generally have higher levels of energy use compared to the national average, whereas cities in Annex I countries generally have lower energy use per capita than national averages”. However, there is little systematic efforts at tapping the huge potential of mitigation in Urban areas. The report has no success story in this regard. On the other hand there are many examples of urban areas demanding more dams in nearby areas at the cost of forests, rivers, biodiversity and people, without doing any options assessment or exhausting local options. From India, Mumbai[iii], Nashik[iv] and Bangalore[v] provide some examples in this regard.

What are low carbon energy sources? It is disappointing to note that IPCC report brackets “renewables, nuclear and electricity generation with CCS” as “low‐carbon electricity supply”. This is certainly recommendation for business as usual situation, without much change for the USD 1200 billion per year investment sector. This is certainly very questionable.

Are energy efficiency measures working?  The report makes and interesting observation about labeling programs to achieve energy efficiency: “There is general agreement that rebound effects exist, whereby higher efficiency can lead to lower energy prices and greater consumption, but there is low agreement in the literature on the magnitude”. This is particularly relevant since such programs are more likely to benefit more for the richer sections who are polluters in the first place.

“Cap and trade” is not working? The report conclusion in this regard is noteworthy: “Since AR4, cap and trade systems for GHGs have been established in a number of countries and regions. Their short-run environmental effect has been limited as a result of loose caps or caps that have not proved to be constraining”. In India this program is underway in terms of Renewable Energy Certificates (REC) and India’s power ministry rather misguidingly wants to implement this also for large hydro. In absence of any punitive measures for distribution companies not abiding by the CERC norms, there are few takers for the RECs and the price of RECs have also been low.

No attention to abject failures of UNFCCC and CDM The IPCC report says United Nations Framework Convention on Climate Change has “nearly universal participation” and “Kyoto protocol offers lessons towards achieving the ultimate objective of the UNFCCC, particularly with respect to participation, implementation, flexibility mechanisms, and environmental effectiveness”. Nothing can be farther from truth particularly in the context of actual implementation of Clean Development Mechanism (CDM), which is the main vehicle for achieving UNFCCC objectives. CDM has been a vehicle for perpetrating further environmental degradation, destruction of forests, biodiversity, rivers and livelihoods of people to basically benefit the private sector’s business as usual projects and with no benefits or participation for the local communities. The process of certifying the CDM projects as sustainable and additional in terms of emission reduction have proved to be complete failure as numerous examples from India and elsewhere show.

“Sustainable development and equity provide a basis for assessing climate policies and highlight the need for addressing the risks of climate change. Limiting the effects of climate change is necessary to achieve sustainable development and equity, including poverty eradication.” This sounds good, but there are no credible recommendations in the report to achieve equity or sustainable development.

“Effective mitigation will not be achieved if individual agents advance their own interests independently. Climate change has the characteristics of a collective action problem at the global scale, because most greenhouse gases (GHGs) accumulate over time and mix globally, and emissions by any agent (e.g., individual, community, company, country) affect other agents.” This is welcome indeed and should have been added that there are different classes of people who are polluters, different from those who are vulnerable to the impacts of such pollution.

“Important options for mitigation in waste management are waste reduction, followed by reuse, recycling and energy recovery (robust evidence, high agreement). Waste and wastewater accounted for 1.5 GtCO2eq in 2010. As the share of recycled or reused material is still low (e.g., globally, around 20% of municipal solid waste is recycled), waste treatment technologies and recovering energy to reduce demand for fossil fuels can result in significant direct emission reductions from waste disposal.” Indeed, but there are no credible measures to achieve progress on this front, particularly in country like India.

“Policies governing agricultural practices and forest conservation and management are more effective when involving both mitigation and adaptation. Some mitigation options in the AFOLU sector (such as soil and forest carbon stocks) may be vulnerable to climate change (medium evidence, high agreement). When implemented sustainably, activities to reduce emissions from deforestation and forest degradation (REDD+ is an example designed to be sustainable) are cost‐effective policy options for mitigating climate change, with potential economic, social and other environmental and adaptation co‐benefits (e.g., conservation of biodiversity and water resources, and reducing soil erosion) (limited evidence, medium agreement).” This recommendation of REDD+ is seriously problematic considering the opposition to such measures from forest dependent communities all over the world, including India. This shows how cut off from ground is the report.

Gas a bridge fuel? As BBC report [vii] noted, one of the surprising endorsements in the report is natural gas: “Emissions from energy supply can be reduced significantly by replacing current world average coal-fired power plants with modern, highly efficient natural gas combined-cycle power plants,” says the summary. However, gas is itself a fossil fuel, extraction of gas has its impacts and the extraction of shale gas, the newest and hottest source has worse kind of impacts. Without looking at all these issues, recommending gas as a bridge fuel is not likely to be convincing.

Conclusion The summary of the Working Group 3 report of the IPCC’s fifth Assessment Report is disappointing considering that it has failed provide the current status of climate change and its implications in 2020, 2030, 2050 and 2100 for the various sections of  the global society, particularly the vulnerable ones in clear terms. This conclusion seems justified even though the report does have certain welcome statements and recommendations as mentioned above. Since this is the summary for the policy makers and governments, it is a very crucial document, even as we await the full publication of the report. A number of recommendations of the report are  disappointing and unscientific, including: continued use of fossil fuels with questionable Carbon (dioxide) Capture & Storage techniques, nuclear energy, and putting  them in same footing as Renewables like solar, wind and micro hydro; equating plantation and forests, omission of SRI, omission of democratic and participatory governance, omission of identification of vulnerable sections, omission of critical view of CDM implementation and keeping them in focus and lack of sufficient emphasis on equity. The lack of recommendation that climate change polluters among the developed countries and rich sections of developing countries be made to pay for the pollution and upholding the principle of equity at global, national and local section is glaring. The report mentions nothing about need to reduce the demand. We hope the full WG3 report does not have more worrying aspects and has more hopeful recommendations.

Himanshu Thakkar, ht.sandrp@gmail.com

END NOTES:

[i] http://report.mitigation2014.org/spm/ipcc_wg3_ar5_summary-for-policymakers_approved.pdf

[ii] http://www.theguardian.com/environment/earth-insight/2014/apr/07/ipcc-un-climate-change-mitigation-wg3-worsen-geoengineering

[iii] https://sandrp.wordpress.com/2013/12/20/dams-in-tribal-areas-of-western-ghats-for-water-supply-to-mumbai-why-are-they-unjustified/,

https://sandrp.wordpress.com/2013/12/18/multiple-dams-for-mumbai-region/,

https://sandrp.wordpress.com/2014/02/28/crisis-in-indias-urban-water-sector/

[iv] https://sandrp.wordpress.com/2013/07/26/forest-advisory-committee-does-not-clear-a-dam-project-in-western-ghats-of-nashik-affecting-nearly-1000-hectares-of-land-in-the-absence-of-relevant-studies-information-and-compliance/,

https://sandrp.wordpress.com/2013/07/09/can-a-dam-submerging-1000-ha-be-encouraged-only-because-its-drinking-water-project/

[v] https://sandrp.wordpress.com/2014/01/30/open-letter-to-dr-veerappa-moily-as-he-supports-foundation-stone-laying-of-yettinahole-diversion-project/

[vi] https://sandrp.wordpress.com/2014/04/03/dams-are-not-climate-friendly-readings-from-ipcc-wg-ii-report/

[vii] http://www.bbc.com/news/science-environment-27008352

[ix] On 24 April 2014 on email:

The edits to the summary of the IPCC’s recent report, were all about governments vying for position ahead of crucial UN climate talks in Paris next year. –‘Censored’ IPCC summary reveals jockeying for key UN climate talks by David Stern, Australian National University
One of the graphs dropped from the summary  shows that per capita emissions have grown rapidly in middle-income countries like China and India, but have declined in both the richest and the poorest countries. Despite that, it also shows that per capita emissions remain much higher in the developed world than in developing countries.

Another graphs which was dropped shows that the greenhouse gases emitted to produce goods destined for rich countries outweigh the emissions created by rich countries to make goods for export elsewhere. Naturally, the reverse is necessarily true for middle- and low-income countries

Climate Change · Maharashtra

Maharashtra State Action Plan on Climate change: Farmers Suffer, State and consultant TERI unaffected

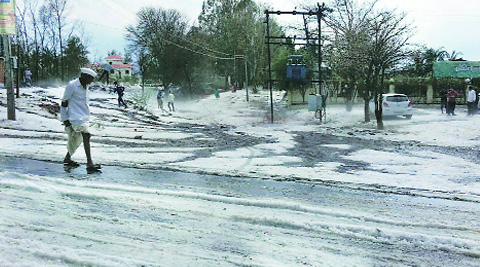
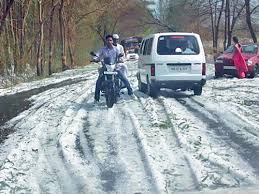
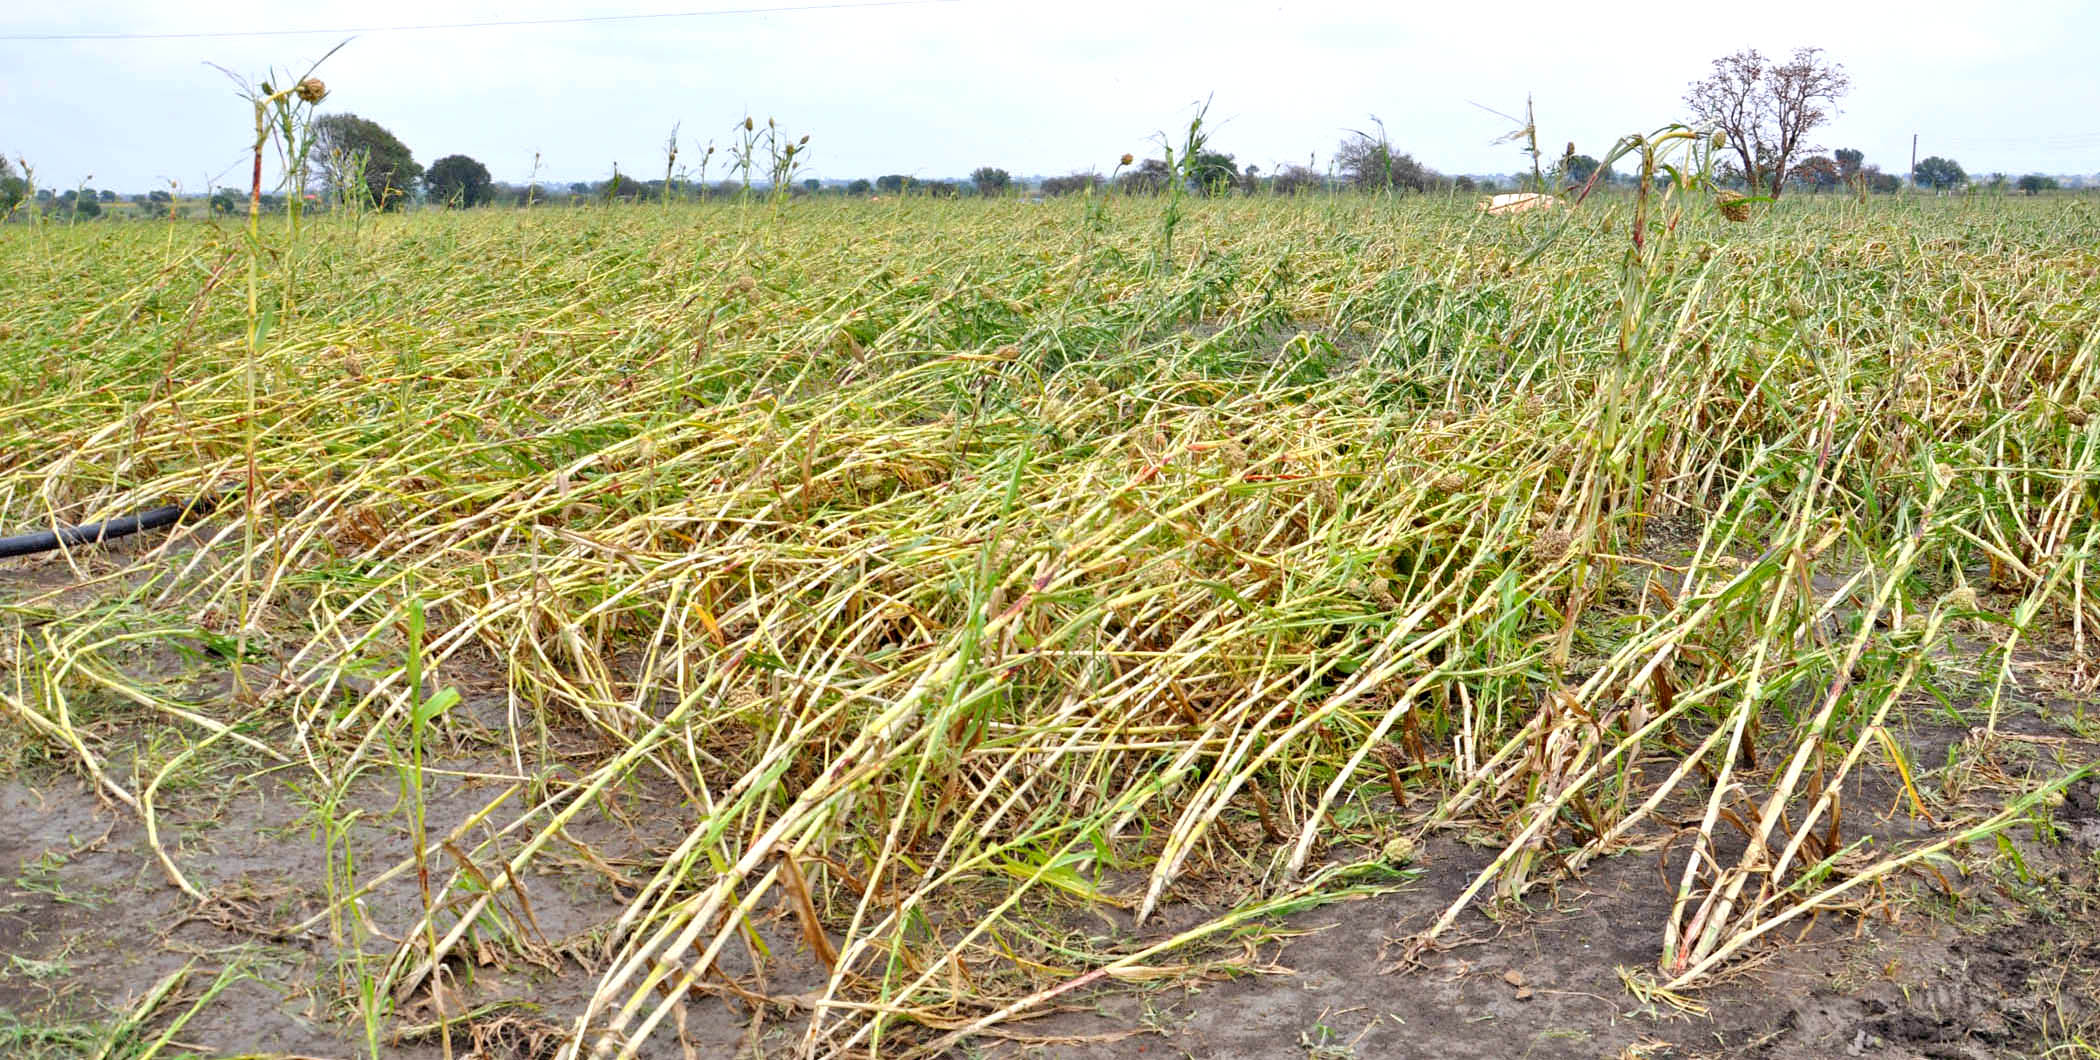
Even as rural areas in otherwise-drought hit Maharashtra (as also in neighbouring areas of Karnataka, Madhya Pradesh and Chhattisgarh) are trying to cope with the immense damages due to untimely rain and hailstorms in Feb-March 2014, the IPCC Assessment Report 5 by Working Group II warns that extreme weather events may increase in their frequency. This was also supported by the IPCC Special Report on Extreme Events in 2012.

Sr NoEventDate
1NAPCC made publicJune 30, 2008
2Mah state council on CC formed by a GRSept 2008
3Work awarded to TERI “to assess Climate Change Vulnerability and Adaptation Strategies for Maharashtra State and to prepare a Climate Change Adaptation Action Plan for the State” at the cost of Rs 98 lakhs; to include six case studiesAug 20, 2009
4Maharashtra govt order regarding TERI (6 members in addition to Dr Pachauri and Dr Leeana Srivastava as advisors) given above task, along with Met office, Hadley Centre, UK (2 members) and formation of state coordination committee for this under the chairmanship of Chief SecretaryNov 26, 2009
5Dept of Environment conducted decision makers workshop CC adaptation and mitigationFeb 24-25, 2011
6State advisory committee on CC created with chief minister as chairJuly 8, 2011
7First meeting of State advisory committee on CCFeb 2013
8Meeting (latest) held on draft climate change action plan with Chief Secy in chairOct 7, 2013
9Mah Env department gives RTI response to SANDRP: “The final action plan on climate change is not yet submitted by TERI to Govt of Maharashtra”Apr 2, 2014

Back to back in two years, Maharashtra faced a drought (in 2012-13), touted to be worst in past 40 years, to a hail and rain event which broke records of past hundred years (and perhaps even more) several times over. Studies are pointing out that the coastal region and the traditionally drought-affected part of Marathwada and Vidarbha is specifically vulnerable to climate change.

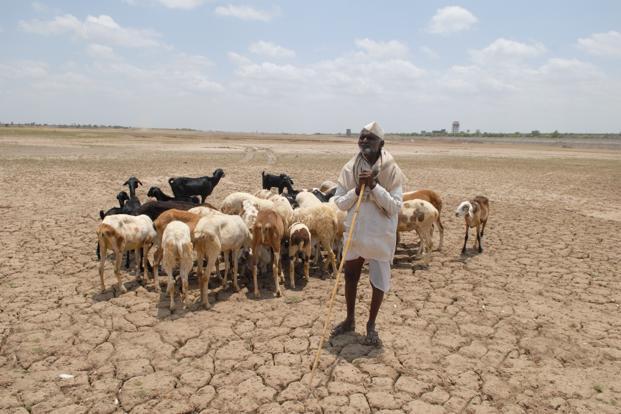
Drought 2013. Photo: Mint

It is also highlighted by the IPCC reports, experienced painfully by Maharashtra that: “Risks are unevenly distributed and are generally greater for disadvantaged people and communities in countries at all levels of development.”

So how prepared is Maharashtra to face, adapt to and mitigate the challenges put forth?

Information obtained by SANDRP under RTI underlines the fact that respective governments have given no priority, time or importance to consider climate change or its impacts on societies and ecosystems.

The Maharashtra State Council on Climate change was formed in Sept 2008 by a GR, its Chairperson was the then Chief Minister and included ministers from Agriculture, Water resources, Industries, etc. This Council awarded work related to State Action Plan on Climate Change to TERI on 20th Aug 2009 and TERI was supposed to complete this Study in two years,  that is by Aug 2011.

More than four and a half years latter, TERI has still not completed the report on State Action Plan on Climate change and Government of Maharashtra does not seem too bothered by it.

The process by which TERI was given the task of doing the SAPCC also seems inappropriate. The process is described in Maharashtra government order of Nov 16, 2009, where there is no mention of any competitive bidding. The order says that Dr RK Pachauri of TERI was  asked to make a presentation on climate change in Maharashtra, based on which it was decided to give the task of preparing the SAPCC to TERI and Met Office, UK at the cost of Rs 98 lakhs. This is clearly inappropriate process.

It’s been 5 years since the National Action Plan on Climate Change (NAPCC) was made public in June 2008. NAPCC itself was formulated in non-transparent, non-participatory way by Prime Minister’s Council on Climate Change.  Several States have submitted and are working towards their Action Plans.

In Feb 2011, Chief Minister Prithviraj Chavan announced Advisory committee on Climate change similar to PM’s council on CC. However, the Government Resolution for the State Council on CC came only on 8th July 2011. Some its  current 19  members include Chief Minister (chair), Deputy Chief Minister,  Ministers of Environment, Agriculture, Water resources, Rural Development, Chief Secretary, Secy-Environment, etc. Some Expert members include Sunita Narain, Jamshed Godrej, Anu Agha, Dr. R.K. Pachauri, Dr. R. A. Mashelkar, Dr. Anil Kakodkar and Ajay Mathur from Bureau of Energy Efficiency.

The Terms of Reference of the Committee indicate the following duties:

(a) To evaluate the study being done by TERI in the State and recommend strategies. (Emphasis added)

(b) Provide an oversight to the State Government in the drafting an action plan to combat climate change;

(c) To ensure a co-ordinated response to all issues relating to climate change.

This council was to meet “at least twice a year to review situation on CC and adaptation strategy” as per the GR. It has met just once in last 33 months.

After giving contract to TERI in 2009, announcing State Council on CC in 2011, the first and only meeting of the State Council on Climate Change happened only in Feb 2013! Minutes of the meeting claim that final report from TERI is expected in March 2013. However, there was no discussion on this important report or even a discussion to hasten the formulation and implementation of this report. Strangely, TERI and MET Office UK had already published a note on the Action Plan in 2012[1] itself, when the State Action Plan is still not final even today!

There is also issue of conflict of interest here: when TERI is given the task of preparing Maharashtra SAPCC, how can Dr. Pachauri, who heads TERI be on the State Council to oversee the preparation of SAPCC? Secondly, Dr. Pachauri is a member of PM’s Council on Climate Change, which recommends state action plans and then his own organisation, TERI is awarded the work to prepare the action plan for Maharashtra. Is not there a conflict of interest here?

Moreover, Sunita Narain and Dr. Pachauri are also members of PM’s Council on Climate Change and having seen the performance of PMCCC in bringing out business as usual NAPCC in non-transparent, non-participatory way. The state government should have appointed independent members who have knowledge of the state.

The minutes of the first meeting of the state council seem to suggest that the meeting had rather unfocused discussions. The meeting had interesting conclusion: “All the members Council were of the opinion that the implementation of the existing schemes/ plans need to be focused on climate change adaptation strategies and did not encourage going in for further studies.” In spite of such a clear conclusion, we see neither the state action plan in place, nor adaptation of the existing schemes/ plans with the climate change implications in Maharashtra. In fact, Sunita Narian was also member of the Kasturirangan committee on Western Ghats, but we see no effective reflection of climate change concerns in the conclusions of the Kasturirangan committee.

The Chief Minister said in conclusion, “Providing income support to farmers was of utmost importance to the Government. A special “Climate Change Cell” would be established in the state to focus on climate change issues”. There is no evidence of functioning of any such cell, more than a year after that meeting.

There have been some meetings of High Powered Committee on climate changed, headed by Chief Secretary, the latest meeting happed on Oct 7, 2013.

The minutes of the Oct 2013 meeting notes, “The officers of the disaster management department were attending the meeting for the first time, which according to the Chief Secretary was not very useful given that they do not have any background in the subject area as well as the previous discussions.” Considering how important is the role of disaster management in climate change context, this callousness of disaster management department seems disturbing. The minutes also noted the need for additional Rs 40 lakhs to get run off (hydrology) data.

The minutes of the meeting ends with this conclusion: “Chief Secretary instructed TERI, to finish the consultations with respective departments for validations of data and finalise the recommendations within a month time, post which the presentation could be made before the cabinet.” However, that was in Oct 2013, but even in April 2014, there is no sign of the State Action Plan on Climate Change, an exercise that has dragged on for over 4 and half years now.

While all this has been going on without any conclusion, action plan or implementation of any necessary actions, the millions of the vulnerable people of the state are suffering and more than 20 farmers have committed suicide in the face of inconsolable loss.

The State Action Plan on Climate change is not a magic wand that will cure all ills. It is, however, one of the indicators of the seriousness and intent of our administration in tackling the real and grave challenges. Right now, there seems to be no seriousness and no intent.

 Parineeta Dandekar (parineeta.dandekar@gmail.com),
Himanshu Thakkar (ht.sandrp@gmail.com)

END NOTES:

[1] http://www.metoffice.gov.uk/media/pdf/c/a/GOM_brochure_for_web.pdf

2. https://sandrp.wordpress.com/2014/03/11/maharashtra-farmers-face-impacts-of-hailstorms-and-states-inaction-plan-on-climate-change/

3. https://sandrp.wordpress.com/2014/04/03/dams-are-not-climate-friendly-readings-from-ipcc-wg-ii-report/

4. VERY TRAGIC story of how hailstorms have hit poor farmers in Marathawada in Maharashtra: http://www.livemint.com/Specials/jkcra6zQqMShlFJjzmvXeN/Death-and-despair-in-hailstormhit-Marathwada.html

Climate Change · Dams · Hydropower

Dams are not Climate Friendly: Readings from IPCC WG II Report

Inter-governmental Panel on Climate Change’s (IPCC) Fifth Assessment is falling into place. On the 31st March 2014, the report titled ‘Climate Change 2014: Impacts, Adaptation, and Vulnerability’, from Working Group II[1] was issued in Yokohoma, Japan. Working Group II assesses “the vulnerability of socio-economic and natural systems to climate change, negative and positive consequences of climate change, and options for adapting to it. It also takes into consideration the inter-relationship between vulnerability, adaptation and sustainable development.”[2]

This can be called as one of the more incisive Working Group Reports from IPCC. It states unequivocally that the effects of climate change are already occurring on all continents and across the oceans and world is ill-prepared for risks from a changing climate. According to Co-Chair of Working Group II, Chris Field, “The report concludes that people, societies, and ecosystems are vulnerable around the world, but with different vulnerability in different places. Climate change often interacts with other stresses to increase risk”.[3]

The report consists of two volumes. First volume contains a Summary for Policymakers, Technical Summary, and 20 chapters assessing risks by sector and opportunities for response. The sectors include freshwater resources, terrestrial and ocean ecosystems, coasts, food, urban and rural areas, energy and industry, human health and security, and livelihoods and poverty. A second volume of 10 chapters assesses risks and opportunities for response by region. These regions include Africa, Europe, Asia, Australasia, North America, Central and South America, Polar Regions, Small Islands, and the Ocean.

The summary for policymakers paints a sombre picture: “Climate change over the 21st century is projected to reduce renewable surface water and groundwater resources significantly in most dry subtropical regions, intensifying competition for water among sectors. In presently dry regions, drought frequency will likely increase by the end of the 21st century under RCP8.5. In contrast, water resources are projected to increase at high latitudes. Climate change is projected to reduce raw water quality and pose risks to drinking water quality even with conventional treatment, due to interacting factors: increased temperature; increased sediment, nutrient, and pollutant loadings from heavy rainfall; increased concentration of pollutants during droughts; and disruption of treatment facilities during floods. Adaptive water management techniques, including scenario planning, learning-based approaches, and flexible and low-regret solutions, can help create resilience to uncertain hydrological changes and impacts due to climate change.”

“Risks are unevenly distributed and are generally greater for disadvantaged people and communities in countries at all levels of development.”

Links with water

Being an integral and cross cutting issue, water features prominently in all of Chapters of the Working Group Report. Sections on Freshwater Resources, Costal systems and low lying areas, Food Security, Inland systems, etc. include important findings. It is significant to note that dams, hydropower projects, infrastructure measures like channelization, embankments, etc., are also mentioned in nearly all the chapters of the report. Couple of references indicate dams as a possible adaptation measure, but overwhelming references point to the contrary.

The collective picture that is arising through these reference is very important. A collation and analysis of all specific references to water infrastructure projects, read in tandem with the report indicates that: 

1. Dams and infrastructure projects contribute significantly to “non-climate impacts” which, after interacting with changing climate, exacerbate the overall impact on human societies and ecosystems

o   Sediment Trapping by reservoirs, exacerbates impact of  sea level rise

o   Hydropower affects local options

o   Climate  change and dams together affect a greater eco-region

o   Increased flow fluctuations by dams exacerbate through climate change

2. In case of Flood Protection, dams and embankments may do more harm than good. Ecological measures would fare better.

3. Dams and Hydropower projects affect biodiversity, which is critical in facing climate change challenges.

4. In the tropics, global warming potential of hydropower may exceed that of Thermal Power

5. Dams increase vulnerability of weaker sections to climate change

6. Existing Dams have to be managed sustainably, with ecological considerations

7. Hydropower itself is vulnerable to Climate Change

~~~

The references used in WG II report are peer reviewed research from several authors.The specific references given below will play an important role in debunking the simplistic myth that dams and hydropower projects are climate friendly and can be considered as de facto adaptation measures to cope with Climate Change.

Some Relevant Extracts from Working Group II Report:

  1. Dams and infrastructure projects contribute significantly to “non-climate impacts” which, after interacting with climate impacts, exacerbate the overall impact of climate change on human societies and ecosystems 
  • Sediment Trapping by reservoirs, exacerbates impact of  sea level rise

“Most large deltas in Asia are sinking (as a result of groundwater withdrawal, floodplain engineering, and trapping of sediments by dams) much faster than global sea-level is rising.” (Chapter 24: Asia)

“Human activities in drainage basins and coastal plains have impacted the coastal zone by changing the delivery of sediment to the coast. Sediment trapping behind dams, water diversion for irrigation, and sand and gravel mining in river channels all contribute to decrease sediment delivery, whereas soil erosion due to land-use changes help increase it. It is estimated that the global discharge of riverine sediment was 16-–19 Gt/ yr in the 1950s before widespread dam construction and it has decreased to 12–13 Gt/ yr. Out of 145 major rivers with mostly more than 25-year record, only 7 showed evidence of an increase in sediment flux while 68 showed significant downward trends. The number of dams has increased continuously and their distribution has expanded globally. As of early 2011, the world has an estimated 16.7 million reservoirs larger than 0.01 ha. Globally, 34 rivers with drainage basins of 19 million km2 in total show a 75% reduction in sediment discharge over the past 50 years. Reservoir trapping of sediments is estimated globally as 3.6 Gt/ yr to more than 5 Gt/ yr (Syvitski et al., 2005; Walling, 2012; Milliman and Farnsworth, 2011). Human pressure is the main driver of the observed declining trend in sediment delivery to the coastline.(Chapter 5 Coastal systems and Low Lying areas)

“Attributing shoreline changes to climate change is still difficult due to the multiple natural and anthropogenic drivers contributing to coastal erosion.” (Chapter 5 Coastal systems and low lying areas)

“The combined impact of sediment reduction, relative sea level rise, land-use changes in delta and river management on channels and banks has led to the widespread degradation of deltas. The changes of sediment delivery from rivers due to dams, irrigation and embankments/dykes creates an imbalance in sediment budget in the coastal zones. Degradation of beaches, mangroves, tidal flats, and subaqueous delta fronts along deltaic coasts has been reported in many deltas (e.g. Nile and Ebro, Sanchez-Arcilla et al., 1998; Po, Simeoni and Corbau, 2009; Krishna-Godavari, Nageswara Rao et al., 2010; Changjiang, Yang et al., 2011; Huanghe, Chu et al., 1996; very high confidence). Deltaic coasts naturally evolve by seaward migration of the shoreline, forming a delta plain. However, decreasing sediment discharge during the last 50 years has decreased the growth of deltaic land, even reversing it in some locations (e.g. Nile, Godavari, Huanghe). Artificial reinforcement of natural levees also has reduced the inter-distributory basin sedimentation in most deltas, resulting in wetland loss.” (Emphasis added.)

“The major impacts of sea level rise are changes in coastal wetlands, increased coastal flooding, increased coastal erosion, and saltwater intrusion into estuaries and deltas, which are exacerbated by increased human-induced drivers. Ground subsidence amplifies these hazards in farms and cities on deltaic plains through relative sea level rise. Relative sea level rise due to subsidence has induced wetland loss and shoreline retreat (e.g. the Mississippi delta, Morton et al., 2005; Chao Phraya delta, Saito et al., 2007; high confidence).” (Chapter 5 Coastal systems and low lying areas)

“There have been local variations in precipitation and runoff since 1950, but changes in sediment load are primarily attributed to over 50,000 dams and vegetation changes.”  (Chapter 18: Detection and attribution of observed impacts)

  • Hydropower affects local options

“Hydropower dams along the Mekong River and its tributaries will also have severe impacts on fish productivity and biodiversity, by blocking critical fish migration routes, altering the habitat of non-migratory fish species, and reducing nutrient flows downstream. Climate impacts, though less severe than the impact of dams, will exacerbate these changes.”(Chapter 24: Asia)

  • Climate  change and dams together affect a greater eco-region

“For one climate scenario, 15% of the global land area may be negatively affected, by the 2050s, by a decrease of fish species in the upstream basin of more than 10%, as compared to only 10% of the land area that has already suffered from such decreases due to water withdrawals and dams (Döll and Zhang, 2010). Climate change may exacerbate the negative impacts of dams for freshwater ecosystems.” (Chapter 3: Freshwater resources)

  1. Flood Protection: Dams and embankments may do more harm than good. Ecological measures fare better.
  • “On rivers and coasts, the use of hard defences (e.g. sea-walls, channelization, bunds, dams) to protect agriculture and human settlements from flooding may have negative consequences for both natural ecosystems and carbon sequestration by preventing natural adjustments to changing conditions. Conversely, setting aside landward buffer zones along coasts and rivers would be positive for both. The very high carbon sequestration potential of the organic-rich soils in mangroves and peat swamp forests provides opportunities for combining adaptation with mitigation through restoration of degraded areas.” (Chapter 3 Freshwater Resources)
  • “Ecosystem based adaptation (EBA) can be combined with, or even a substitute for, the use of engineered infrastructure or other technological approaches. Engineered defenses such as dams, sea walls and levees adversely affect biodiversity, potentially resulting in maladaptation due to damage to ecosystem regulating services. There is some evidence that the restoration and use of ecosystem services may reduce or delay the need for these engineering solutions. EBA offers lower risk of maladaptation than engineering solutions in that their application is more flexible and responsive to unanticipated environmental changes. Well-integrated EBA can be more cost effective and sustainable than non-integrated physical engineering approaches (Jones et al., 2012), and may contribute to achieving sustainable development goals (e.g., poverty reduction, sustainable environmental management, and even mitigation objectives), especially when they are integrated with sound ecosystem management approaches.” (Chapter 3 and Also Chapter 15 Adaptation Planning and Implementation)
  1. Dams and Hydropower projects affect biodiversity, which is critical in facing climate change challenges
  • “Freshwater ecosystems are considered to be among the most threatened on the planet. Fragmentation of rivers by dams and the alteration of natural flow regimes have led to major impacts on freshwater biota.” (Chapter 4: Terrestrial and Inland Water Systems)
  • “Damming of river systems for hydropower can cause fragmentation of the inland water habitat with implications for fish species.” (Chapter 4 Terrestrial and Inland Water Systems)
  •  “Freshwater ecosystems are also affected by water quality changes induced by climate change, and by human adaptations to climate-change induced increases of streamflow variability and flood risk, such as the construction of dykes and dams”. (Chapter 3: Freshwater resources)
  • “Hydropower generation leads to alteration of river flow regimes that negatively affect freshwater ecosystems, in particular biodiversity and abundance of riverine organisms, and to fragmentation of river channels by dams, with negative impacts on migratory species. (Chapter 3: Freshwater Resources)
  • “Hydropower operations often lead to discharge changes on hourly timescales that are detrimental to the downstream river ecosystem.”
  • “Climate change and habitat modification (e.g., dams and obstructions) impact fish species such as salmon and eels that pass through estuaries.” (Chapter 5 Coastal Systems and low lying areas)
  1. In Tropics, global warming potential of hydropower may exceed Thermal Power
  • “In tropical regions, the global warming potential of hydropower, due to methane emissions from man-made reservoirs, may exceed that of thermal power; based on observed emissions of a tropical reservoir, this might be the case where the ratio of hydropower generated to the surface area of the reservoir is less than 1 MW/km2”.
  • “Reservoirs can be a sink of CO2 but also a source of biogenic CO2 and CH4” (Chapter 4 Terrestrial and Inland Systems)
  1. Dams increase vulnerability of weaker sections to climate change
  • “A number of studies recognize that not every possible response to climate change is consistent with sustainable development, since some strategies and actions may have negative impacts on the well-being of others and of future generations .For example, in central Vietnam some responses to climate change impact, such as building dams to prevent flooding and saltwater intrusion and to generate power, threaten the livelihood of poor communities. First, the relocation of communities and the inundation of forestland to build dams limit households’ access to land and forest products. Second, a government focus on irrigated rice agriculture can reduce poor households’ ability to diversify their income portfolio, decreasing their long-term adaptive capacity. Indeed, the consequences of responses to climate change, whether related to mitigation or adaptation, can negatively influence future vulnerability, unless there is awareness of and response to these interactions. Here, the role of values in responding to climate change becomes important from a variety of perspectives, including intergenerational, particularly when those currently in positions of power and authority assume that their prioritized values will be shared by future generations. (Chapter 20: Climate-resilient pathways: adaptation, mitigation, and sustainable development)
  •  “Some documented impacts on dams, reservoirs and irrigation infrastructure are: reduction of sediment load due to reductions in flows (associated with lower precipitation), positively affecting infrastructure operation (Wang et al., 2007); impacts of climate variability and change on storage capacity that creates further vulnerability; and failures in the reliability of water allocation systems (based on water use rights) due to reductions of streamflows under future climate scenarios” (Chapter 9: Rural Areas)
  • “Infrastructure (e.g. roads, buildings, dams and irrigation systems) will be affected by extreme events associated with climate change. These climate impacts may contribute to migration away from rural areas, though rural migration already exists in many different forms for many non-climate-related reasons.” (Chapter 9 Rural Areas)
  • “Changes in water use, including increased water diversion and development to meet increasing water demand, and increased dam building will also have implications for inland fisheries and aquaculture, and therefore for the people dependent on them” .
  • “In the case of the Mekong River basin, a large proportion of the 60 million inhabitants are dependent in some way on fisheries and aquaculture which will be seriously impacted by human population growth, flood mitigation, increased offtake of water, changes in land use and overfishing, as well as by climate change. Ficke et al. (2007) reported that at that time there were 46 large dams planned or already under construction in the Yangtze River basin, the completion of which would have detrimental effects on those dependent on fish for subsistence and recreation.” (Chapter 7 Food security and food production systems)
  1. Existing Dams have to be managed sustainably, with ecological considerations:
  • “Suggested strategies for maximizing the adaptive capacity of ecosystems include reducing non-climate impacts, maximizing landscape connectivity, and protecting ‘refugia’ where climate change is expected to be less than the regional mean. Additional options for inland waters include operating dams to maintain environmental flows for biodiversity, protecting catchments, and preserving river floodplains.” (Chapter 24:Asia )
  1. Hydropower itself is vulnerable to Climate Change
  • “Climate change affects hydropower generation through changes in the mean annual stream-flow, shifts of seasonal flows and increases of stream-flow variability (including floods and droughts) as well as by increased evaporation from reservoirs and changes in sediment fluxes. Therefore, the impact of climate change on a specific hydropower plant will depend on the local change of these hydro-logical characteristics, as well as on the type of hydropower plant and on the (seasonal) energy demand, which will itself be affected by climate change”
  • “Projections of future hydropower generation are subject to the uncertainty of projected precipitation and stream-flow. In regions with high electricity demand for summertime cooling, this seasonal stream-flow shift is detrimental. In general, climate change requires adaptation of operating rules which may, however, be constrained by reservoir capacity. Storage capacity expansion would help increase hydropower generation but might not be cost-effective.”
  • “Observations and models suggest that global warming impacts on glacier and snow-fed streams and rivers will pass through two contrasting phases. In the first phase, when river discharge is increased due to intensified melting, the overall diversity and abundance of species may increase. However, changes in water temperature and stream-flow may have negative impacts on narrow range endemics. In the second phase, when snowfields melt early and glaciers have shrunken to the point that late-summer stream flow is reduced, broad negative impacts are foreseen, with species diversity rapidly declining once a critical threshold of roughly 50% glacial cover is crossed.” (Chapter 3 Freshwater Resources)

Let us hope that these collated finding will be helpful in addressing the myth that dams and hydropower projects are climate friendly and can even be looked at as adaptation measures. Let us also hope that the Working Group III Report, which will come out in less than a week’s time from now, will have lessons for hydropower development in line with the above statements in the WG II report.

Issues with WG III, Special Report on Renewable Energy

Findings of WG II contrast strikingly with Special Report on Renewable Energy Sources and Climate Change Mitigation (SRREN) [4]brought out by Working Group III in 2011.

SRREOne of the two lead coordinating authors of this report was Dr. Arun Kumar, from AHEC, IIT Roorkee. Notably, Dr. Kumar was also a part of the team which worked on Cumulative Impact Assessment of Hydropower projects in Upper Ganga basin of Uttarakhand[5]. The state suffered huge flood and precipitation damages in June 2013 (long after the report came out) and commissioned and under–construction hydropower projects had a large role to play in compounding the impacts of the disaster[6]. Ministry of Environment and Forests as well as the Supreme Court of India rejected this report. SANDRP had published a detailed critique of this CIA report at the outset.
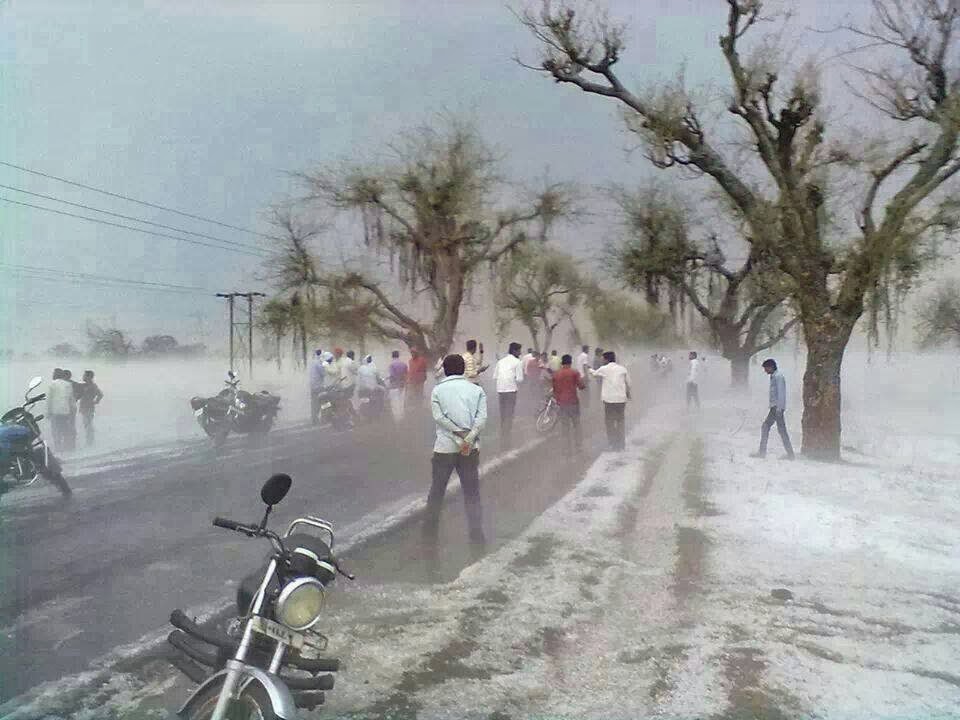
Amazingly, the Hydropower Section of the above mentioned IPCC Special Report on Renewable Energy severely downplays and ignores the impacts of hydropower. For example, it does not allude to peoples protests to projects, impacts of projects by blasting and tunneling, downstream impacts, impacts of peaking, associated deforestation and related development, cumulative impacts of projects in a cascade, increasing climate vulnerability of the population, seismic impacts, increased disaster vulnerability of the region, etc.,. In fact, these impacts have been some of the most-discussed issues in hydropower discourse in many countries at the moment. The report makes strange statements like “trans-boundary hydropower establishes arena for international cooperation”, when we see across the world that hydropower projects on internationally shared rivers further conflicts and strife between nations. It also downplays methane emissions from hydropower.

In all, the section appears biased towards hydropower and does not do justice to IPCC’s rigorous and objective standards. The section should not have been accepted as it stands now.

Now, the Working Group III is yet to submit its Assessment Report to the IPCC. It will be discussed by the IPCC between 7-11 April 2014, in Berlin. We hope there is true depiction of hydropower in the Working Group III report, looking at the above mentioned impacts and also keeping in mind strong statements from Working Group II report made public on March 31, 2014.

Parineeta Dandekar, parineeta.dandekar@gmail.com

~~~


[1] The IPCC Working Group I (WG I) assesses the physical scientific aspects of the climate system and climate change. Working Group II (WG II) assesses the vulnerability of socio-economic and natural systems to climate change, negative and positive consequences of climate change, and options for adapting to it. It also takes into consideration the inter-relationship between vulnerability, adaptation and sustainable development. The assessed information is considered by sectors (water resources; ecosystems; food & forests; coastal systems; industry; human health) and regions (Africa; Asia; Australia & New Zealand; Europe; Latin America; North America; Polar Regions; Small Islands). The IPCC Working Group III (WG III) assesses options for mitigating climate change through limiting or preventing greenhouse gas emissions and enhancing activities that remove them from the atmosphere. (https://www.ipcc.ch/working_groups/working_groups.shtml)

[2] https://www.ipcc.ch/

[3] https://www.ipcc.ch/pdf/ar5/pr_wg2/140330_pr_wgII_spm_en.pdf

[4] http://www.ipcc-wg3.de/special-reports/srren/special-report-renewable-energy-sources

[5] http://www.sandrp.in/hydropower/Pathetic_Cumulative_Impact_Assessment_of_Ganga_Hydro_projects.pdf

[6] https://sandrp.wordpress.com/2013/06/21/uttarakhand-deluge-how-human-actions-and-neglect-converted-a-natural-phenomenon-into-a-massive-disaster/

https://sandrp.wordpress.com/2013/06/23/uttarakhand-floods-disaster-lessons-for-himalayan-states/

https://sandrp.wordpress.com/2013/06/25/uttarakhand-and-climate-change-how-long-can-we-ignore-this-in-himalayas/

https://sandrp.wordpress.com/2013/08/14/uttarakhand-flood-disaster-supreme-courts-directions-on-uttarakhand-hydropower-projects/

https://sandrp.wordpress.com/2013/09/27/uttarakhand-floods-of-june-2013-curtain-raiser-on-the-events-at-nhpcs-280-mw-dhauliganga-hep/


Climate Change · Maharashtra

Maharashtra farmers face impacts of hailstorms and State’s “Inaction” Plan on Climate Change

Marathwada, Vidarbha, Northern Maharashtra and parts of Western Maharashtra are reeling under unprecedented hail storms and unseasonal rainfall. Hailstorms in end of February 2014, initially thought of as a one-off phenomenon, continue to batter places like Solapur for nearly two weeks now, absolutely destroying the farmer. Rabi crops like Wheat, Harbhara, Cotton, Jowar, summer onion are lost, horticultural crops like Papaya, sweet lime, grapes are battered and orchards which took years to grow are ridden to the ground. For many farmers the tragedy is unbearable as majority of crops were about to be harvested. Turmeric was drying in the sun, grapes were waiting to be graded, wheat was harvested and lying in the fields.

Hail in drought-prone Baramati. Photo from : eSakal

According to a preliminary estimate and news reports, crops over 12 lakh hectares have been severely affected, thousands of livestock, animals and birds have succumbed to injuries and diseases, which threaten to spread. Around 21 people have lost their lives to the disaster.[1]

Grapes destroyed. Photo from : Loksatta
Destruction in Latur Photo from: Dainik Ekmat
Hailstorms Photo from : eSakal

The hailstorms developed as a response to hot, damp air from Bay of Bengal as well as Arabian Sea, rising and meeting the cold air coming south from the Himalayas, which led to formation of huge hail. This, though, is a very preliminary understanding of the phenomenon and hopefully, a clearer picture will arise in some time.

According to news reports, Madha Taluka in Solapur alone received 208 mm rainfall, Kurduwadi received 154.1 mm rainfall and Pandharpur received 63.95 mm rainfall in a single day[2].

SANDRP compared this rainfall with the 1901-2002 district wise rainfall dataset of IMD available at India Water Portal. 208 mm rainfall in Madha in March 2014 is 771.79% higher than the highest recorded monthly district rainfall for Solapur District for the entire month of March in the 100 years between 1901-2002! The highest total recorded rainfall of March for the district was 26.95 mm in 1915 [3]. Similarly, 65 mm rainfall received by Ausa Taluka in Latur[4] is 146 % higher than the highest 100 year recorded March rainfall of the district in 1944. Similar is the case with Parbhani, Akola, Wardha, etc.

While district rainfall masks extreme spikes due to averaging and also due to the distribution and location of rain gauges, this is truly unprecedented.

But is it also truly unexpected?

Is Climate Change an unknown phenomenon to us? IPCC[5] has predicted that in peninsular India, rainfall patterns will become more and more erratic, with a possible decrease in overall rainfall, but an increase in extreme weather events. What we are witnessing is certainly an extreme weather event.

That climate change is happening and that the reasons are anthropological is beyond debate[6]. Unfortunately, Climate change, its scientific status, its impacts, adaptation and mitigation strategies to cope with the changing climate do not enter discussions in functioning of Maharashtra government with any seriousness. Being a fuzzy, global phenomenon, linking climate change to singular events is difficult, though climate scientists are unanimous that there is footprint of climate change in each such extreme weather event.

The complexity of this issue does not allow us to brush the issue under the carpet. In the recent floods of United Kingdom, the issue of climate change was debated and led to serious discussions between researchers, climate scientists, politicians and policymakers and it seems that it will lead to an action plan.[7],[8]

Significantly, there are studies that claim that Marathwada and other regions of Maharashtra are vulnerable to Climate Change. In a 2012 paper by ICRISAT “Vulnerability to Climate Change: Adaptation Strategies and Layers of Resilience” (2009-2012) by Naveen Singh et al, which was highlighted in the latest edition of Adhunik Kisan, a Marathi magazine on agriculture, the authors have warned that Semi-Arid Tropics (SAT) in Maharashtra (as also the country) are specifically vulnerable to Climate Change. Their analysis of Maharashtra has shown that Marathwada and parts of Vidarbha are particularly vulnerable to climate change challenges, which include increase in the incidence of extreme weather events. Vulnerability index depends not only on the changing climate, but also on the vulnerability of the communities in the region: Despite hundreds of dams, agriculture in Marathwada region is mostly rain-fed, miniscule area which is irrigated appropriates all the water and grows sugarcane: a crop fundamentally unsuitable for a drought prone region, making the lesser endowed communities more and more vulnerable to challenges posed by climate changes or even small natural oscillations in the weather. This was seen very starkly in 2012-13 drought, when the region had highest area under sugarcane in Maharashtra, but several villages did not have water for drinking and dams became pawns at the hands of politicians-cum-sugar kings of the region.[9]

The ICRISAT Paper says, “In the SAT region, [10]Rainfall variability over the years is the major cause of yield uncertainty and makes rain-fed agriculture one of the risky enterprises in SAT India.

In SAT region of Maharashtra, long-term climatic analysis undertaken by ICRISAT shows “an average rise of 0.02°C per year in annual temperature in the last 40 years. In addition, the mean surface air temperature is projected to rise by 1.7-2.0°C by 2030 and 3.4-4.5°C by 2080 from the 1960-1990 . According to simulation studies, there can be productivity losses from 5% to 18% from 2030 to 2080 if no effective mitigation measures are undertaken. Differential degree of drought together with unpredictable rainfall variability has become common. This situation makes it difficult for the farmer to take pre-emptive decisions, resulting in crop and economic loss. Everyone is affected by this sudden change in weather. However, the extent of damage caused will be dependent upon each one’s ability to cope with the deleterious effects. The evidence, although incomplete, is indicative of major changes in the climatic conditions at macro levels. However, this masks the situation and variance at the local level. Greater vulnerability at the local levels implies greater pressure at the state and national level governance systems to respond to prevent the spillover effects such as urban migration, socio-political instability and conflicts, national poverty indicators, increased demands on disaster response systems, depletion of food and fodder production, etc.” However, there is no mention of increasing coping capacity of the vulnerable and compensating those who lose and demanding that those who are responsible (High consumption sections of the world and India) pay for these impacts in this long list.

According to an undated report ‘Climate change in Maharashtra’[11] brought out by Met Office (Hadley Centre, UK), TERI and Government of Maharashtra:

  • “Increased temperatures and altered seasonal precipitation patterns (both quontum and timing) could affect the hydrological systems and agricultural productivity.
  • Increased risk of severe weather events may have a      devastating impact on agriculture, water resources, forestry and the well-being of the population.
  • TERI states that due to changing climate, Sugarcane yield in Maharashtra could go down by 30%

 When all this is known, what is Maharashtra’s response to these predictions and the looming challenge of Climate change?

 The National Action Plan on Climate Change was made public in June 2008 amidst huge fan fare by PM Manmohan Singh.[12] It was mandated that states will come up with State Action Plans for Climate Change by 31st March 2011. These State Action Plans would outline the vulnerability of the state as whole as well as specific regions and specific communities in the state to Climate change and recommend a strong adaptation and mitigation plan for overcoming these challenges. Till date (11th March 2014), SAPCCs of 12 states have been submitted to the MoEF. [13]

Maharashtra Cabinet had reportedly approved a State Action Plan for Climate change prepared by its environment department on Aug 20, 2009[14], however, the Maharashtra’s Action Plan is not finalized till date. When enquired about the status of this plan, the Director in Environment Department, Government of Maharashtra told SANDRP that they had contracted the plan to TERI and TERI has not completed the task till date.

Given the gravity of the issue, the State Action Plan for Climate Change is supposed to be overseen by a High Powered Committee, whose Chairperson is the Chief Minister, with participation from ministers of Urban Development, Public Works, Transport, Agriculture, Water resource, Revenue & Forest, Energy, industry, Food, Civil Supplies & Consumer Protection Department and Education Department.[15] The agenda and minutes of meetings of this High Powered Group should have been in public domain, but none are.

A formal contract was signed between Government of Maharashtra and TERI in March 2010 and TERI was supposed to submit a complete report in two years, i.e., by March 2011. However, Maharashtra still does not have a state action plan, indicating its lack of seriousness about Climate Change and vulnerable communities.[16]

As Maharashtra continues to be battered by hailstorms, rainfall and winds, it is not useful to get into discussions of whether this is due to climate change or not. The challenges right now is to devise strategy that will help the most vulnerable sections of Maharashtra: its farmers, more than 85% of whom practice rain fed agriculture. It is time not only to seriously revamp the nearly non-existent disaster management systems, but also the weather prediction and crop insurance systems. To build resilience of farming communities, reliance cannot be put on monoculture like sugarcane which does not allow even protective irrigation to a large proportion of farmers outside the sugarcane belt.

After closely spaced events like Mumbai floods in July 2005, Phyan cyclone in 2009, 2012-13 drought, erratic monsoon rainfall and current hailstorms, Maharashtra cannot afford to drag its feet on addressing climate change challenges, organizations like WOTR are specifically working on strengthening capacities of local communities to adapt to challenges thrown by Climate change[17]. Let us hope that at least State Action Plan on Climate change is finalized, not only by the experts from far away, but with full participation of the people of Maharashtra. Similar rain induced damages are also being witnessed in the North India and scientists fear that the coming monsoon may suffer due to El Nino effect. (http://timesofindia.indiatimes.com/business/india-business/Fears-of-El-Nino-on-rise-may-spell-woes-for-the-economy/articleshow/31824485.cms)

In the meantime, the least that the government of Maharashtra and also the Union Government can do is to compensate the affected farmers irrespective of red tapes and Codes of conduct.

High-end consumers and polluters of India and abroad contribute to climate change, which ironically hits the poorest sections  of the society harder. This gives an added urgency to address these linked issues.

Parineeta Dandekar, parineeta.dandekar@gmail.com


[1] Sakal (Marathi) Newspaper, 11 March 2014

[10] The semi-arid tropics (SAT) region is characterized by highly variable, low-to-medium rainfall and poor soils, further characterized by lack of irrigation. In general, the historical average annual rainfall in the SAT is below 700 mm. In agricultural policy terms, this region is considered to be a less favored area (LFA) (ICRISAT)

[17] http://www.wotr.org/climate-change-adaptation

http://www.wotr.org/audio_visuals_english/does-it-ever-rain-time

[18] VERY TRAGIC story of how hailstorms have hit poor farmers in Marathawada in Maharashtra: http://www.livemint.com/Specials/jkcra6zQqMShlFJjzmvXeN/Death-and-despair-in-hailstormhit-Marathwada.html

[19] Maharashtra State Action Plan on Climate change: Farmers Suffer, State and consultant TERI unaffected https://sandrp.wordpress.com/wp-admin/post.php?post=2529&action=edit

Climate Change

27th Dharati Jatan Annual Festival Honoured Eco-warriors: A Different Conference of Parties that Actually Addresses Climate Change

It was certainly a Conference of Party (COP) of sorts. Those present included farmers, women, academics, media persons, delegates from other states (Gujarat, Madhya Pradesh, Uttar Pradesh, Delhi), Non Government Organisations and elected representatives. It also happens to be an annual event that has been going on for 27 years. It was certainly celebrating the work that actually helped mitigation and adaptation in changing climate in both drought and flood related possibilities. It was also happening on the same dates as the COP 19 was going on far away in Warsaw, Poland.

One of the two streams of Yatra arrives at Nagar

It was an honour for me to be present at Nagar village in Malpura block in Tonk district in Rajasthan at the 27th annual Dharati Jatan conference where the Pad Yatra from two different streams that culminated. Five eco warriors were honoured at this meeting with a certificate, silver medal, shawl and other ceremonial gifts. They were being honoured for their work related to tree plantation, soil and water conservation and protection of grazing land.

As speakers at the conference on November 16, 2013 narrated, this annual festival is a remarkable achievement by the Gram Vikas Nav Yuvak Mandal at Laporiya in Dudu block in Jaipur district, led by Laxman Singh, now famous for his grazing land protection through the unique chauka system.

The Yatra prepares for the worship of the Nagar village tank

Experience of the marchers The leaders of two streams of marchers presented their experience. Rameshbhai Saini, leader of the first stream that marched through the 15 villages of Dudu block (Jaipur district) also mentioned the difficulties people are facing. For example, he mentioned how Phulsagar, one of the tanks  in Laporia is encroached and communities’ efforts to remove the encroachment did not succeed as the encroacher had the support of the Rajasthan minister Babulal Nagaur who is also the member of the Legislative assembly from the local area.

Ramjilalji, the leader of the second stream that walked through Malpura block villages (Tonk district) starting from Sindolia village, also said that  encroachments on tanks are  increasing under  political support and when volunteers try to remove such encroachments to save the water bodies, they are faced with court cases. He also said that the state government is laying long distance pipelines and building cement containers to bring the water from mega dam Bisalpur to the villages in the area. He very pertinently asked, will we allow our water harvesting culture to be destroyed since now we have this piped water supply? Reflecting unconvincingly on this dilemma, the letter from state government’s principle secretary Purushottam Agarwal (he was supposed to come for the function, but had to travel elsewhere due to some family emergency and hence sent a letter) suggested that the pipelines are only for drinking water and tanks that the GVNML has helped build are for irrigation and other purposes. The fact is that the state government made no effort to consult the people before coming up with the pipeline scheme. Kesarbhai, active in Mahoba district in Uttar Pradesh described the Apna Talab Abhiyaan through which already 70 talabs (tanks built with earthen bunds) have been built in less than a year.

Participants from other states Pankaj Shrivastava from Mahoba appreciated that communities in GVNML area have system of imposing fines when anyone is caught polluting the lakes (as reflected in the wall writing in the photo below at the Nagar village tank).

The wall writing at the tank in Nagar village explains the fine system

He also said that the communities in their area is trying to clean up Kiratsagar lake in Mahoba through a focused campaign since Oct 5, 2013. Mavjibhai from Vivekanand Research & Training Institute, Bhuj (Kutch in Gujarat) said that they plan to take up implementation of chauka system in 55 villages along the 60 km long Rukmawati river in their area.

The Awards The five awards presented on this occasion were indeed very well deserved ones. The managing committee of Akodiya village (Dist Ajmer) was recognised for the tradition of collective management of common property resources including grazing land and water harvesting systems. 

certificate 1

Rajjak Sheikh of village Tikel (Block Dudu in Jaipur district) was honoured for planting long living trees like peepal, Banyan, neem and other local varieties along the tank embankment over the last five years through his own efforts. He also got the fisheries contract given for the village tank canceled and got some of the hunters caught at his own personal risk.

certificate 2

Next, Shravanlal Jaat, a shepherd of village Kalyanpura (Dudu, Jaipur) was given the Dhudhad Ratan prize for consistently planting large number of trees in grazing land and along the village tank with his own personal effort and expenses for more than five years and also taking care of the planted trees.

certificate 3

Efforts of Umrao Godha, a relatively rich man of village  Jhirota in Ajmer district were recognised for transforming the village with institutions like school, health centre and also for planting and taking care of large number of villages. Enthused villagers elected him as village head.

certificate 4

Khivsingh Rajput, an old man of Bikhraniya Kalan village from relatively far off Nagaur district (Marwad area) was also honoured for his 20 year old campaign in the village to plant long living Banyan and other trees in very dry area. He also inspired people to donate money and collected Rs 5 lakhs to deepen, renovate and strengthen the village tank.

certificate 5

Relevance for climate change The work of GVNML in the region is remarkable in many respects. The water conservation work helps recharge the groundwater and this water is then available in years of deficit rainfall, the frequency of which is bound to increasing in warming climate. Similarly, the whole area has created such a remarkable water conservation system that even when rainfall is excessive, this area will not face any floods since the water will be stored and only slowly released. The soil here has increased carbon content which also helps hold the moisture much longer, thus helping overcome the dry spells which has also increased in recent years. Thus it is clear that the that is underway over the last over three decades under GVNML has huge implications in the climate change context. The COP 19 talks at Warsaw remains deadlocked, waiting for some façade to emerge to show progress, this different COP 27 at Nagar shows so much progress is possible when the communities are at the helm of the affairs. It is doubtful though that the lessons from COP 27 at Nagar will have any impact on COP 19 at far away Warsaw.

Himanshu Thakkar (ht.sandrp@gmail.com)


Climate Change · South Asia

Climate Change, Migration and Conflicts in Assam-Bangladesh: Why we need better reports than this

A new report named “Climate Change, Migration andClimateMigrationSubContinent_COVER Conflicts in South Asia: Rising tension and Policy options across the sub-continent” was published in December 2012 by Center for American Progress and Heinrich Böll Foundation. This report, authored by Arpita Bhattacharyya and Michael Werz has analyzed how migration and security concerns are overlapping in the era of climate change in South Asia. Even though the title of the report mentions South Asia, it is mainly focused on India and Bangladesh. The central argument of the report is that an inevitable threat of climate change will intensify migration from Bangladesh to Northeast India, in general and Assam in particular.

In this report the authors have examined the role of climate change, migration, and security broadly at the national level in India and Bangladesh. Discussing the focus and relevance of the report the authors write “In this paper we examine the role of climate change, migration, and security broadly at the national level in India and Bangladesh—and then zero in more closely on northeast India and Bangladesh to demonstrate the interlocking problems faced by the people there and writ larger across all of South Asia.” But the report falls short of indentifying a causal relationship between climate change, migration, and conflict. This report emphasizes on understanding climate change, migration and security as three distinct layers of tension and assesses scenarios in which the three layers will overlap. The report takes Assam, the central state of northeastern border of India as a case study where the three factors converge. But the elements related to this convergence are rather inadequate that required further probing.

The report discusses the Assam movement of 1983 and the    clashes which  occurred in the summers of 2012 between ‘members of the Bodo tribe and  and  Muslim community’. Bringing climate change into the framework the report states “In assessing the security challenges of climate change, Assam provides an example of several factors coming together in a complex way. Climate change will stress existing migration patterns both locally and internationally in Bangladesh. Even more importantly, the perception that there has been an increase in immigrants has the potential to stoke tensions over immigration in Assam.” It seems to be generalization of a very complex process. We have found towering claims like this have very less linkages with the situation on ground(please see our blog – 2012 Floods Displaced 6.9 Million in Northeast-IDMC: Staggering but Highly Exaggerated). The report also mentioned that “Floods in September 2012 displaced 1.5 million people in the northeastern state of Assam” this again is not beyond doubts. The data available from National Disaster Management shows that, highest number of people affected in the floods in September 2012 is 383421.

Climate Change Scenario in India: For India the report draws from the “Climate Change and India: A 4×4 Assesment” (2010) which was prepared by the Indian Ministry of Environment and Forests for examining climate change impacts and projections through 2030 across four regions of India (the Himalayan Region, Western Ghats, Northeastern Region, and the Coastal Region) and four key policy sectors: agriculture, forests, human health, and water.

Bangladesh Discussing the situation in Bangladesh the reports deals with rising temperatures which are likely to have severe effects on agricultural production in Bangladesh due to higher rates of evaporation and changing rainfall patterns. According to the authors “Bangladesh could see up to an 8 percent reduction in rice production and a 32 percent reduction in wheat production by 2050…. With 63 percent of the population dependent on agriculture for basic livelihoods, the rise in temperatures could be crippling.”

The report warns about increases both in extent and frequency of floods in the country. Talking about rise in sea level the report states, “The Bangladeshi government projects that the sea level will rise by 5.5 inches (14 centimeters) by 2030, 12.6 inches (32 centimeters) by 2050, and 34.7 inches (88 centimeters) by 2100. Predictions about the displacement of people resulting from a 1-meter (roughly 40 inches) rise in sea-level range from 13 million to 40 million in Bangladesh alone.” The report also discusses cyclone and storm surges, river and coastal erosion and saltwater intrusion. Bringing migration into the picture, the report first discusses rural urban migration within Bangladesh and describes a situation of migrants in the capital city Dhaka “When describing why they came, migrants tell stories of flood and famine in quiet rural towns where options dwindle by the day … these villagers pour into Dhaka at a rate of about 400,000 to 500,000 each year.”

Talking about international migration from Bangladesh, the report states “More informal—but still substantial—migration takes place from Bangladesh to India, especially to the far eastern Indian states of West Bengal and Assam….. It is estimated that approximately 12 million to 17 million Bangladeshi immigrants have come to India since the 1950s, with most residing in the northeast states of West Bengal, Assam, and Tripura.” In this situation presenting the interplay of migration and climate change the report says, “How climate change will effect migration to Bangladesh’s urban centers is not exactly determined. Even more uncertain is how climate change and Bangladesh’s urban growth will interact to shape international migration, particularly to India. But given the trajectory of available climate change projections and historical precedent, India may continue to be a popular destination for many Bangladeshi migrants.” However this seems to be an opaque statement without any substantiation. Instead of pitching their argument in the ahistorical categorization between an underdeveloped Bangladesh and an emerging India, the author should consider the present human development indicators of Bangladesh vis-à-vis India  (please see “Social indicators of Bangladesh are better than India”).

As a part of the solution, it suggests building of sustainable urban areas where governments manage to guarantee food security, deliver required energy resources, and develop infrastructure to more effectively protect livelihoods in rural areas. However, its suggestion that “economic growth must be maintained to accommodate growing populations and allow society to better prepare itself to deal with the impacts of climate change” seems to suggest that the authors have not understood basics of both economic growth and re-distribution as well as  climate change.

The American Perspective The paper does not provide any adaptation and mitigation measures for climate change. The paper argues for changing the pathways of growth towards greater sustainability. Talking about modern sustainable urban centers the paper focuses on the areas where U.S.-Indian cooperation can happen. The report is written in order to assess how United States can play a pivotal role in the threats and consequences of climate change arena in South Asia and that is why ‘the American perspective’ on the climate change in South Asia can be all pervasively found in the report. The report propose three policy collaborations that the United States can take up with South Asian partners as complex crisis scenarios unfold in the wake of climate change – 1. High-level climate-vulnerable cities workshop, 2. A dialogue on migration and 3. Ecological infrastructure development.

Pressing Critical issues

There are a lot of critical issues with this report which needs to be addressed.

How much migration is actually happening now: The report establishes its firm belief in the fact that large scale migration from Bangladesh to northeastern parts of India is still continuing. The report should have first questioned how much migration is actually happening rather than claiming that there will be increase in migration in the near future. There were several analysis available specially drawn from Government of India’s Census data which shows a complete different picture.  In an article named “Riots & the Bogey of Bangladeshis”, published in Hindu on 8th August 2012,  Delhi base researcher and activist Bonojit Hussain did an analysis of census data and reported that “Even though the religion-wise census figures for 2011 are not yet available, provisional results from the 2011 census show that the decadal growth rate of population between 2001-2011 for Kokrajhar district is 5.19 per cent, interestingly, marking a decline of 9 per cent as compared to the decadal growth rate of 14.49 per cent between 1991 to 2001. (The decadal growth rate for Assam between 1991 to 2001 was 18.92 per cent and 16.93 per cent between 2001-2011)……. The other possibility, which seems more plausible, is that there has been a considerable out-migration from Kokrajhar, especially after the formation of the BTAD in 2003. Since the Bodos (who constitute 20 per cent of the population in the BTAD area) hold a monopoly over political power in the area, it is unlikely that there has been any significant out-migration of the Bodo population from Kokrajhar district. The Koch Rajbangsis, who constitute roughly 17 per cent of the total population of the BTAD, have been campaigning for and demanding a separate homeland — Kamtapur — which territorially overlaps the BTAD, thus making it unlikely that they would out-migrate, abdicating their political claim over the territory. In all probability, the out-migration involves other non-Bodo communities, including Muslims.” The report seems to ignore this reality. It is also important to note that the report has very little to substantiate its assumptions.

Social indicators of Bangladesh are better than India: The report seems to ignore the substantial improvements in social indicators in Bangladesh. A recent review of Jean Drèze and Amartya Sen’s new book ‘An Uncertain Glory,’ states the improved social conditions of Bangladesh in the following way “even Bangladesh has better social indicators than India. It has higher life expectancy (69 vs India’s 65), better sanitation (half of all homes in India have no toilets compared to 10 per cent in Bangladesh), lower infant mortality (37 versus India’s 47) and lower fertility rate (2.2 against 2.6 for India). For those arguing that Bangladesh is a much smaller country, the answer is that its GDP per capita is roughly half that of India’s.”[1]

Is urbanization the only option: The report is biased towards urbanization. The report shows no interest to discuss how rural areas can be prepared to face climate change better. Projecting sustainable urbanization as the solution for migration is presenting only one side of the story. The report also seems like an attempt to push forward American agenda in South Asia. The report laments the facts that the urbanization programmes like JNNURM is facing shortage of funds.  But there are already several examples JNNURM programmes in India which are increasing the debt burden on the people and undermined the traditional sustainable systems.

Are thermal and large hydro-power projects climate friendly: The report on climate change shockingly, reemphasizes on coal based power generation. A study on climate change prescribing for coal based power generation is really very strange.

In another surprise the report, shows bias for (large) hydro power generation, even though hydro-power dams have very severe impacts on river ecology, bio-diversity and climate change. While discussing about water politics between China, India and Bangladesh the report mentioned about the fear of water diversion by China through hydro power dams and its severe impacts on flow of the Brahmaputra. But it makes no mention of more than 150 hydro power projects, which are being planned in Arunachal Pradesh and other north eastern states within the Indian territory and the downstream impacts of these. These projects will dam every major tributary of the Brahmaputra River. These tributaries collectively contribute at least four times more to the flow of the Brahmaputra than Yarlung Tsangpo or Siang, the part of Brahmaputra which flows from China. The report has no reference to any of this.

Internal migration within Assam and India: The report talks about migration from Bangladesh to Assam but it makes no mention of people migrating from rural areas of Assam to other cities due to severe flood and erosion. The report also does not take into account the case of char-dwellers (people living in sand bars) in Bangladesh and Assam. According to the Socio Economic Survey of 2003-04 in 14 districts of Assam, there were 2251 char villages with a population of 24, 90,397.[2] People who live on chars in Assam and in Bangladesh will be directly affected by any change in flow pattern in the rivers.

Spreading propaganda? Though this report is on migration from Bangladesh to Assam, the report presents very little data to back up its claims. Besides, on the issue of increasing Maoist activity in India, the report does a shoddy job. The map showing maoist activities in India is questionable. Since this report accepts the current development path of coal based and large hydro-based power generation unquestionably, the discussion on Maoist activity in India resonate with Assam’s Chief Minister Tarun Goigoi’s unfounded attempts at colouring of anti-dam struggle of the people in Assam as Maoist activity. Such uncritical acceptance of Indian government’s unfounded assertions discredits the report.

Parag Jyoti Saikia


[1] http://www.thehindu.com/books/books-reviews/the-inequalities-of-democracy/article4941693.ece

[2] Chakraborty G.,”Distortion  of Natural Watersheds and Land Erosion: The Char Areas Of Assam”, SIBCOLTEJO, Vol. 05 (2010): 18-30

Climate Change · Uttarakhand

Uttarakhand Rainfall: Since 1901 and in light of the 2013 disaster

During the tragic Uttarakhand disaster, one of the most discussed but the most elusive topics has been rainfall. Uttarakhand, though having experienced frequent extreme weather events, has a poor distribution of rain gauge stations and weather monitoring. The worst hit districts like Rudraprayag, Chamoli and Pithoragarh have especially dismal distribution of monitoring stations, making it impossible for us to understand the intensity of rainfall in places like Kedarnath when the disaster struck. (https://sandrp.wordpress.com/2013/06/21/uttarakhand-deluge-how-human-actions-and-neglect-converted-a-natural-phenomenon-into-a-massive-disaster/)

According to the Indian Meteorological Department (IMD) June 2013 rainfall was over thrice the normal amount between June 1 and 21. The highest figure quoted by IMD was 370 mm a day at Dehradun, which was said to be ‘a record not seen for five decades’. IMD has also said that in the week of 13th to 19th June, the entire state of Uttarakhand received 847% excess rainfall, and that this has no precedent.[1] However, according to experts, this generalisation of a very diverse state does not depict the true picture.

Nonetheless, it is worthwhile to string together whatever data we have on Uttarakhand’s rainfall in order to get a clearer picture of rainfall trends, and also underline the fact that Uttarakhand and all the other Himalayan States need a much denser network on weather monitoring stations, representation all altitudes, river basins & sub-basins and climatic zones. Only then will the data be a useful tool in planning and forecasting.

In this piece, we have tried to analyse rainfall datasets of the hundred years (1901-2000) for some of the worst affected and vulnerable districts of Uttarakhand. This data has been obtained from Indian Meteorological Department. Districts analysed include Uttarkashi, Rudraprayag, Haridwar, Chamoli, Tehri Garhwal, and Pithoragarh.

While we have rainfall data from 1901-2000 (with some gaps), there is a gap in the data during 2000-2008. Then again we have data from 2008-2012 and 2013 till 25th September 2013. (All figures from IMD – India Meteorological Department – http://imd.gov.in/).

What we have attempted here is:

1.     Identification of Top 5 Maximum and Minimum rainfall events in the selected 7 districts in the past 100 years. Comparison of these values with 2013 Maximum monthly rainfall

Interesting to note that the only time when 2013 monthly (approximate, as we have weekly figures from IMD, not monthly ones) features in top 5 monthly rainfall is for Chamoli, in July 2013! 537.9 mm rainfall it received in July 2013 was the second highest recorded rainfall in the district since 1901-2000 and 2008-2013.

2.   100 year monthly monsoonal and annual rainfall for selected 7 districts, 2008-2012 monsoonal and annual rainfall for selected 7 districts.

3. 2013 weekly rainfall collated in respective months for June, July and August for the seven districts.

Results:

1.             Dehradun: 

  • Maximum monthly rainfall in last 100 years during monsoon months (Same for all districts below): 1271 mm in August 1943
  • Minimum rainfall in last 100 years during monsoon months: 20.4 mm in June 1965
  • Maximum rainfall of 2013 compared with the 5 previous maximums: In August 2013 it received 676.7 mm rainfall which was maximum for the district in 2013 monsoon.

However, this did not figure amongst the top 5 values for monsoon rainfall in the period considered.

  • Rainfall during the week 13-06-13 to 19-06-13: 565.4 mm
  • Departure from normal for the same week – 1436%

Dehradun_Reshaped

Deharadun_100_Years

2. Uttarkashi:

  • Maximum rainfall in last 100 years: 800.8 mm in August 1963
  • Minimum rainfall in last 100 years: 36.8 mm in June 1987 
  • Maximum rainfall of 2013 compared with the 5 previous maximums: In 2013, 529.9 mm received in June was the highest for the 2013 monsoon season.

However, this does not feature among the top 5 values for monsoon rainfall in the period considered.

  • Rainfall during the week 13-06-13 to 19-06-13: 375.6 mm
  • Departure from normal for the same week: 1356%

Uttarkashi_ReshapedUttarkashi_100_Years

3. Tehri Garhwal-

  • Maximum rainfall in last 100 years 1097 mm in September 1995
  • Minimum rainfall in last 100 years- 0 mm in September 1997
  • Comparison of 2013 max rainfall with the previous 5 maximum: In 2013, 453.4 mm rainfall received in June was the highest for the 2013 monsoon season.

However, this does not feature among the top 5 values for monsoon rainfall in the period considered.

  • Rainfall during the week 13-06-13 to 19-06-13: 327.7 mm
  • Departure from normal for the same week – 390%Tehri Garhwal_ReshapedTehri Garhwal_100_Years

4. Haridwar-

  • Maximum rainfall in last 100 years: 848.2 mm in September 1924
  • Minimum rainfall in last 100 years: 0 mm in September 1971
  • Maximum rainfall of 2013 compared with the 5 previous maximums: In 2013, 426 mm rainfall received in August was the highest for the 2013 monsoon season.

However, this does not feature among the top 5 values for monsoon rainfall in the period considered.

  • Rainfall during the week 13-06-13 to 19-06-13: 298.8 mm
  • Departure from normal for the same week – 1283%

Hardwar_Reshaped

Hardwar_100_Years

5. Rudraprayag

  • Maximum rainfall in last 100 years 914.6 mm in August 1925
  • Minimum rainfall in last 100 years 0 mm, in September 1971
  • Maximum rainfall of 2013 compared with the 5 previous maximums: In 2013, 664 mm rainfall received in June was the highest for the 2013 monsoon season.

However, this does not feature among the top 5 values for monsoon rainfall in the period considered.

  • Rainfall during the week 13-06-13 to 19-06-13:366.3 mm
  • Departure from normal for the same week – 580%

Rudraprayag_ReshapedRudraprayag_100_Years

6. Pithoragarh-

  • Maximum rainfall in last 100 years 1057 mm in August 2000
  • Minimum rainfall in last 100 years 22 mm in June 1901
  • Maximum rainfall of 2013 compared with the 5 previous maximums: In 2013, 471.9 mm rainfall received in July was the highest for the 2013 monsoon season.

However, this does not feature among the top 5 values for monsoon rainfall in the period considered.

  • Rainfall during the week 13-06-13 to 19-06-13: 246.9 mm
  • Departure from normal for the same week – 238%

 Pithoragarh_ReshapedPithoragarh_100_Years

7. Chamoli

  • Maximum rainfall in last 100 years860.7 mm in September 1924
  • Minimum rainfall in last 100 years– 0 mm in 1998
  • Maximum rainfall of 2013 compared with the 5 previous maximums: In 2013, 537.9 mm rainfall received in July was the highest for the 2013 monsoon season.

It was a second maximum recorded rainfall since 1901-2000 and 2008-2013.

  • Rainfall during the week 13-06-13 to 19-06-13: 316.9 mm
  • Departure from normal for the same week – 1302%

Chamoli_Reshaped

Chamoli_100_Years

8. For Uttarakhand state-

  • Maximum rainfall in last 100 years685.6 mm in August 1922
  • Minimum rainfall in last 100 years 28.1 mm in September 1907
  • Maximum rainfall of 2013 compared with the 5 previous maximums: In 2013, 510.4 mm rainfall received in June (June 1 to July 3) was the highest for the 2013 monsoon season.

However, this does not feature among the top 5 values for monsoon rainfall in the period considered.


Uttarakhand_ReshapedUttarakhand_100_years

In conclusion While presenting data for entire districts, we realise that there have been major variations in rainfall experienced within a district, for example, parts of Pithoragarh received extremely high rainfall during 15th-19th June, but the average rainfall for Pithoragarh District in June 2013 (Period between 06.06.13-03.07.13) is only 418.4 mm. The week between 13 June 2013-19th June 2013 shows only 238% departure from normal rainfall, when the higher reaches of Pithoragarh received some of the heaviest rainfall in Uttarakhand in June 2013.

As per researcher Emmanuel Theophilus, from Himal Prakriti at Munsiyari, Pithoragarh, the rainfall data with IMD for the entire Pithoragarh Districts  is  only from 2 stations in  the mid altitude areas, where it hardly rained much. Hence, the discrepancy, of Pithoragarh having only a 238% departure from normal, whereas the NASA maps show one of the darkest blue spots in Pithoragarh as well. In addition, he says: “IMD has only a very few stations scattered sparsely over the state, and what they have, are located in central district and sub-division office locations. Sure this makes for easy gathering of data, but is of little use for understanding any particularities, even at the sub-basin scale. In just the Gori sub-basin (Pithoragarh) for example, rainfall can vary from 15 cm annually, (spread over ~28 rainy days a year, and not counting snow) in the higher alpine Trans-Himalaya reaches, to as much as 4 meters, yes meters, of rain annually (spread over ~152 rainy days a year, and again not counting snow) just 50 km downstream, in the Greater Himalaya. Therefore, statements such as ‘the entire state of Uttarakhand received 847% excess rainfall’, can be misleading.”

After the Uttarakhand Disaster of unprecedented proportions, let us hope that now IMD, Uttarakhand Government, heavily funded programs like National Climate Mission, Universities, research institutes[2], etc can come together to create reliable and representative weather monitoring stations in the vulnerable state. Only through such data will a robust forecasting system be supported.

Damodar Pujari and Parineeta Dandekar

END NOTES:


[1] From Emmanuel Theophilus: A River Pulse. A discussion paper on the flood-events in June 2013, Mahakali basin, Uttrakahand. Himal Prakriti, Sept 2013

[2] Here it may be noted that some institutes have their own automatic and other rain-gauge stations, but data from such stations is not in public domain. For example, Wadia Institute of Himalayan Geology (http://www.wihg.res.in/) is supposed to have at least two automatic weather stations at Chorabari lake upstream of the worst impacted Kedarnath, but the data from these stations was not put up in public domain promptly or even now. Such data can be of great use for disaster forecasting, management and other purposes, but cannot be put to use without the data being in public domain.

brahmaputra · Climate Change · Indus

IWMI report on Glaciers and Snow cover in Himalayas in Changing Climate: Significant Impact on Seasonal flow of the Rivers in India

International Water Management Institute (IWMI) has recently published a study named  Glacier Systems and Seasonal Snow Cover in Six Major Asian River Basins: Hydrological Role under Changing Climate, authored by Oxana S. Savoskul and Vladimir Smakhtin which claims that the hydrological role of the melt-water resources in six major rivers e.g. Indus, Ganges, Brahmaputra, Syr Darya, Amu Darya and Mekong of the Hindukush-Himalayan region (HKH) has been comprehensively assessed for the first time on a basin scale. Reviewing already published studies, this report draws some interesting conclusions regarding the role of glacier and snow meting for six river basins which includes three major rivers basins of India.

The map below shows area of the river basins included in this study. In this report, the term ‘melt-water resources’ has been used to cover glacier systems and seasonal snow cover. This report uses 1961-1990 status of melt-water resources as the baseline and compares with the 2001-2010 using the following characteristics: specific glacier runoff (average depth of annual discharge from glacier-covered area), basin total glacier runoff, shares of renewable and nonrenewable components in glacier runoff, total seasonal surface snowmelt from non-glaciated areas, portion of seasonal snowmelt lost for the recharge of groundwater aquifers, the contribution of glacier runoff and seasonal snowmelt to mean annual flow (MAF).

Map from the report showing the boundaries of the study basins (red line), state borders (light yellow line) and snow-covered high-altitude belts where glaciers are located (white spots
Map from the report showing the boundaries of the study basins (red line), state borders (light yellow line) and snow-covered high-altitude belts where glaciers are located (white spots)

The authors have used Glacier mass budget-based methods and hydrograph separation techniques which they stated as suitable for basin-scale assessments instead of the temperature-index methods. They say that application of these two methods in semi-distributed models can give the highest currently possible accuracy of +30%. The authors opine that many of the studies done previously had confused between the ‘snowmelt’ and ‘glacier-melt’ because these studies have not dealt with terminologies and methodologies in detail. The report states that there is a scarcity of glacier runoff estimates in peer-reviewed papers, “An analysis of publications on modeling runoff from large- and medium-scale glaciated catchments….. indicates that not many of these dealt with modeling glacier runoff per se. Even fewer report their evaluations of glacier runoff separately from snowmelt, if at all.”

For the three of the six river basins studies and which flow through India, i.e. Indus, Ganges and Brahmaputra the total annual glacier runoff for the period of 1961-1990 was 41 km3,16 km3 and 17 km3 respectively. But in the recent periods of 2001-2010, total glacier runoff was reduced to 36 km3, 15 km3 and 16 km3 respectively for the three basins, see Table 1 for details.

It is clear from the table that while Indus and Brahmaputra basins have similar percentage of  area under glaciers and snowmelt, the reduction in the glacier and snow cover area are more pronounced in Indus basin. Besides, in all the three basins the reduction in glacier area is more pronounced that the snow cover area. However, the contribution of glacier melt and also snow melt to run-off is much higher in Indus basin compared to Brahmaputra basin, showing the greater role of precipitation in Brahmaputra basin. Within the Indus basin even though seasonal snow covers 28% of the total area, much than the 2.6% occupied by glaciers during 1961-90, the contribution of two sources to Mean Annual Flow is almost same. But a question arises, has the contribution of glacier melt to the runoff increased in any of the basins in the recent decade? The answer is surprisingly, no.

Table 1: Recent changes in the glaciers and seasonal snow and their contributions to MAF

Basin Part of basin area(%) covered by Contribution to MAF (%)
Glaciers Seasonal Snow Glacier runoff Seasonal Snowmelt

1961-1990

INDUS

2.6

28 18

19

GANGES

1.2

6 4

2

BRAHMAPUTRA

2.7 27 2

2

2001 -2010

INDUS

1.8 25 15 16
GANGES

0.9

6 3

1

BRAHMAPUTRA

2.2 26 2

2

For the Ganges basin, the report says that heavy summer precipitation almost solely determines MAF volume for the basin. Maximum seasonal snow area in the Ganges basin makes just 6% of the entire basin area. Similar situation were reported for the Brahmaputra basin, where the lower parts of the basin i.e.  Southeastern Tibet and Eastern Himalayas where nearly 75% of the basin’s glaciers are located, witness heavy summer monsoon rains. Regarding Indus basin the report says, “Precipitation in the IndusBasin is more evenly distributed between the seasons, but is highly variable spatially – similar to Brahmaputra and Amu Darya, where annual precipitation in some catchments is tenfold (3,000 mm) of that in the other glacier-covered parts of the basin (300 mm).”

Reviewing already published documents the report states “it appears that the research in High Asia is concerned much more with CC impacts than with objects of the impact. Yet, understanding of the expected basin-scale changes in glacier runoff in response to climate change remains largely unclear.”

The report does an analysis of assessments done on impact of climate change on water availability in Himalayas and concludes that many assessments rely on poorly verified sources. The report refers to the statement made by Cruz et al. (2007) “The current trends of glacier-melts suggest that the Ganga, Indus, Brahmaputra and other rivers that criss-cross the northern Indian plain could likely become seasonal rivers in the near future as a consequence of climate change…,” This statement was admitted as a typing error after publication but even then this has been reiterated as an apocalyptic vision in NGO reports.

Using the Table 2 given below, the report states that glacier contribution is a minor item in the annual river water budgets in the Ganges and Brahmaputra basins. The report says “The impact of climate change was found to be more prominent on seasonal rather than annual water availability.” It is clear from the table that, in the recent decades non-renewable component in all three basins have gone up while renewable and total volume of water from glacier melt have come down. It is also noteworthy that, even though Brahmaputra basin has more area under glacier cover than the Ganges basin (see Table 1), the volume of water from non renewable glacier flow was more in both periods in the Ganges basin. Besides, the percentage of increase in nonrenewable glacier runoff components during 2001-10 is highest among all three basins, signifying that glaciers are melting fastest in Ganga basin.

Table 2: Contribution of renewable and non-renewable components to glacial runoff

Basin Glacier runoff components Total Glacier runoff (km3) Total Glacier runoff contribution to MAF (%)
Renewable (km3) Nonrenewable (km3)

1961-1990

INDUS

33.0

8.14 41.2

18

GANGES

11.0

4.74 15.7

4

BRAHMAPUTRA

12.7

4.29 17.0

2

2001 -2010

INDUS

24.5

11.62 36.1

15

GANGES

8.1

6.95 15.0

3

BRAHMAPUTRA

10.6

5.05 15.7

2

The reports also states, “Glaciers and seasonal snow in CC-impact assessments should be perceived as natural water reservoirs with gradually diminishing storage and flow regulation capacity, both on intra-annual and inter-annual scale. Potential changes of precipitation regime coupled with effects of temperature rise on evapo-transpiration will impact future hydrological regimes of the major rivers much more significantly, affecting both MAF and flow seasonality.”

The authors of this report clear some fog around climate change and Himalayan glacier system and snow-melt. One lacuna of the report is that even though the report discusses glacier run-off it makes no mentions of glacier lakes and glacier lakes induced floods. There are several incidents of glacier lake induced floods happening in the basins discussed. There is evidence to show that in the recent flood devastation in Uttarakhand in India glacial lakes played significant role.

Parag Jyoti Saikia

with inputs from Himanshu Thakkar

South Asia Network on Dams, Rivers and People (www.sandrp.in)