The Advisory Committee in the Union Ministry of Water Resources (MoWR) for consideration of techno-economic viability of Irrigation, Flood Control and Multi Purpose Project Proposals (TAC in short) is a very important committee. It accords the financial clearance for any irrigation, flood control and multipurpose project. TAC is supposed to discuss the techno-economic viability of projects as per the resolution published in the Union of India Gazette Notification No. 12/5/86-P-II dated Nov 27, 1987. This committee came into being replacing a similar committee that existed earlier in the planning commission. Even now, the guidelines for functioning of the committee are issued by the Planning Commission.
The Gazette notification cited above also said, “The committee may also invite representatives of any other Government organizations, scientific body of experts in the relevant fields to participate in its deliberations.” This seems like a window to appoint credible, independent, non-government persons in the committee, but this window does not seem to have been used. Among the functions of the committee listed in this notification include, “The functions of the Committee will be to examine projects proposed by State Governments, Central Government or other organizations and satisfy itself that the schemes have been prepared after adequate investigations” and “the need of environment conservation and proper rehabilitation of project-affected persons have been taken into account.” However, our perusal of the functioning of the TAC shows that TAC has failed to fulfill both these mandates.
As noted in the Guidelines for Submission, Appraisal and Clearance of Irrigation and Multipurpose Projects, 2010 available on the CWC website (see: http://www.cwc.nic.in/main/webpages/publications.html), “The project proposal, thereafter, is put up to the Advisory Committee for clearance, which is, by and large, like single window clearance.” The importance of such a single window clearance becomes all the more important. The guidelines further note, “On the basis of examination conducted by the Advisory Committee, decision on techno-economic viability of the projects is taken in the meeting of this Committee. The projects found acceptable by the Advisory Committee shall be recommended for investment clearance by the Planning Commission and inclusion in the Five Year Plan/Annual Plan.” This shows how important is the role of the TAC in judging techno-economic viability of projects and also from the point of view of prudent planning.
No Transparency, independent participation or accountability of TAC Considering the above, there is strong case for clearly defined norms for transparency, participation and accountability in (1) functioning of TAC; (2) The screening process of the projects at initial stages that also happen under these guidelines in the Central Water Commission, based on which approval for DPR preparation is given.
In view of the significance of TAC, this is SANDRP’s third analysis of the decisions taken in TAC meetings. The present analysis covers decisions taken for North East India from 110th to 122nd TAC meeting. In the two previous analysis done by SANDRP, TAC meeting decisions taken from 95th meeting to 109th meeting has been covered. Here it is important to note that lack of transparency has been observed right from the agenda and minutes of the TAC meetings. The agenda and minutes of the TAC meetings should be uploaded on CWC website but CWC website has minutes only till the 115th meeting held on 24th July 2012 and the website has been last updated on 31/08/2012.
In this analysis we have covered 13 TAC meetings held from July 2011 to December 2013. In these 13 meeting, 21 projects from 6 northeastern states have been considered. But out of the 13 meetings held, projects from northeast were considered only in 10 meetings. TAC has accepted the proposals for projects with a total cost of rupees 4075.46 crore. Majority of the projects were given clearance at the first time of consideration. Thus, on an average TAC had cleared projects worth of 407.55 crores from the North East in each of these 10 meetings. Number of the projects considered by TAC in each meeting along with their total cost is given below. A state-wise and a project-wise list is also provided.
Total Cost of Projects Cleared by TAC July 2012 to December 2013
| Sl No | Meeting no | Date of meeting | No of projects considered from NE | No projects approved | No of projects deferred | No of projects rejected | Total cost of the accepted projects, Rs Crore |
| 1 | 110th | 20-07-11 | 5 | 4 | 1 | 0 | 211.56 |
| 2 | 111th | 17-08-11 | 1 | 1 | 0 | 0 | 167.09 |
| 3 | 112th | 14-09-11 | 1 | 1 | 0 | 0 | 48.55 |
| 4 | 115th | 24-07-12 | 5 | 5 | 0 | 0 | 2208.81 |
| 5 | 117th | 21-03-13 | 1 | 1 | 0 | 0 | 155.87 |
| 6 | 118th | 30-07-13 | 2 | 2 | 0 | 0 | 467.38 |
| 7 | 119th | 29-08-13 | 2 | 2 | 0 | 0 | 601.67 |
| 8 | 120th | 13-09-13 | 1 | 1 | 0 | 0 | 42.96 |
| 9 | 121st | 08-10-13 | 2 | 2 | 0 | 0 | 146.01 |
| 10 | 122nd | 20-12-13 | 1 | 1 | 0 | 0 | 25.56 |
| Total | 20 | 4075.46 |
State-wise list of projects cleared by TAC
| Sl. No | State | No of projects approved | Total cost of the approved projects, Rs Crore |
| 1 | Arunachal | 1 | 36.47 |
| 2 | Assam | 7 | 1526.85 |
| 3 | Manipur | 7 | 2268.99 |
| 4 | Meghalaya | 1 | 5.63 |
| 5 | Sikkim | 1 | 48.55 |
| 6 | Tripura | 3 | 188.97 |
Note: No projects from Mizoram and Nagaland have come to TAC in this 30 month period.
Some observations regarding TAC meetings
1. Zero Rejections The TAC did not reject a single project. There was only one project which was deferred in the 110th meeting but it was approved in the next meeting. Rest of the new projects were were approved in the very first meeting of their consideration.
2. Lack of information The TAC minutes provide little information about projects. Specially in case of newer projects, detailed discussions should have happened. The minutes of TAC meetings do not give much of an idea about size, location, benefits of a particular project. In the project- wise list provided towards the end of this analysis, we have provided limited information available in the minutes. Some of the noteworthy missing information is listed below:
– In the 115th meeting, 5 projects from Manipur were considered. Out of these five projects, 2 were multipurpose projects and 3 were barrage projects. Surprisingly, there was no information about where these projects are located, on which river, what the size of these projects. None of the minutes mentioned about whom these projects will actually benefit. Only two projects mentioned about increase in annually irrigated land but no more detail was provided.
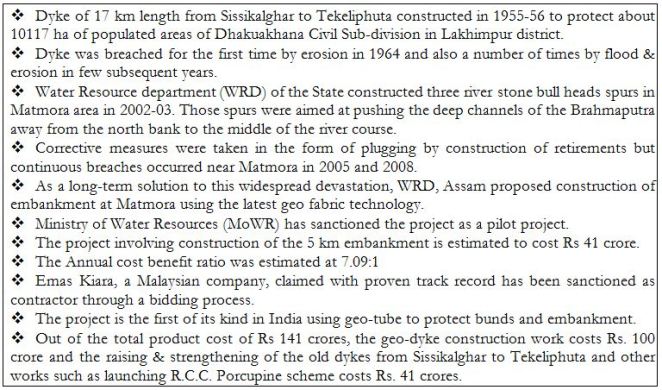
– In the 118th meeting, construction of embankments on both banks of river Ranganadi for flood management and river training was considered. But the cost of the project was on the higher side compared to the embankment construction work to be done on the river Dikrong, considered in the same meeting. This cost escalation may be due to the difference in the length of the projects. But this cannot be confirmed since minutes do not mention the length of the proposed embankments.

But the increased costs may also be due to the use of Geo bag technology for construction of Ranganadi embankments. Use of Geo-bag technology is a costly affair but nothing has been mentioned about the use of this technology in the minutes of 118th meeting. This is stated in the annexure (Annex VI as mentioned in the document) of the meeting. Interestingly this annexure too has been mentioned only as a corrigendum.
3. No Detailed Discussion on Projects Considered This was very evident in the two previous analysis done by SANDRP and situation remains the same this time as well. In case of all the projects, including the ones considered for the first time, there was no detailed information or any detailed discussion. There is no discussion on technical viability of the project. Reading through the minutes gives an impression that approval for any project considered by TAC is fait accompli. There is no discussion about whether the project is a desirable project, if there are other options available, if this is the best option and so on. Under the mandate given to it, TAC is supposed to discuss all these issues. TAC accepted projects proposals with huge cost and time overruns but little enquiry has been made why such escalation happened.
Dhansiri irrigation project This is a glaring example of cost escalation. The project was discussed in the 119th meeting on 29.08.2013 for consideration of cost of Rs 567.05 crores. But, it was surprising to find that original cost of the project in 1975 was Rs 15.83 crores as according to the information available in Assam State Irrigation Department website.[1] The same website states that project started in 1975 and supposed to be completed 35 years later in 2010. In the TAC meeting a new time schedule of March 2015 was stated. The cost of the project has increased by 35.82 times over a period of 40 years but the advisory committee accepts proposal without much scrutiny or enquiry. There was no detailed assessment of the reasons for time and cost over runs (there is no question of delay due to clearances or agitations here) or whether this project which will take 40 years just to complete will be viable or not. On the contrary, the planning commission representatives said, “the benefit cost ratio of the project was 1.2 and any further escalation in cost would result in the project becoming techno-economic unviable.”
The TAC should have done a detailed assessment why the project took so long time to complete. But it seemed to be contended with the rational that the project authorities provided which was that due land acquisition and law and order problem the project has not been completed. But in the meantime minutes of the meeting also showed that that major components of the project are in advanced stages of construction with 93% of barrage work, 99% of the canal works and about 83% of works in the distribution system were reported to have been completed. There has been no detailed assessment in to any of these aspects.
Imphal Barrage project In this project, the cost of the project mentioned in the minutes of the 115th meeting contradicted with the cost provided in the annexure. The cost of Extension, Renovation and Modernization (ERM) of the Imphal barrage project as mentioned in the minutes is Rs 16.80 crores. But a letter from the Under Secretary, Govt. of Manipur to the Chief Engineer of Irrigation and Flood Control Department, Manipur dated 21.07.2012 stated the cost of the project as 23.41 crores. This reflects the lack of serious discussion over projects in TAC. It is also surprising that TAC, being the committee which gives the techno economic clearance to projects, does not have clarity about even the cost of the project.
4. No Discussion over Social, Environmental and Other impacts of the Projects The projects cleared by TAC have serious social, environmental and other impacts but the committee never discussed these impacts. TAC does not at all take into account the impacts a project would have on the environment.
In the 118th meeting (30.07.2013), while considering the proposal for flood management of Dikrong along with river training works on both banks, the minutes stated “Effectiveness of existing embankments of river Dikrong has been deteriorating due to lack of repair, siltation of river bed and consequential change in river behaviour, change in flow pattern due to release of Ranga Nadi hydel project etc.” But this is one of the rare instances when TAC mentioned about the environmental impacts on embankments. But rather than asking for more details on these impacts or to see whether embankment would really be a viable option or not, the TAC accepted the proposal. On the other hand nowhere the committee discussed what impacts an embankment has on river bed, siltation or downstream stretches of a river.
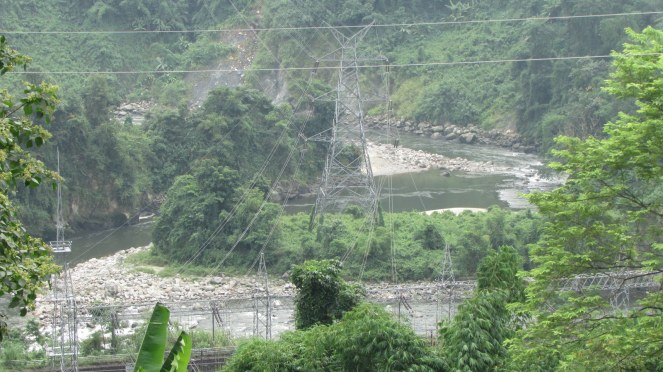
It is also important to note here TAC also does not take into consideration impacts of the hydropower projects on the embankments in the downstream of the river. In the above mentioned case, the increased costs of Dikrong embankment should have been charged on the Ranga Nadi HEP, but there is no discussion on this. The Pare hydropower project (110 MW) in Papumpare district of Arunachal Pradesh is currently under construction on Dikong / PareRiver. Moreover there are at least 10 hydropower projects at various stages in the combined Ranganadi-Dikrong basin in Arunachal Pradesh, including one operating, three TOR approvals given and five additional MoA signed (in addition to a proposed project). There is no provision to assess the impacts of these projects on the embankments downstream of DikrongRiver in Assam. In fact there is no provision for any impact assessment study for embankments even though studies show the disastrous impacts of embankments on environment, floods and on the lives of the people living close to the river.
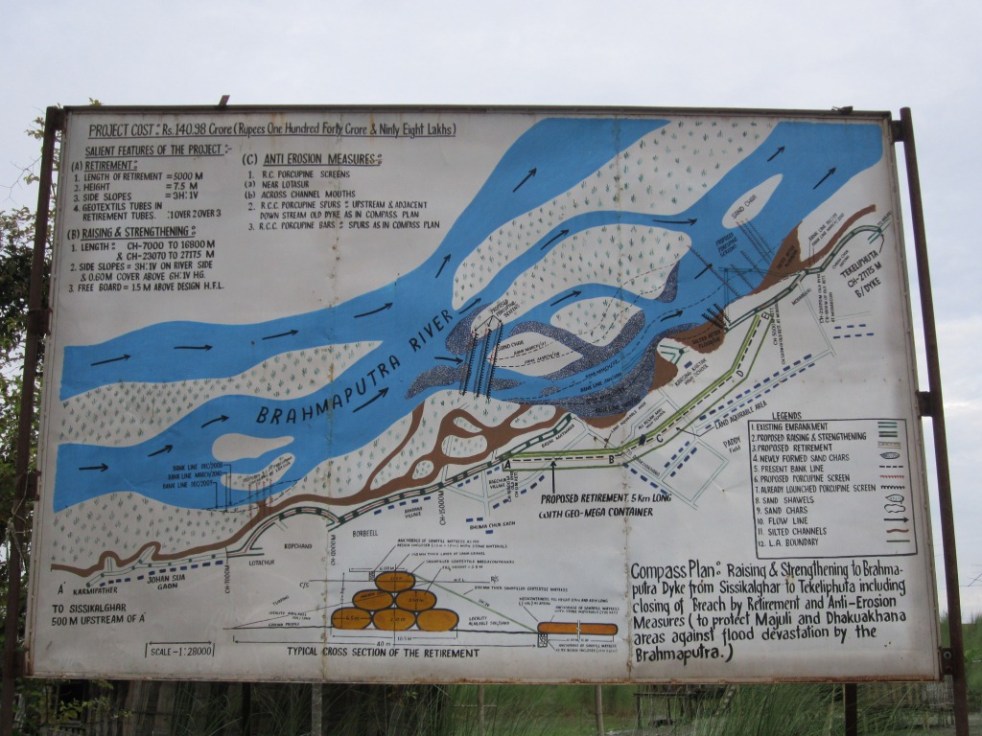
5. Clearing Same Embankment Projects over Years In terms of embankments, it is observed that the TAC had cleared same projects over the years. Not emphasizing on the environmental impacts of embankment projects is one of the major reasons for this. In the 117th TAC meeting held on 21.03.2013 the proposal for “Protection of Brahmaputra dyke from Sissikalghar to Tekeliphuta at different reaches from Lotasur to Tekeliphuta from the erosion of river Brahmaputra Assam” was considered. The estimated cost of the project was Rs 155.87 crore. But on the same embankment, a project titled “Raising and Strengthening to Brahmaputra dyke from Sissikalghar to Tekeliphuta including closing of breach by retirement and anti-erosion measures (to protect Majuli and Dhakukhana areas against flood devastation by the Brahmaputra, Lakhimpur district, Assam) was accepted in the 95th TAC meeting held on 20.01.2009. The estimated cost of the earlier project was 142.42 crore.

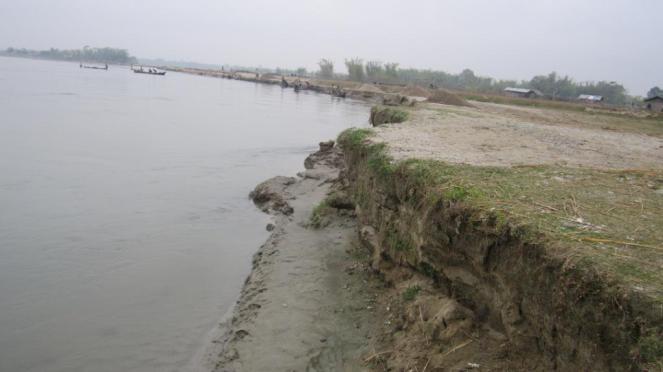
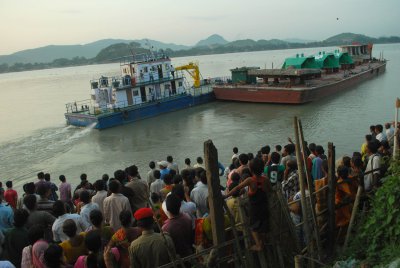
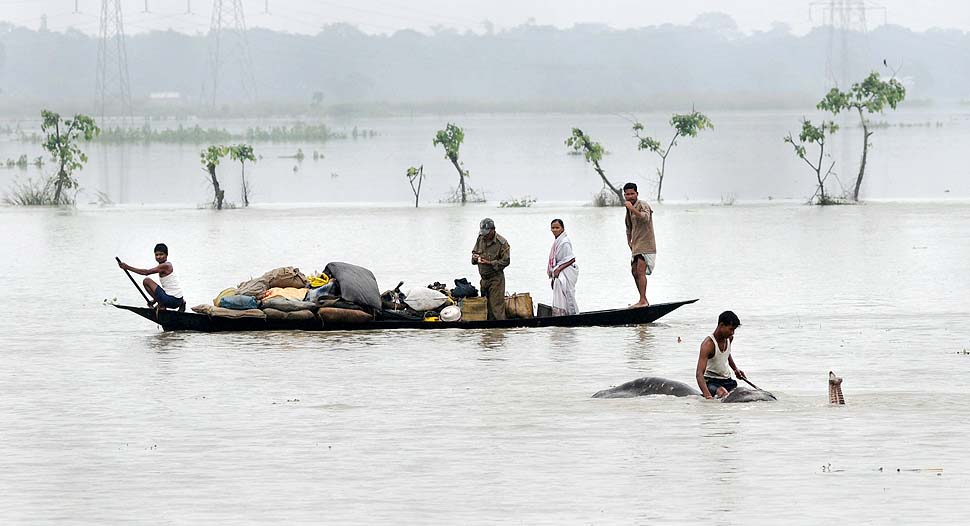
Photo: Parag Jyoti Saikia
The minutes of the 117th meeting, about the previous scheme said that it “was taken up primarily for closure of breach in the then existing embankment including raising of embankment around the breach area only.” But the minutes of the 95th TAC meeting had said something totally different about the project. The minutes stated that project proposal envisaged – (i) Raising and strengthening of embankment for a length of 13.9 km, (ii) Construction of retirement bund with geo-textile tubes of length 5000 m. This shows how the discussion on the Brahmaputra dyke Sissikalghar to Tekeliphuta is 117th meeting is completely misleading. TAC does on even take into account its previous meeting discussions before clearing a project. This possibly gives a hint of a scam.
The Brahmaputra dyke from Sissikalghar to Tekeliphuta has a long history of facing severe erosions. The first geo-tube embankment was constructed on this dyke in Dec 2010. Crores have been spent for the protection of this embankment. But even after that the Dhakukhana sub-division always remained in the headlines during the flood season in Assam. There is need for area specific detailed study assessing the impact on and of the embankment, but little has been done in this regard. Besides, the Bogibeel Bridge, the fourth one on the BrahmaputraRiver, is coming up in the upstream of this embankment. Construction of this bridge would make this dyke even more prone to erosion since the length of this bridge will be 4.94 km, shrinking the wide river to great extent. In a personal visit to the area, one of the government officials informed that as a result of this “funneling action”, the force of water will increase and it will directly hit the embankment leading to more erosion. But TAC has never dealt with these issues in its meetings but cleared all the proposals that it considered.
Short History Brahmaputra Dyke from Sissikalghae to Tekeliphuta[2]
Parag Jyoti Saikia (meandering1800@gmail.com)
Project-wise Detailed List of TAC decisions
110th meeting (20.07.2011): Accepted: TOTAL: Rs 211.56 crores
| Sl No | Project | Dist/State | Appr. year | basin | original cost (Rs. Cr) | decision |
| 1 | Anti Erosion & Flood protection work | Arunachal Pradesh | New | Tawangchu | 36.47 | Accepted |
| 2 | Protection of Majuli from Flood and Erosion Phase II & III | Assam | 2011 | Brahmaputra | 115.03 | Accepted |
| 3 | Restoration fo rivers Dibang and Lohit to their original courses at Dholla Hatighuli | Assam | 2011 | Brahmaputra | 54.43 | Accepted |
| 4 | Protection of Balat village from flood and erosion of river Umngi in West Khasi hill district | West Khasi hill/Meghalaya | New | Brahmaputra | 5.63 | Accepted |
111th meeting (17.08.2011): Accepted: TOTAL: Rs 167.09 crores
| Sl No | Project | Dist/State | Appr. year | basin | original cost (Rs. Cr) | decision |
| 1 | Protection of Biswanath Panpur including areas of upstream Silamari and Far downstream Bhumuraguri to Borgaon against erosion of the river Brahmaputra | Sonitpur/Assam | New | Brahmaputra | 167.09 | Accepted |
112th meeting (14.09.2011): Accepted: TOTAL: Rs 48.55 crores
| Sl No | Project | Dist/ State | Appr. year | original cost (Rs. Cr) | decision |
| 1 | Improvement of Strom Water Drainage below GreenfieldAirport at Pakyong | Sikkim | New | 48.55 | Accepted |
115th meeting (24.07.2012): Accepted: TOTAL: Rs 2208.81 crores
| Sl No | Project | Dist/State | Appr. year | basin | original cost (Rs. Cr) | decision |
| 1 | Thoubal Multipurpose project | Manipur | 1980 | Brahmaputra | 1387.85 | Accepted |
| 2 | Khuga Multipurpose project | Manipur | 1980 | Brahmaputra | 433.91 | Accepted |
| 3 | Dolathabi Barrage Project | Manipur | 1992 | Brahmaputra | 360.05 | Accepted |
| 4 | ERM of Imphal Barrage Project | Manipur | New | Brahmaputra | 16.8 | Accepted |
| 5 | ERM of Sekmai Barrage Project | Manipur | New | Brahmaputra | 10.2 | Accepted |
117th meeting (21.03.2013): Accepted: TOTAL: Rs 623.25 crores
| Sl No | Project | Dist/ State | Appr. year | basin | Ht / L of Dam/Embnk. | original cost (Rs. Cr) | Benefit flood prot. (Ha) | decision |
| 1 | Protecion of Sissi-Tekeliphuta dyke from erosion – Lotasur to Tekeliphuta | Assam | New | Brahmaputra | 153 km | 155.87 | 10117 | Accepted |
1188h meeting (30.07.2013): Accepted: TOTAL: Rs 623.25 crores
| Sl No | Project | Dist/ State | Appr. year | River/ basin | original cost (Rs. Cr) | Benefit flood prot. (Ha) | decision |
| 1 | Flood management of Dikrong and river training works on both banks embankment | Lakhimpur/ Assam | New | Dikrong/ Brahmaputra | 105.96 | 9998 | Accepted |
| 2 | Flood management of Ranganadi and river training works on both bank embankments | Lakhimpur/ Assam | New | Ranganadi/ Brahmaputra | 361.42 | 21056 | Accepted |
119th meeting (29.08.2013): Accepted: TOTAL: Rs 601.67 crores
| Sl No | Project | Dist/ State | Appr. year | River/ basin | original cost (Rs. Cr) | annual irrigation | decision |
| 1 | Dhansiri Irrigation project | Assam | 1975 | Dhansiri/ B’putra | 567.05 | Accepted | |
| 2 | ERM of Singda multipurpose project | Manipur | New | Brahmaputra | 34.62 | 3000 | Accepted |
120th meeting (29.08.2013): Accepted: TOTAL: Rs 42.96 crores
| Sl No | Project | Dist/State | River | original cost (Rs. Cr) | decision |
| 1 | Anti erosion work along river Haora from Champakpur to Baldakhal | West Tripura | Haora | 42.96 | Accepted |
121st meeting (08.10.2013): Accepted: TOTAL: Rs 146.01 crores
| Sl No | Project | Dist/ State | River | original cost (Rs. Cr) | Benefit flood prot. (Ha) | decision |
| 1 | Anti erosion work along river Gumti from Dlak Samatal Para to Durgapur under Amarpur, Udaipur & Sonamura subdivision | S & West Tripura | Gumti | 54.99 | 2209 | Accepted |
| 2 | Anti erosion work along river Khowaii from Netajinagar to Banglahour under Telimura subdivision and from south L. N. Pur to Paharmura bridge under Khowai subvision | West Tripura | Khowaii | 91.02 | 4256 | Accepted |
122nd meeting (20.12.2013): Accepted: TOTAL: Rs 25.56 crores
| Sl No | Project | Dist/State | River | original cost (Rs. Cr) | decision |
| 1 | Loktak Lift Irrigation Project | Manipur | 25.56 | Accepted |
[2] From the brochure published by WRD, Assam at the time of commissioning the geo-tube embankment in Matmora


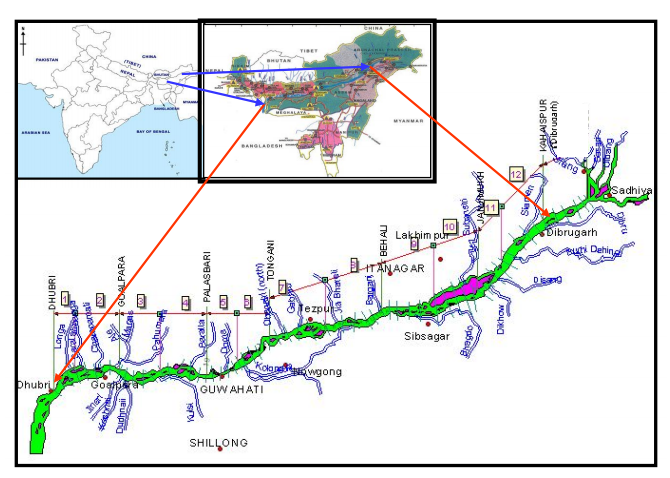
![Three stations on Yarlung Zangbo - Nugesha, Yangcun and Nuxia (the green spots in the map represent these station)[iv]](https://sandrp.in/wp-content/uploads/2013/10/three-stations-on-on-yarlung-zangbo.jpg?w=663)


