
According to India Meteorological Department[i] (IMD), during the Post Monsoon Rainfall for 2025, that included rainfall during the three Oct-Dec 2025 months, India received 134.2 mm rainfall, 11% above normal (117.4 mm, 3% below normal in Post Monsoon 2024, 110.7 mm, 9% below normal in Post Monsoon 2023[ii], 144.1 mm, 19% above normal in Post Monsoon 2022[iii] and 177.7 mm rainfall, 43.54% above normal in Post Monsoon 2021[iv]) rainfall of 121 mm. In the same period in 2020, India received 124.6 mm rainfall, 0.64% above the normal rainfall. In Post Monsoon season of 2019, India received 160 mm rainfall[v] in this season, 29% above normal, when 2019 was not a La Nina year.
This three-month period from Oct 1, to Dec 31 includes the North East Monsoon that mainly affects parts of South India including Tamil Nadu, Puducherry, Rayalseema, parts of Karnataka and Kerala. However, since the South West Monsoon had not yet withdrawn from the country by Sept 30, a significant proportion of the rainfall in October was contribution of the SW monsoon. This was similar situation in Post Monsoon 2019, 2020[vi], 2021, 2022, 2023 and 2024.
The period also includes the rainfall and snowfall that most of North India gets from western disturbances, but that contribution has been relatively low this year. Prevailing conditions of mild La Nina has not been able to make significant contribution in the rainfall. According to IMD this is likely to continue till March end.
Monthly rainfall The distribution of rainfall for the three months of Post Monsoon 2025 season as per IMD is as follows.
| Month | Actual Rainfall, mm | Normal Rainfall, mm | % Departure from Normal |
| Oct 2025 | 112.2 | 75.4 | +48.8 |
| Nov 2025 | 17 | 29.7 | -42.8 |
| Dec 2025 | 4.9 | 15.9 | -68.9 |
| Post Monsoon 2025 | 134.2 | 121 | +10.9 |
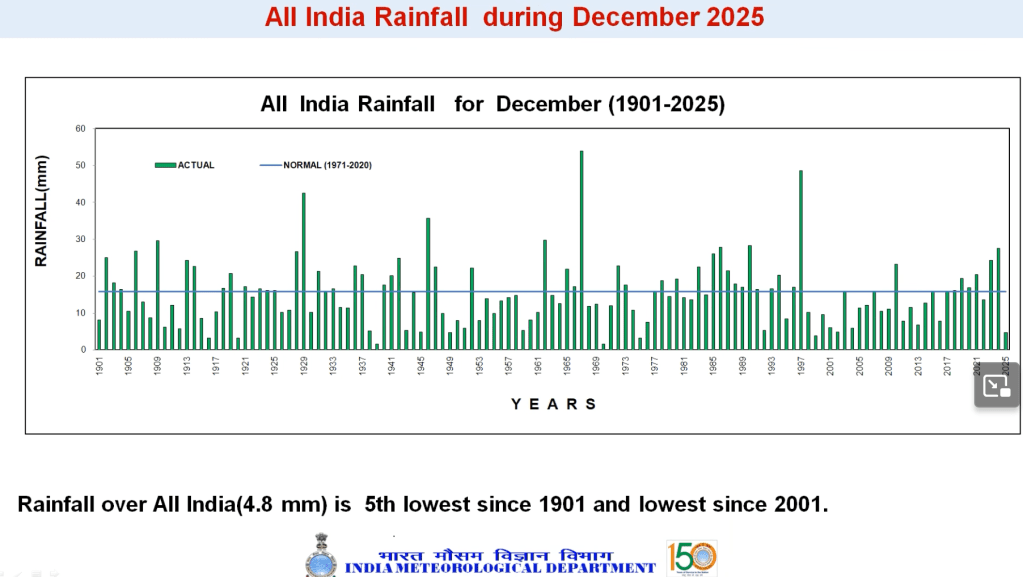
As can be seen from the table, it is the big surplus rainfall of 48.8% in Oct 2025 that is leading to surplus rainfall in Post Monsoon 2025. The deficits in November and December 2025 are huge, but because the relative quantum of actual and normal rainfall in Oct is much greater than those in Nov and Dec, the overall actual rainfall turns out to be on surplus side. In fact, the Dec 2025 rainfall at 4.9 mm at all India level has hugely reduced from 28.1 mm rainfall in Dec 2024. This rainfall of 4.9 mm in Dec 2025 is fifth lowest since 1901 and the lowest since 2001. This is apparent from the following slide from IMD presentation depicting All India rainfall series during December for years 1901-2025.
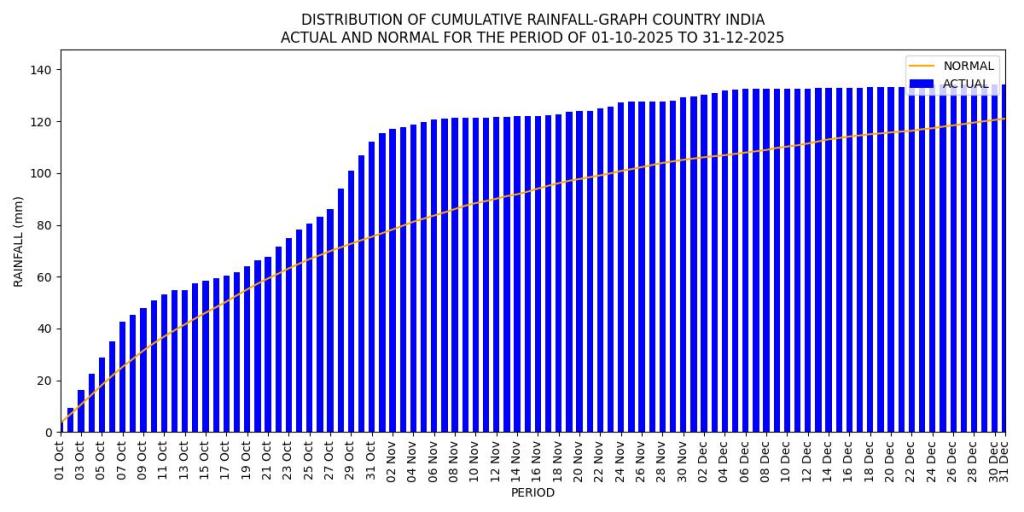
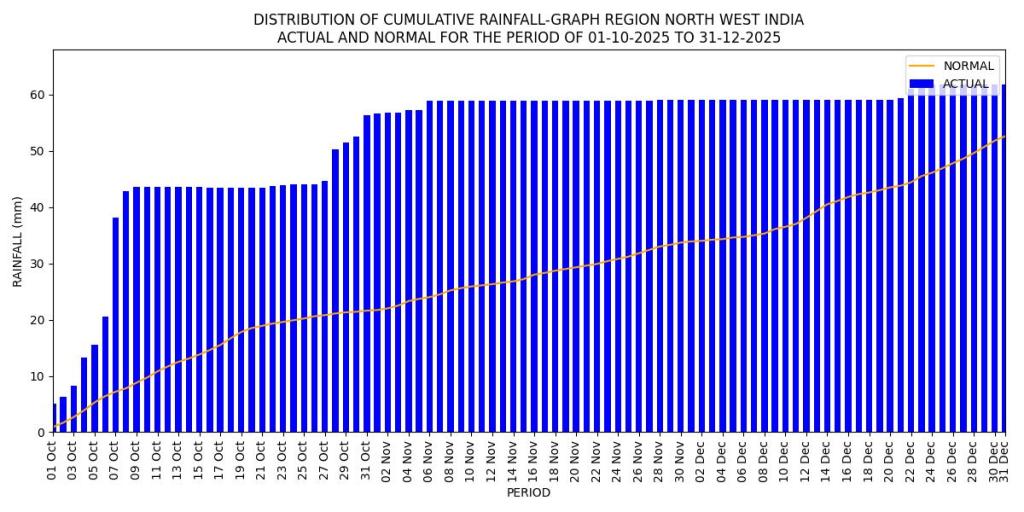
Daily National Rainfall bar chart for Post Monsoon 2025 from IMD is given below.
Region wise monthly rainfall Following table gives month-wise rainfall in Post Monsoon 2025 season for the four regions of India as per IMD’s division.
| Region | Oct 2025 | Nov 2025 | Dec 2025 | Post Monsoon 2025 | ||||
| Actual Rainfall, mm | % Departure from Normal | Actual Rainfall, mm | % Departure from Normal | Actual Rainfall, mm | % Departure from Normal | Actual Rainfall, mm | % Departure from Normal | |
| NW | 56.3 | 160.7 | 2.6 | -78.1 | 2.9 | -84.8 | 61.8 | 17.5 |
| E & NE | 132 | 7.2 | 24.6 | 8.9 | 0.6 | -95.2 | 157.2 | -1.1 |
| Central India | 95 | 66.6 | 6.8 | -51.3 | 0 | -99 | 102.1 | 34.2 |
| South Peninsular India | 212.8 | 42.7 | 50.7 | -43.6 | 20.1 | -37.3 | 283.4 | 3.4 |
It is clear that the November rainfall in three of the four regions and December rainfall in all four regions is hugely below normal. The rainfall still is above normal in three of the four regions because of hugely above normal Oct rainfall. The trend shows that the winter 2026 rainfall is likely to remain hugely below normal.
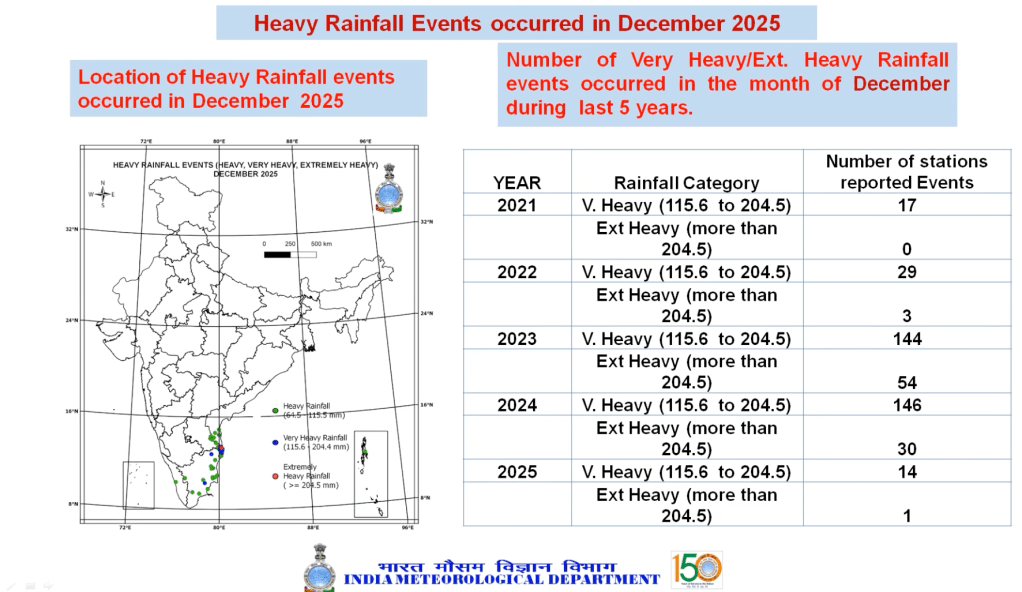
According to IMD, the number of events with rainfall over 115.6 mm in December 2025 were the lowest in last five years, with number of such events being 17 in Dec 2021, 32 in Dec 2022, 198 in Dec 2023, 176 in Dec 2024 and 14 in Dec 2025, see the slide below from IMP presentation.
The bar chart for three of these region depicting daily rainfall during PM 2025 season is given below.

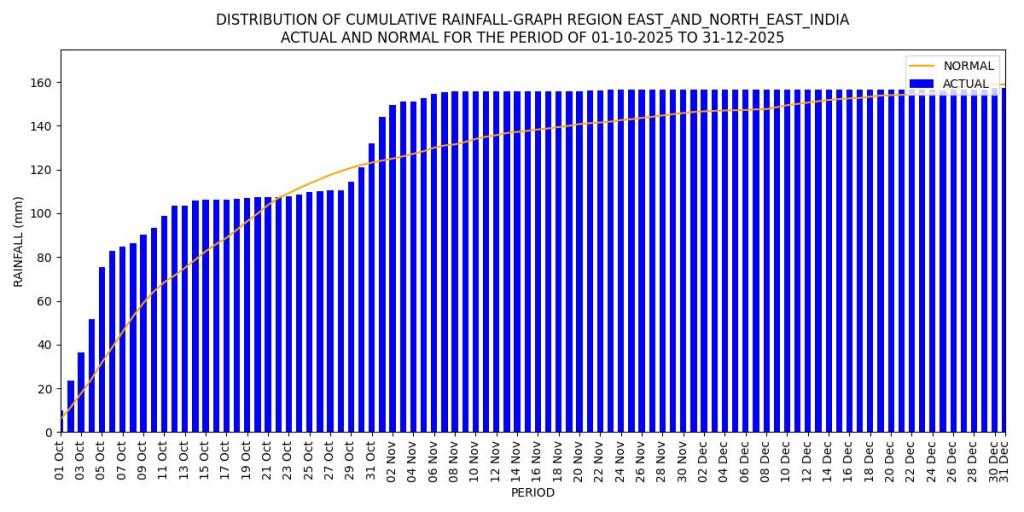
It is clear from the following slide from IMD presentation that rainfall in Dec 2025 was the lowest in Central India since 1901 and in E-NE India it was sixth lowest since 1901 and lowest since 2001.

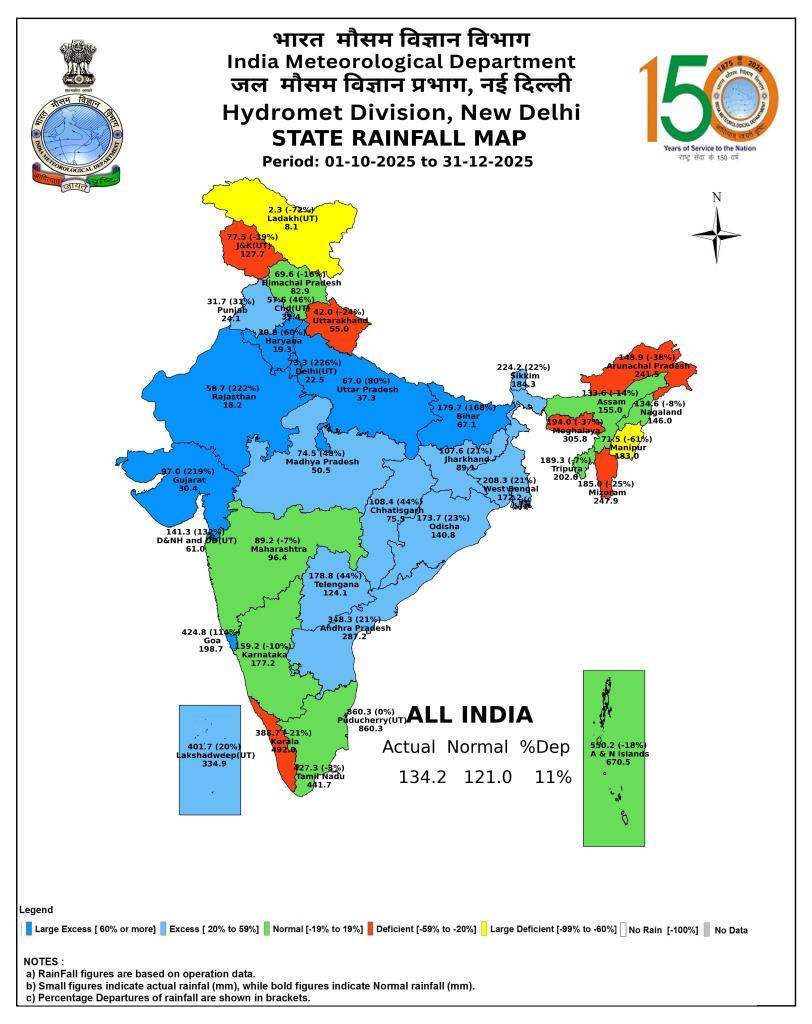
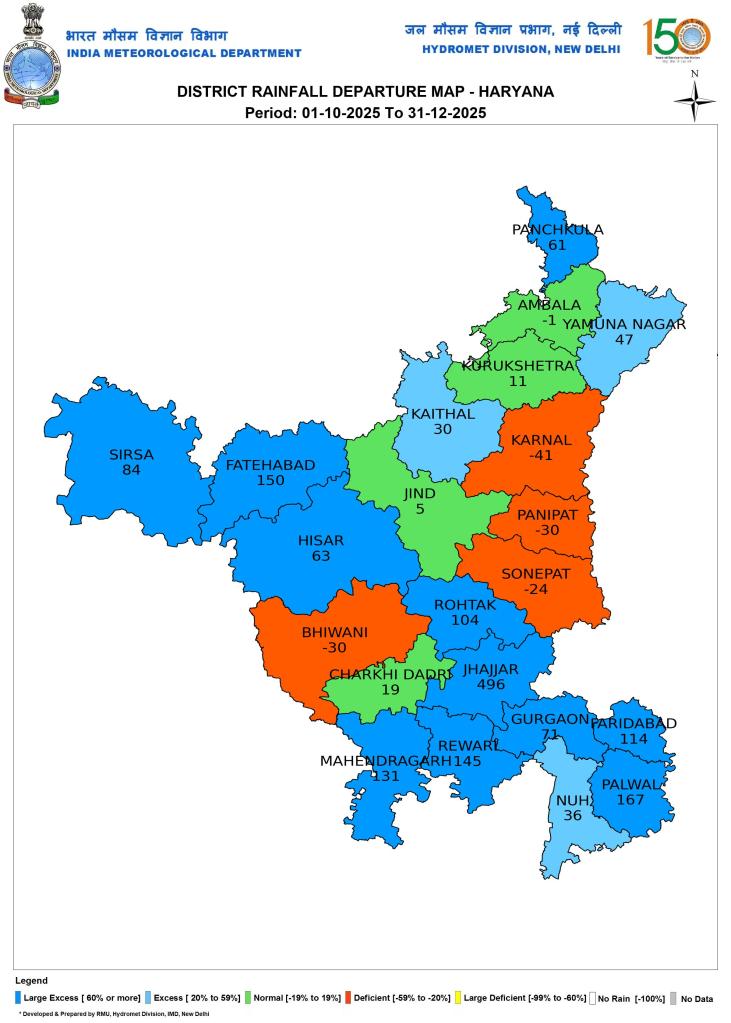
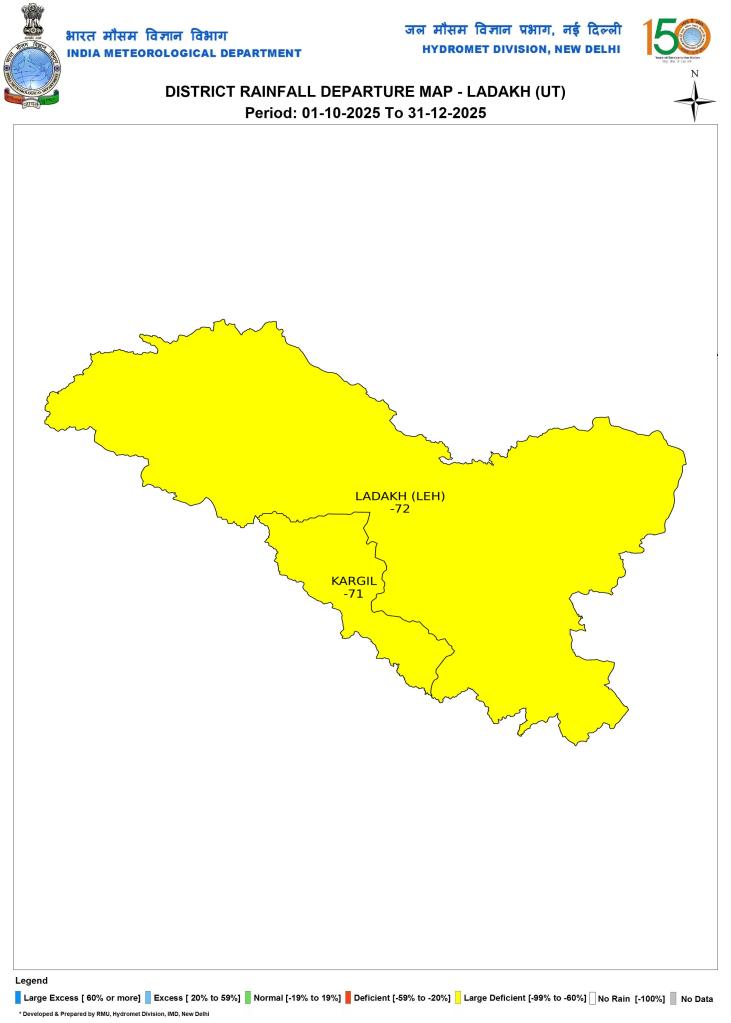
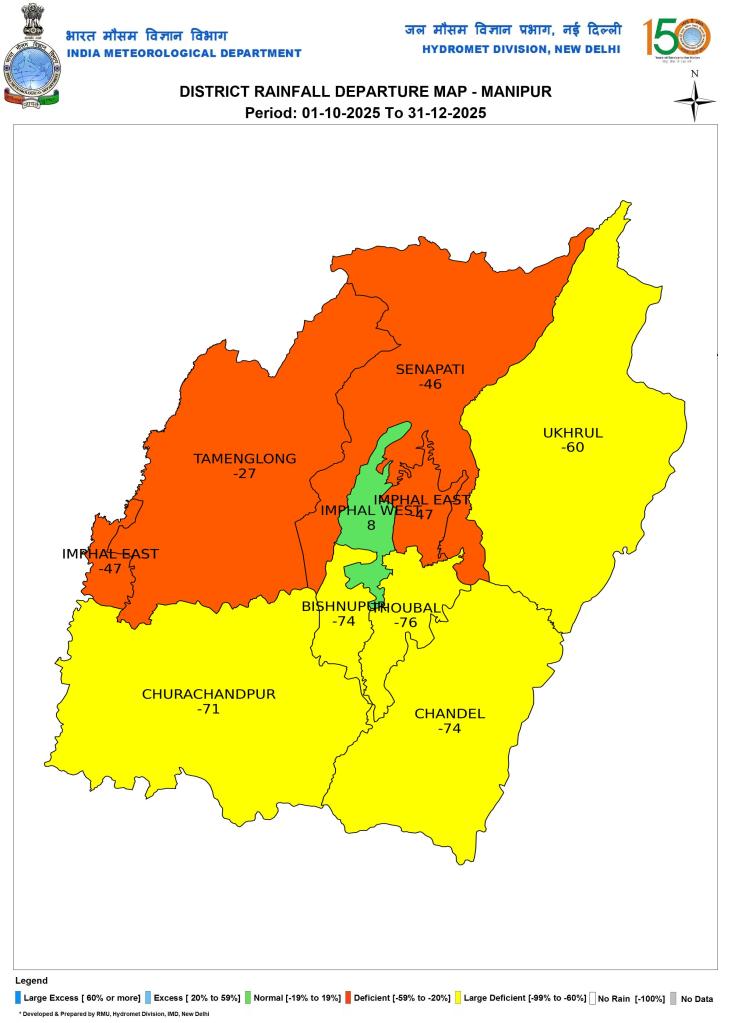
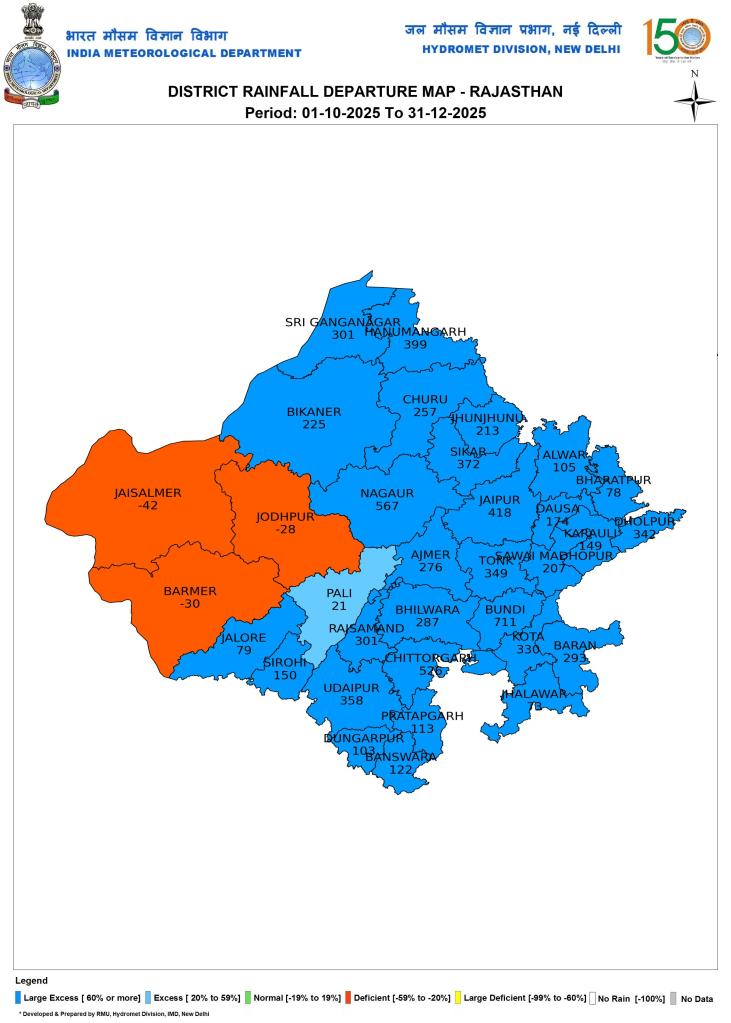
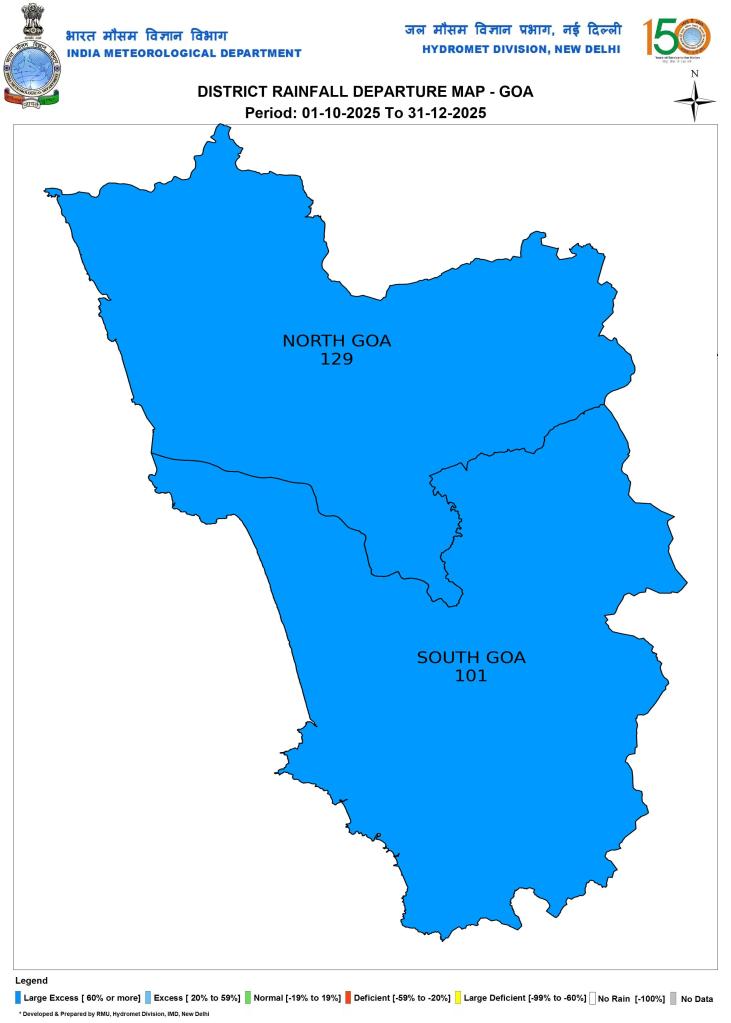
ALL INDIA: State wise rainfall Eight (Goa, Gujarat, Rajasthan, Haryana, Delhi, UP, Bihar, Diu-Daman-Dadar-Nagarhaveli) States and Union Territories (UTs) had Large Excess Rainfall (more than 60% above Long Period Average or LPA), 11 had Excess (20-59% above LPA), 9 had normal (19% below to 19% above normal) and six states and UTs had Deficit Rainfall (20 to 59% below normal) and Two (Ladakh, Manipur) had Large Deficit (deficit over 60% of normal) during Oct Dec 2025 period in India among the 36 states and UTs. Here LPA is Long period average, taken as average of the rainfall during 1971-2020. Ladakh had the highest deficit at 72% and Delhi had the highest surplus at 226%. Pondicherry, like in Post Monsoon 2022-24, had the highest rainfall at 860.3 mm, way above the 2nd highest rainfall in Andaman & Nicobar Islands at 550.2 mm.
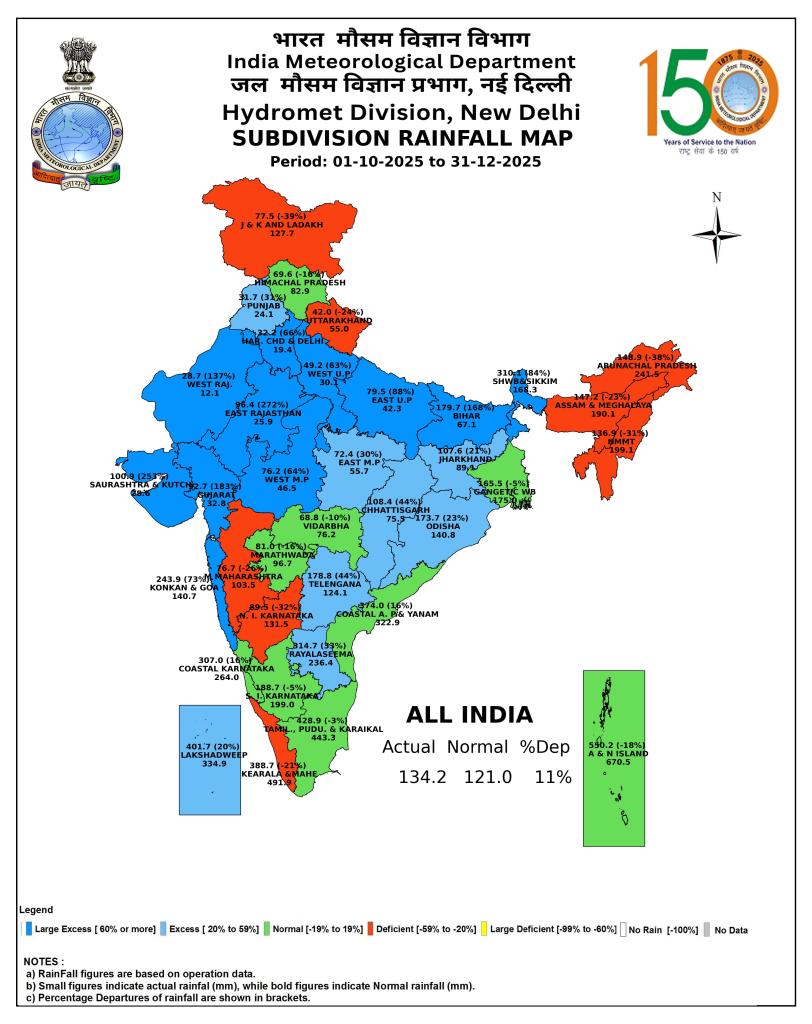
Sub-Division wise rainfall Among IMD’s 36 sub divisions, 11 received Large Excess, 8 received Excess, 9 received Normal, 8 received Deficit rainfall and None had large deficit. Like in 2020-24, Andaman and Nicobar Islands received the highest sub-divisional rainfall at 550.2 mm.
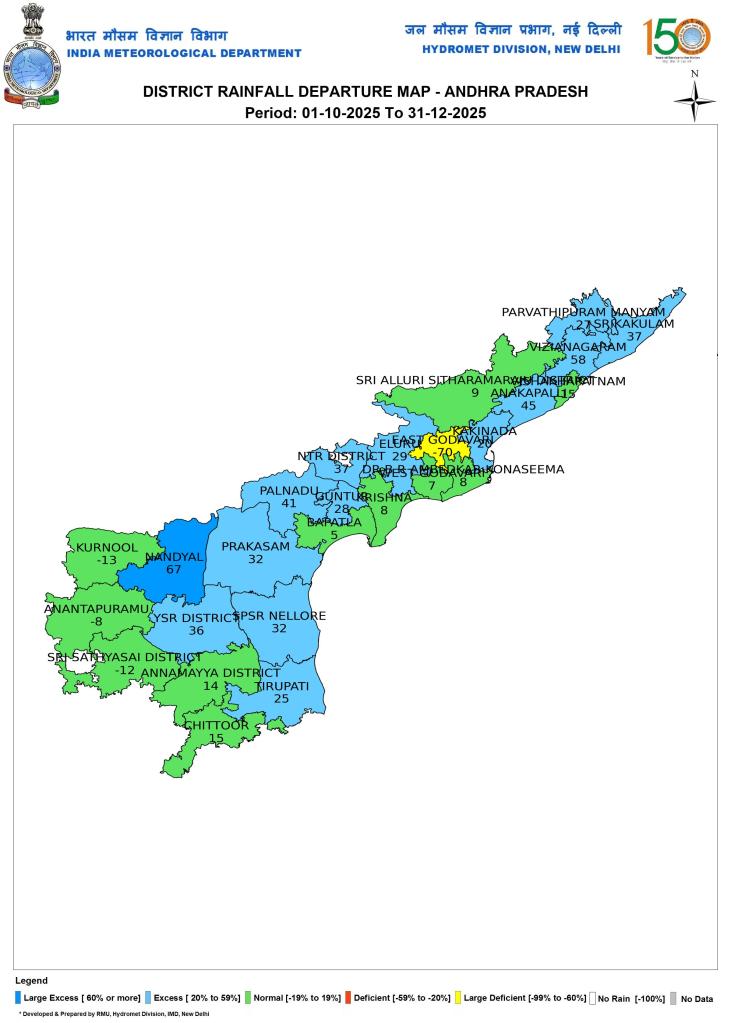
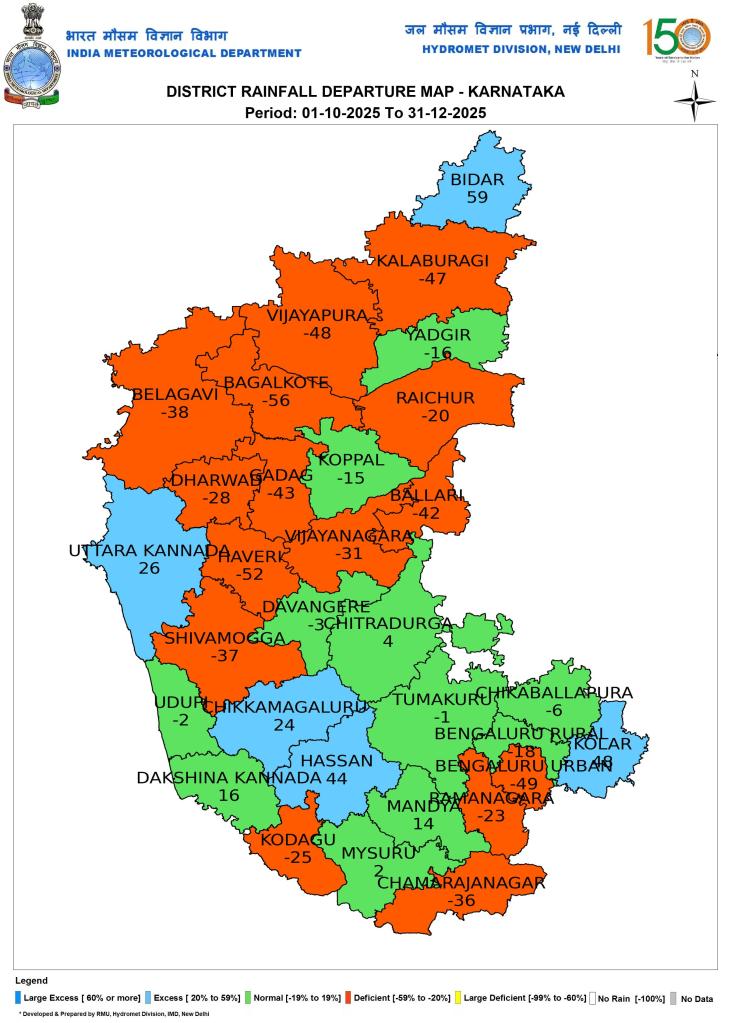
STATE WISE DISTRICT WISE RAINFALL:

NORTH ZONE: Jammu and Kashmir

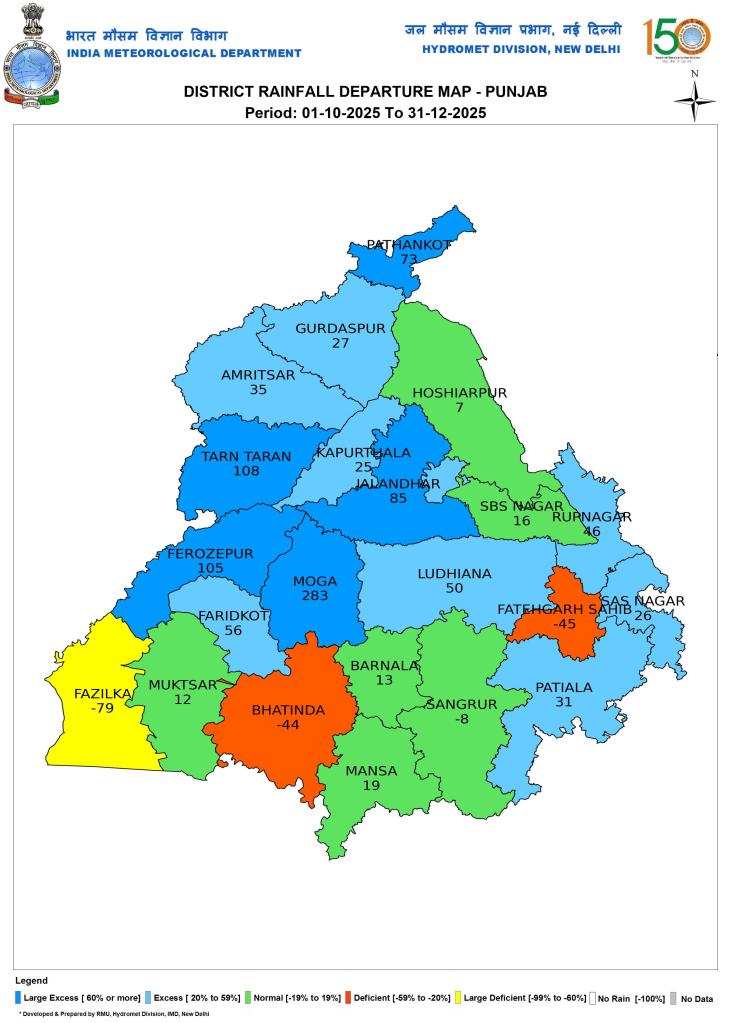
Punjab
Haryana
Delhi

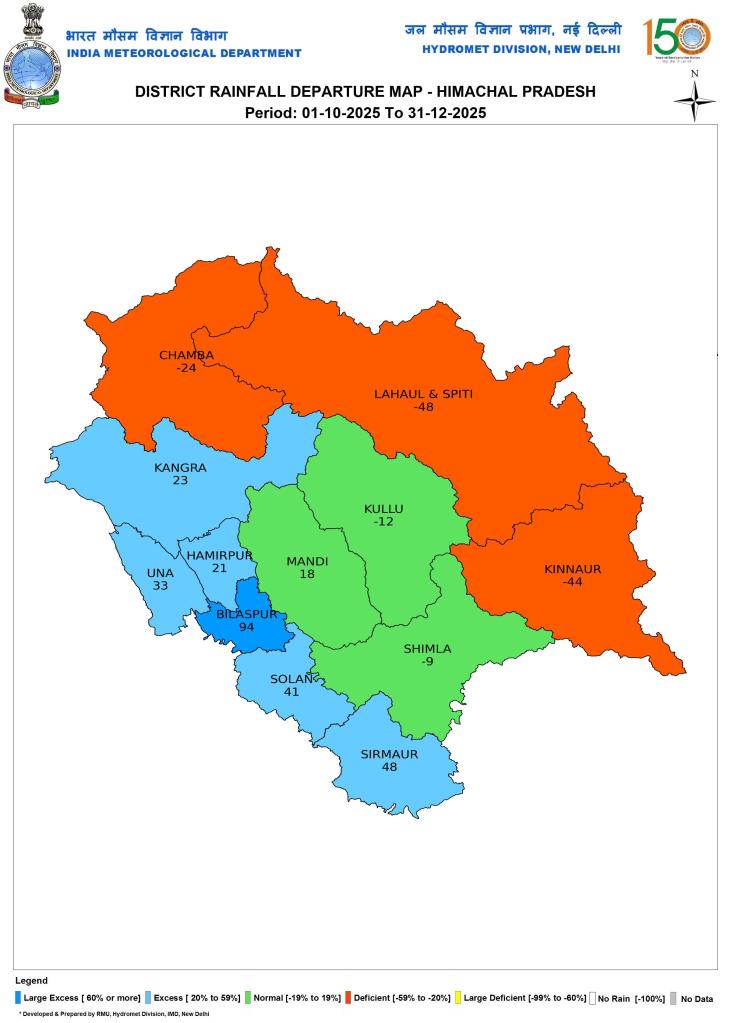
Himachal Pradesh
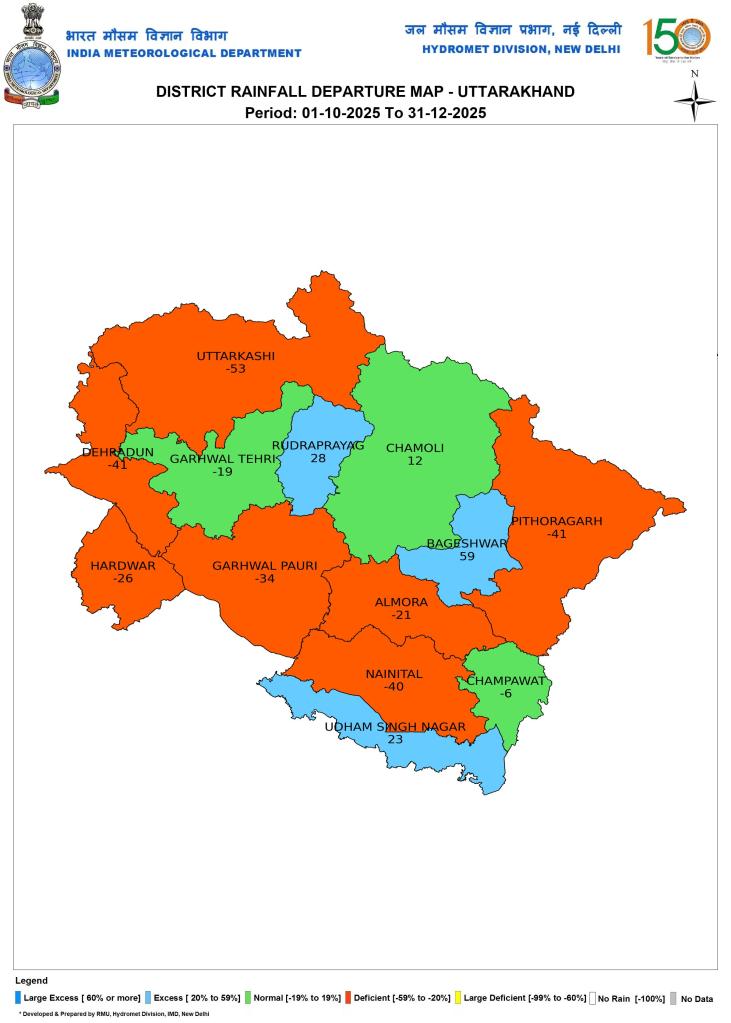
Uttarakhand
Ladakh
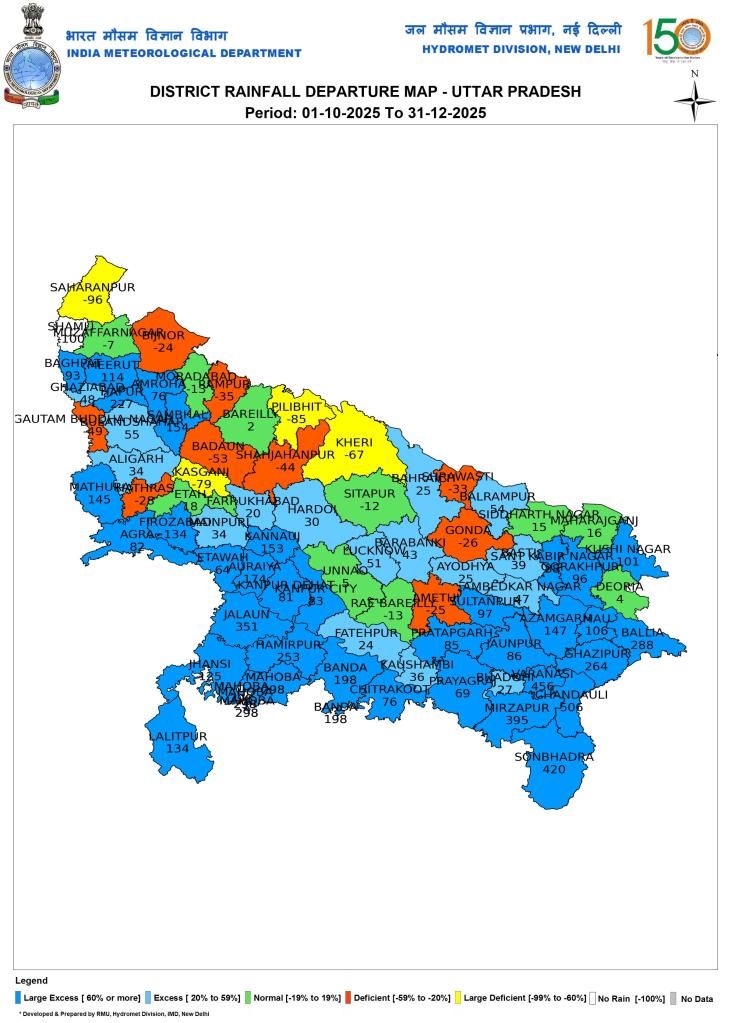
EAST ZONE: Uttar Pradesh
Bihar

Jharkhand

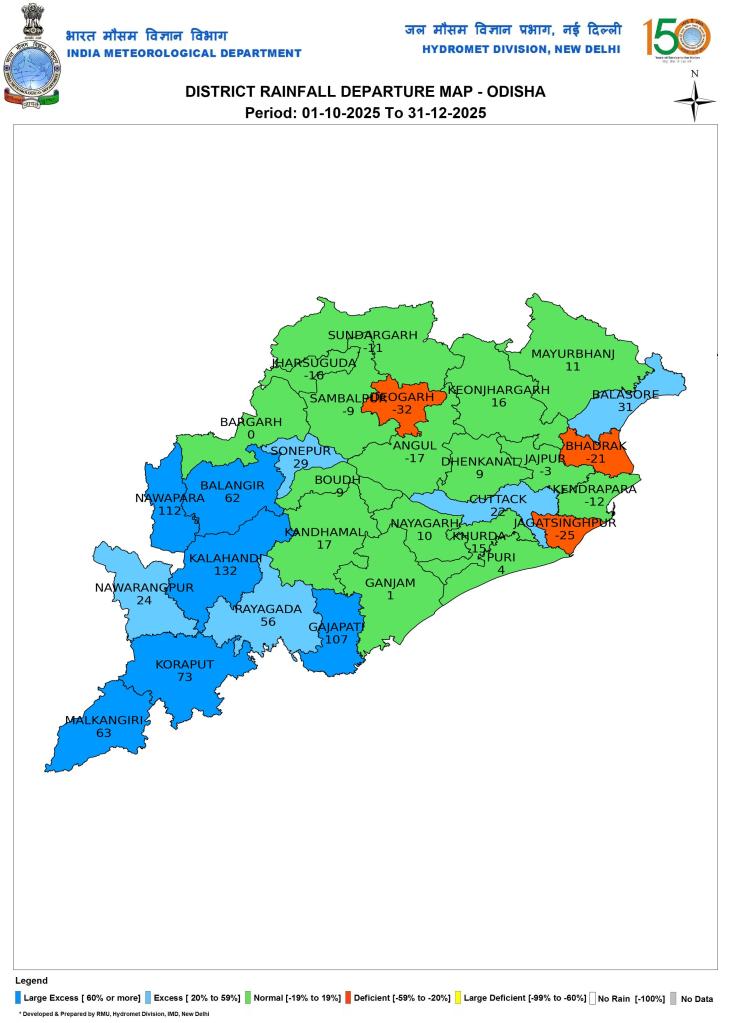
Odisha
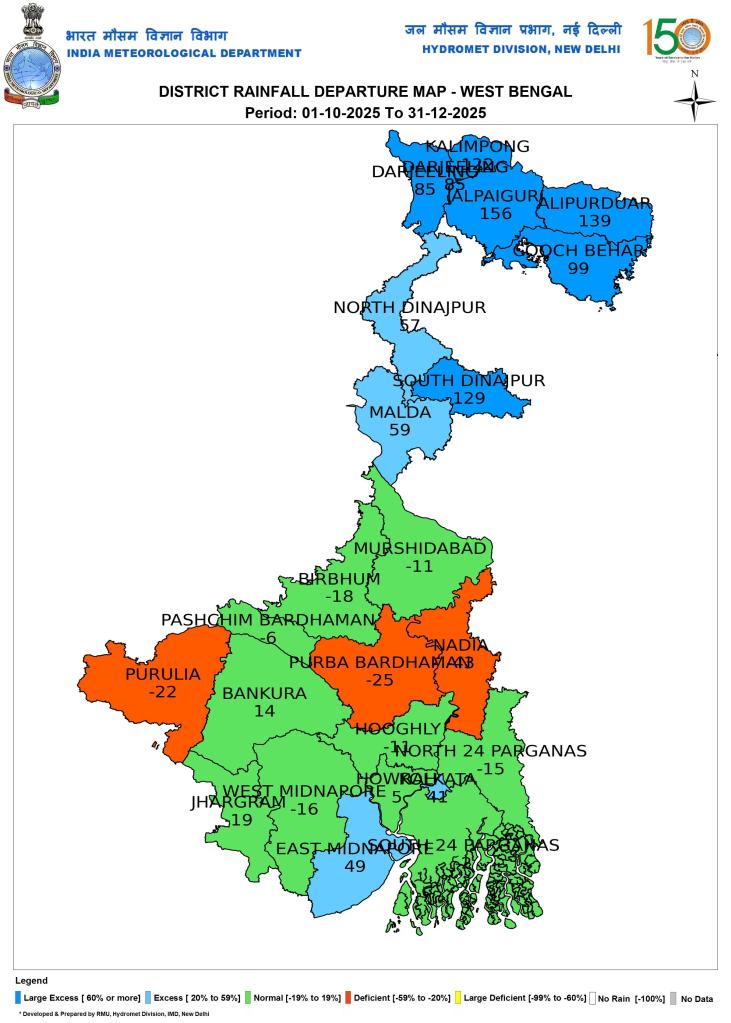
West Bengal
Chhattisgarh

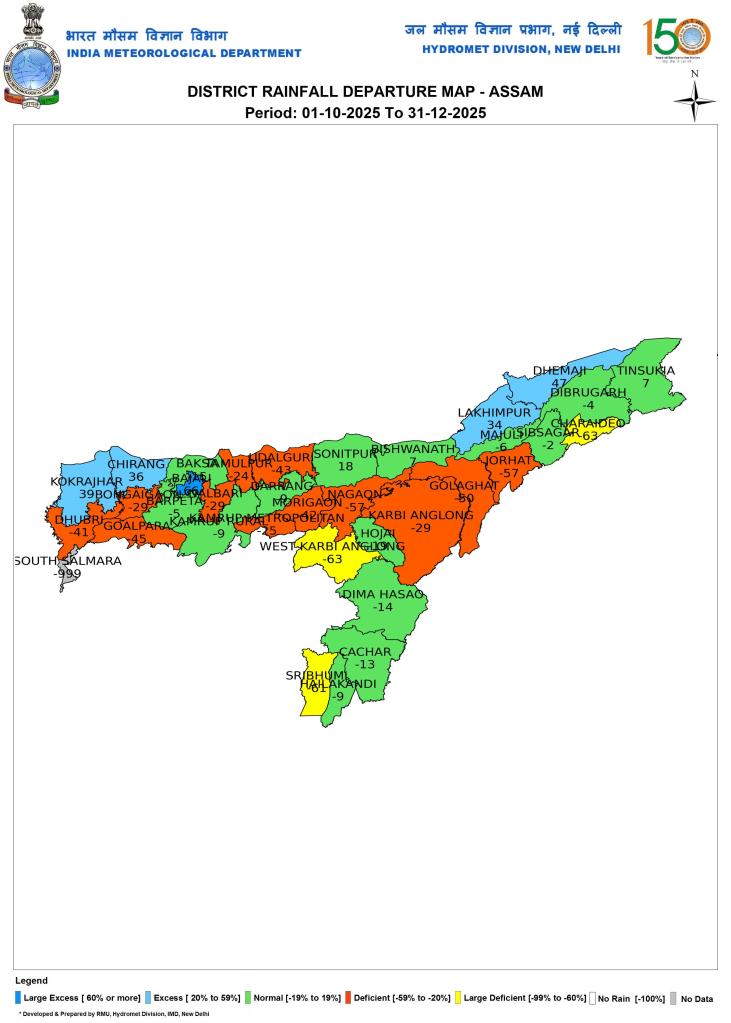
NORTH EAST ZONE: Assam
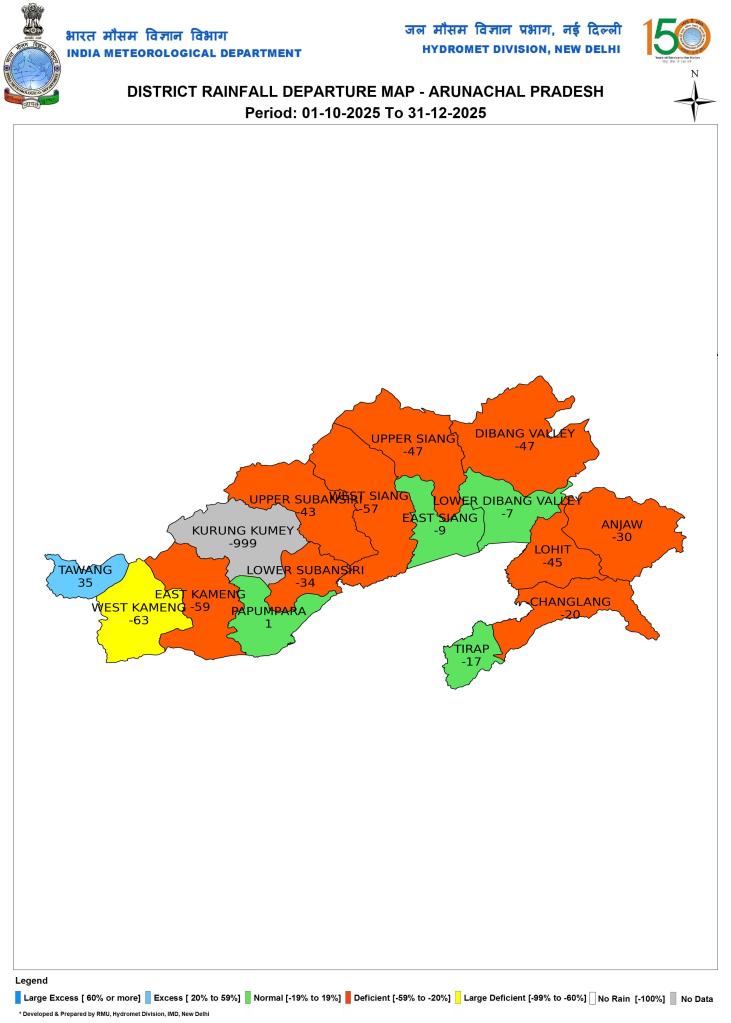
Arunachal Pradesh
Meghalaya

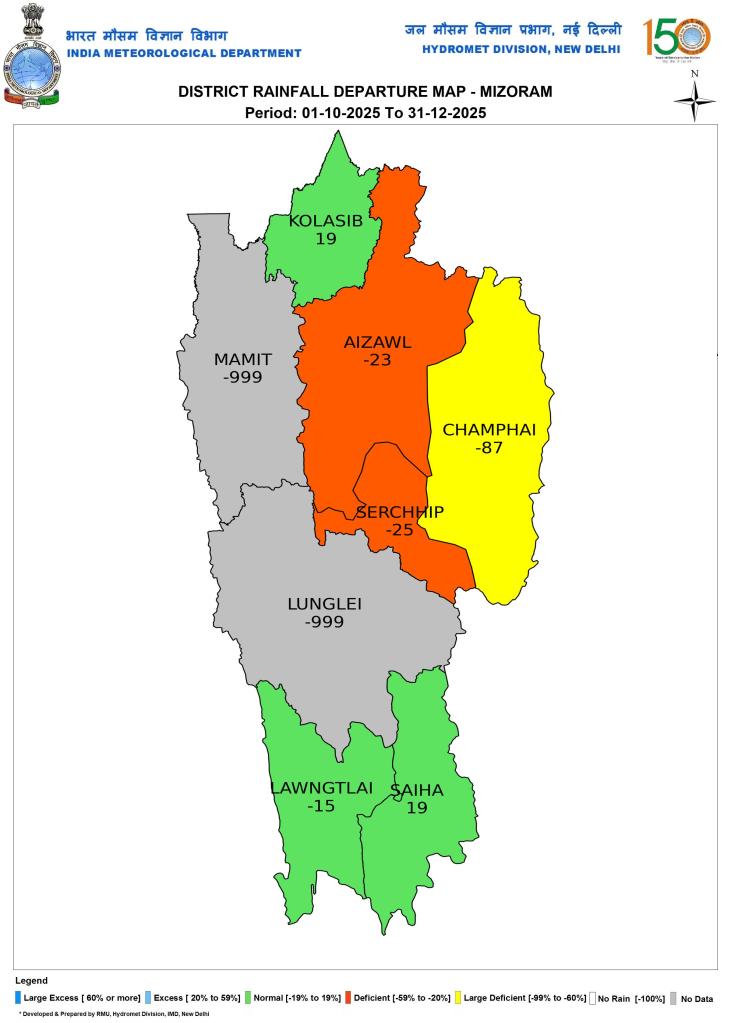
Mizoram
Manipur
Nagaland

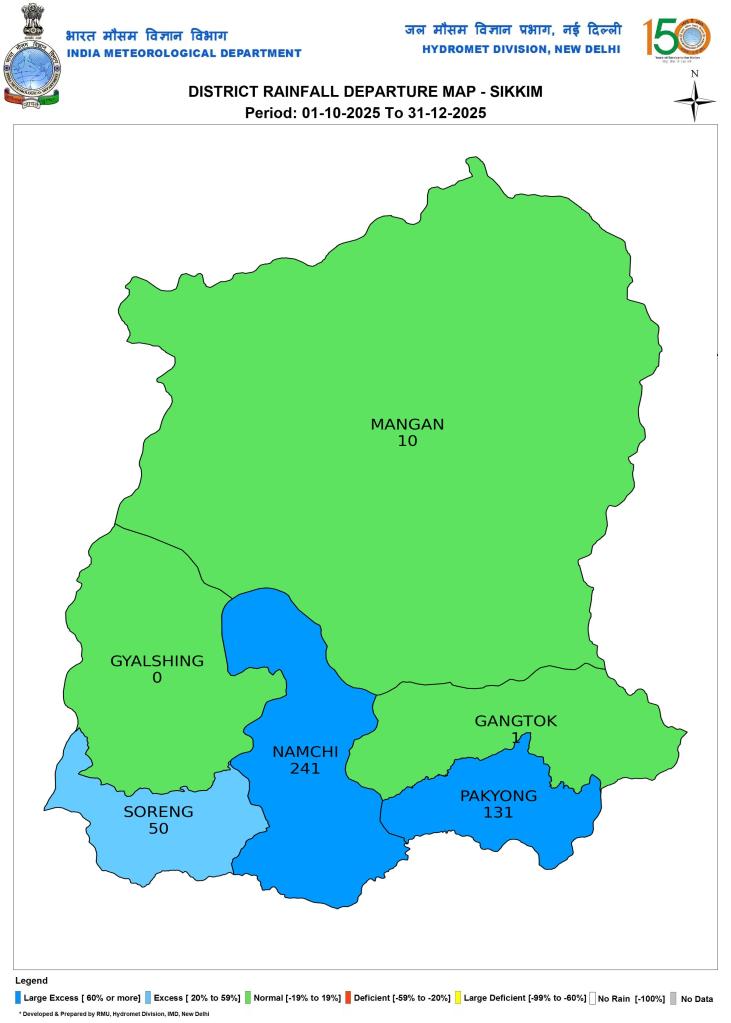
Sikkim
Tripura

SOUTH ZONE: Telangana

Andhra Pradesh
Karnataka
Kerala

Tamil Nadu

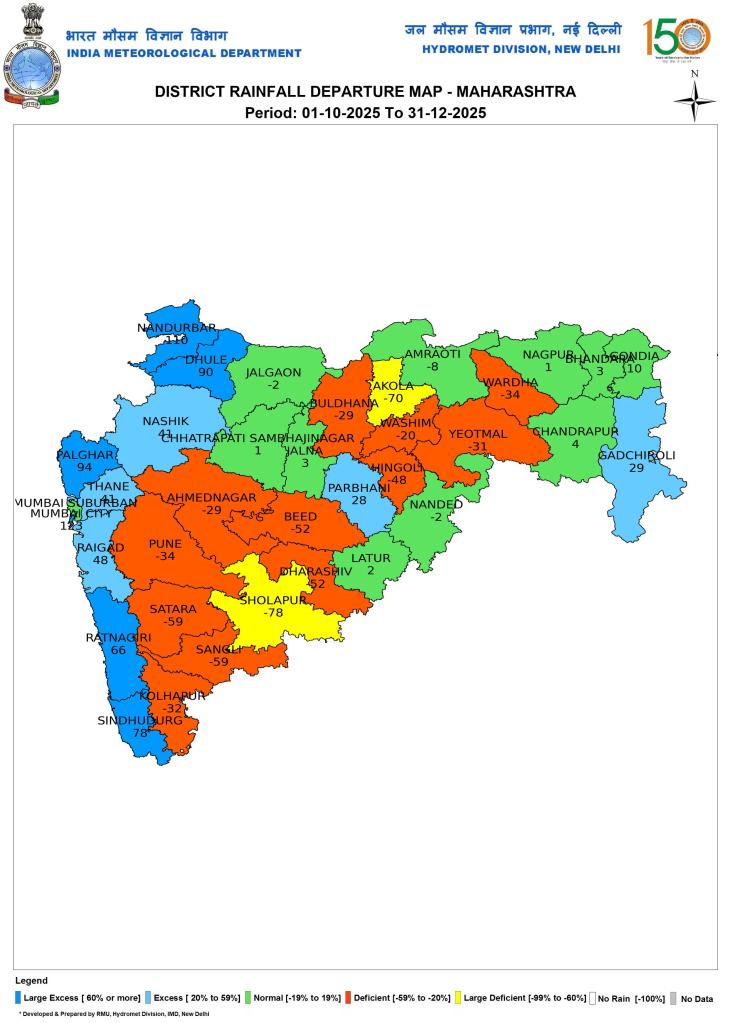
WEST ZONE: Maharashtra
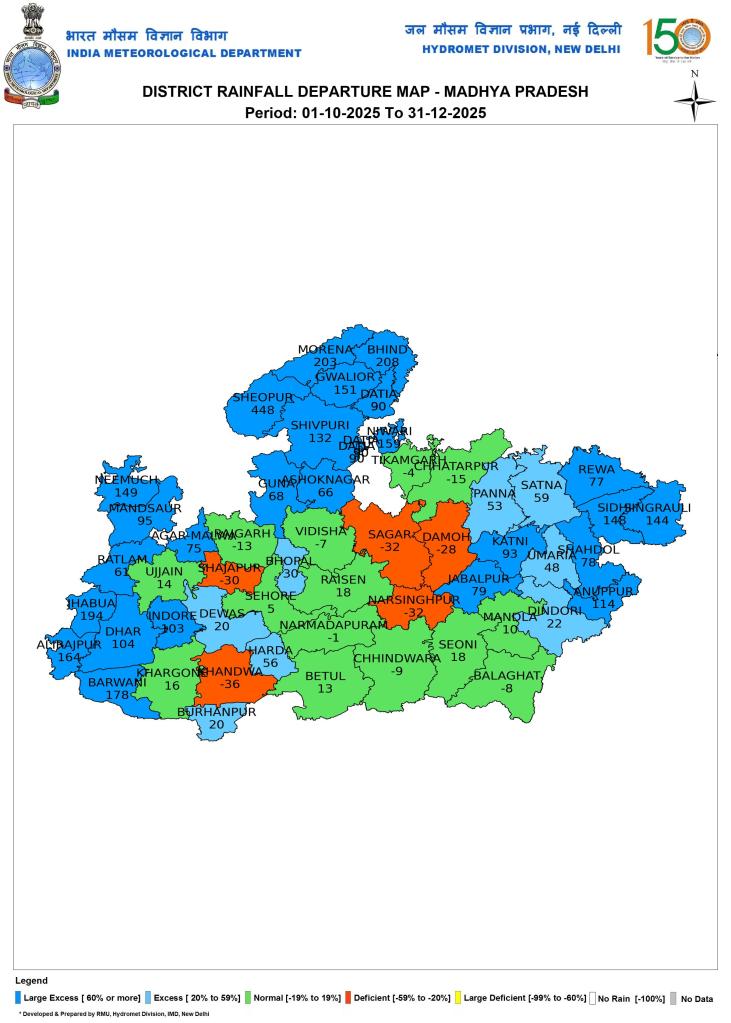
Madhya Pradesh
Gujarat

Rajasthan
Goa
SANDRP (ht.sandrp@gmail.com)
END NOTES:
[i] India Meteorological Department (IMD) divides a water year (June 1 to May 31) into four seasons: Monsoon: (June 1 to Sept 30), Post monsoon (Oct 1 to Dec 31), Winter (Jan 1 to Feb 28/9) and Pre-Monsoon (March 1 to May 31). For rainfall during all these seasons, IMD’s hydro-meteorological website provides a lot of data on daily basis, including daily district wise, state-wise, sub division wise and river wise rainfall maps among many other weekly, monthly and seasonal products. However, one problem with it is that none of this information is achieved. So if you missed seeing or downloading available data on any date, there is no way to look at it even next day. This is even true of the seasonal rainfall maps, unfortunately.
[ii] https://sandrp.in/2024/01/01/post-monsoon-2023-district-wise-rainfall-in-india/
[iii] https://sandrp.in/2023/01/01/post-monsoon-2022-district-wise-rainfall-in-india/
[iv] https://sandrp.in/2021/12/31/post-monsoon-2021-district-wise-rainfall-in-india/
[v] https://sandrp.in/2020/06/05/india-received-20-excess-rains-in-pre-monsoon-2020/
[vi] https://sandrp.in/2021/01/01/state-wise-post-monsoon-2020-rainfall/
