Guest Article by: Aishani Goswami and Rahul Singh
Walking through Dhimarpura village, in Seondha block, Datia district, Madhya Pradesh, heaps of broken clay tiles, wooden logs and other construction materials could be seen. Temporary tent-like shelters made of plastic sheets were erected in place of the houses that fell due to the floods in River Sindh in 2021.
In this article we try and put together available information to understand the role played by the Madhikheda system of dams in worsening the flood disaster in Sindh River basin in first week of August 2021. It may be noted that whenever a dam proposed, one of the claimed benefits is that the dams can help moderate floods in the downstream area. This is indeed true, provided, the dam is operated with the objective. However, when the dam is not operated with that objective, then the dam can actually end up acting like a force multiplier for the flooded downstream areas. Let us see if Madhikheda dam played that role in August 2021.
Kiran, a resident of Dhimarpura village mentioned, “Our house got damaged, all household items were lost in the flood, and some cattle lost their lives”. Her family and many other families left their village on the night of 3rd August 2021 to take refuge on a higher elevation area in the jungles. Kiran’s family returned to the village after about 2 months, which was the time it took to rebuild a temporary shelter with help of their relatives. Many others in Dhimarpura and other villages on the banks of River Sindh narrated a similar story of overnight evacuation from their village on the night of 3rd August ’21. They did not receive any alert about the floods or to evacuate their village but left their homes when they saw water in the river rising or heard from other villages about heavy floods in the river.


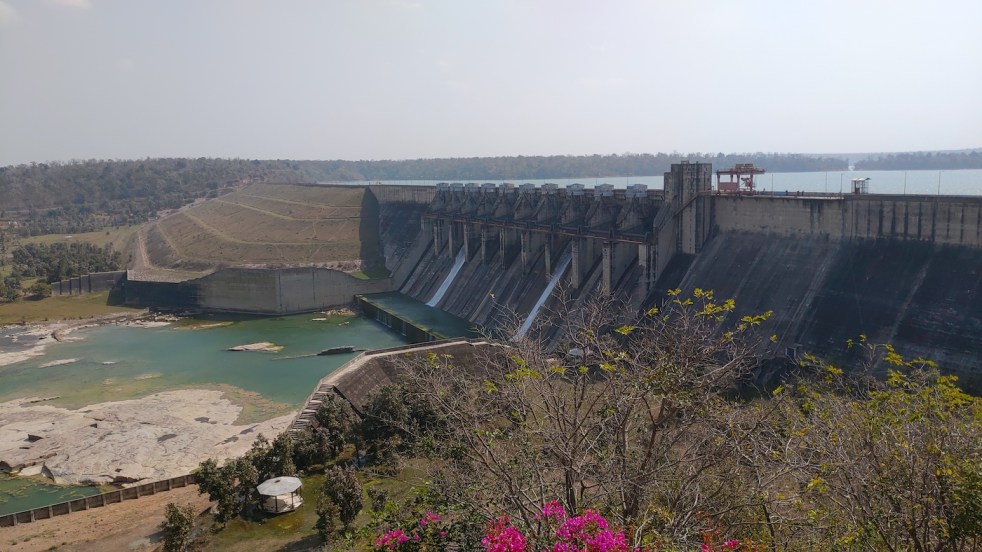
The 2021 floods in River Sindh impacted agriculture, shelter and habitat (villages like Dobhiyai, Dhimarpura, Girbasa), and three concrete bridges washed away. The villagers on the river’s banks mentioned that the intensity of these floods was unlike any they saw during their lifetime. In most monsoons, water in the river would rise slowly, giving them enough time to safeguard themselves. Many villagers noted that the sudden and high volume of water was released by opening all the 10 gates of the Madikheda dam resulting in the heavy floods in downstream of the dams.
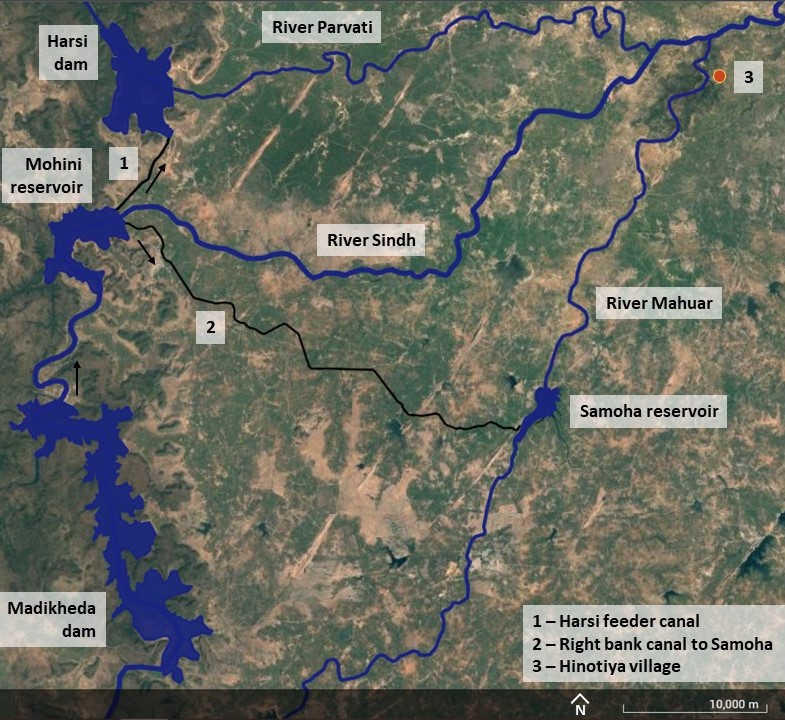
Hinotiya village is adjacent to River Mahuar, a tributary to River Sindh and close to the confluence of Mahuar and Sindh. The villagers of Hinotiya mentioned that in August ‘21, the water flow in River Sindh was so high that for the first time, they witnessed river water flow from Sindh to Mahuar and not the other way. This reverse flow was unusual, and only witnessed at the time of the 2021 floods. Water from Mohini reservoir is released through canals to Samoha dam and Harsi dam on Rivers Mahuar and Parvati respectively.

The villages in the upstream of the dams also experienced floods during the same time but of a slightly different nature. As explained by Bageshwar Singh who walked along the river from the dams in the upstream direction, the farms, and houses in the low-lying areas of the villages were flooded in 2021. These houses belonged to the scheduled castes and scheduled tribes who had to leave their houses and find shelter during the floods. But the river’s water levels increased gradually over a duration of 1 or 2 days, giving them enough time to take action; unlike in the downstream area, where water level rise was rapid, over a few hours.
The district rainfall data from Indian Meteorological Department show heavy rainfall on 1st and 2nd August 2021, which would have resulted in floods. In the hindsight, was it possible to plan and gradually open the dam gates instead of all at once? We compile some available data in this article to understand this.

Madikheda (Atal Sagar) dam and Mohini pickup reservoir, in Shivpuri district, are the two main dams on River Sindh. Madikheda dam (Full Reservoir Level (FRL) 346.25 m, Maximum Water Level (MWL) 346.85 m) is on the upstream of Mohini reservoir (FRL 276.25 m, MWL 276.85m). Madikheda dam is also used for 60 MW hydropower generation and irrigation. These dams are a part of Sindh Phase II Irrigation project, along with Harsi dam on River Parvati and Samoha weir on River Mahuar and Ukayala anicut. This project was designed to create irrigation potential of 98,251 hectares and annual irrigation of 1.62 lakh hectares, in the command area districts of Gwalior, Shivpuri, Bhind and Datiai. However, the performance audit conducted by CAG found that the utilisation of the irrigation potential created was only upto 64%[i].


Rainfall data:
The table below shows daily district-wise rainfall of the dam and its upstream districts (Shivpuri, Ashoknagar, Guna, Vidisha) and the districts of villages affected by the 2021 floods in River Sindh (Shivpuri, Datia)
| Date | Districts | Actual rainfall (mm) | Normal rainfall (mm) | % deviation |
| 01.08.2021 | Datia | 5 | 7 | -29% |
| Shivpuri | 17.3 | 9.2 | 88% | |
| Ashoknagar | 13.5 | 9.6 | 41% | |
| Guna | 53 | 10.9 | 386% | |
| Vidisha | 12.5 | 13.7 | -9% | |
| 02.08.2021 | Datia | 90.1 | 8.6 | 947% |
| Shivpuri | 141.8 | 10.7 | 1225% | |
| Ashoknagar | 76.3 | 8.6 | 787% | |
| Guna | 87.1 | 9.8 | 789% | |
| Vidisha | 35.5 | 12.3 | 188% | |
| 03.08.2021 | Datia | 37.3 | 12.2 | 205% |
| Shivpuri | 312.8 | 11.6 | 2596% | |
| Ashoknagar | 154 | 8 | 1825% | |
| Guna | 136.4 | 11.8 | 1056% | |
| Vidisha | 42.7 | 10.7 | 299% | |
| 04.08.2021 | Datia | 3.4 | 9.1 | -63% |
| Shivpuri | 55.3 | 8.1 | 583% | |
| Ashoknagar | 33 | 10.2 | 224% | |
| Guna | 80.5 | 11 | 632% | |
| Vidisha | 8.9 | 16.2 | -45% | |
| 05.08.2021 | Datia | 2.5 | 10.8 | -77% |
| Shivpuri | 18.7 | 8.4 | 122% | |
| Ashoknagar | 29.3 | 12.1 | 142% | |
| Guna | 72.8 | 12 | 506% | |
| Vidisha | 61.4 | 11.7 | 424% | |
| 06.08.2021 | Datia | 3.4 | 11.2 | -70% |
| Shivpuri | 17.9 | 9.1 | 97% | |
| Ashoknagar | 61.5 | 13.3 | 362% | |
| Guna | 130.1 | 12 | 984% | |
| Vidisha | 83.9 | 14.7 | 471% | |
| 07.08.2021 | Datia | 2.3 | 15.6 | -85% |
| Shivpuri | 20.9 | 10.2 | 105% | |
| Ashoknagar | 29 | 10 | 190% | |
| Guna | 108.1 | 11.6 | 832% | |
| Vidisha | 32.6 | 9.3 | 251% | |
| 08.08.2021 | Datia | 1 | 11.2 | -91% |
| Shivpuri | 14.4 | 12.4 | 16% | |
| Ashoknagar | 21.3 | 10 | 112% | |
| Guna | 12.3 | 9.4 | 31% | |
| Vidisha | 12.7 | 8.6 | 48% | |
| 09.08.2021 | Datia | 22.6 | 7.2 | 214% |
| Shivpuri | 2.9 | 11.8 | -76% | |
| Ashoknagar | 12 | 8.7 | 38% | |
| Guna | 10.3 | 13.9 | -26% | |
| Vidisha | 7.8 | 11.4 | -32% |
Source: Indian Meteorological Department
Both the main dams on River Sindh are in the Shivpuri district and rainfall in this district and in the dams’ upstream districts was very high on the 2nd, 3rd and 4th August as can be seen from the IMD data from above table. The high intensity rainfall during these days, would have led to increase in river flow. But the sudden opening of Madikheda and Mohini dams resulted in huge damage in the downstream of the dams.

Dams’ gates opening data, reservoir level and capacity data:
The table below shows change in reservoir water level and capacity in the days leading to and during the flood:
| Date | Madikheda | Mohini | ||||
| Level (m) | Live capacity (MCM) | % live capacity | Level (m) | Live capacity (MCM) | % live capacity | |
| 01.08.2021 | 334.25 | 285.06 | 34 | 269.1 | 20.59 | 19 |
| 02.08.2021 | 336 | 341.44 | 40 | 270.7 | 32.58 | 30 |
| 03.08.2021 | 346.24 | 834.13 | 99 | 275.4 | 79.42 | 74 |
| 04.08.2021 | 342.2 | 600.91 | 71 | 273.5 | 61.25 | 57 |
| 05.08.2021 | 343.5 | 663.92 | 79 | 272.2 | 46.63 | 43 |
(Source: Madhya Pradesh Water Resources Department)
Madikheda dam records show it reached Full Reservoir Level (346.24 m), and the dam was at 99% live capacity at 8 am on 3rd August 2021. The change of Madikheda dam’s reservoir level from 336 m at 8 am on 2nd August to 346.24 m (Full Reservoir Level) at 8 am on 3rd August (10.24 m difference) is unusually high; and for the same dates the change in live capacity is from 341.44 MCM to 834.13 MCM. Madikheda reservoir was 40% filled (% live capacity) on 2nd August, which increased to 99% on 3rd August. During monsoon, reservoir level and capacity are measured at every hour, which means the increase in reservoir level were noted every hour, on days preceding 3rd August. So, based on the pattern of rapid increase in water levels noted for Madikheda dam, the dam gates should have been opened to gradually begin releasing water, instead of all at once as seen in the table below. Please note that no gates were opened till 9 pm on Aug 2nd and then suddenly all ten gates were opened by 8 am on Aug 3 to release massive 10800 cumecs water.
Madikheda dam – Water level, reservoir capacity, gate opening, discharge daily data:
| Observation Date | Observation Time | Water Level (In M) | Live Capacity (In M.cum) | No. of Gates Open | Overflow (In Cumec) |
| 22-07-2021 | 08:00:00 | 326.85 | 98.25 | ||
| 23-07-2021 | 08:00:00 | 326.85 | 98.25 | ||
| 24-07-2021 | 08:00:00 | 326.85 | 98.25 | ||
| 25-07-2021 | 08:00:00 | 326.9 | 99.17 | ||
| 26-07-2021 | 08:00:00 | 326.9 | 99.17 | ||
| 27-07-2021 | 08:00:00 | 326.95 | 100.09 | ||
| 28-07-2021 | 08:00:00 | 329.05 | 139.5 | ||
| 29-07-2021 | 08:00:00 | 329.7 | 155.05 | ||
| 30-07-2021 | 08:00:00 | 330.1 | 164.75 | ||
| 31-07-2021 | 08:00:00 | 331.7 | 205.16 | ||
| 01-08-2021 | 08:00:00 | 334.35 | 285.06 | ||
| 02-08-2021 | 08:00:00 | 336 | 341.44 | ||
| 03-08-2021 | 08:00:00 | 346.24 | 834.13 | 10 | 10800 |
| 04-08-2021 | 08:00:00 | 342.2 | 600.91 | 10 | 10800 |
| 04-08-2021 | 10:00:00 | 10 | 500 | ||
| 05-08-2021 | 08:00:00 | 343.5 | 663.92 | 10 | 600 |
| 05-08-2021 | 20:00:00 | 6 | 1021 | ||
| 06-08-2021 | 08:00:00 | 343.7 | 673.64 | 8 | 2531 |
| 07-08-2021 | 08:00:00 | 341.45 | 565.68 | 10 | 4312 |
| 07-08-2021 | 12:00:00 | 10 | 4230 | ||
| 08-08-2021 | 08:00:00 | 342.4 | 610.59 | 8 | 2196 |
| 08-08-2021 | 08:00:00 | 8 | 2196 | ||
| 08-08-2021 | 13:30:00 | 0 | 0 | ||
| 09-08-2021 | 08:00:00 | 343.55 | 666.35 | ||
| 09-08-2021 | 16:00:00 | 4 | 1033 | ||
| 10-08-2021 | 08:00:00 | 343.45 | 661.49 | 4 | 1006 |
| 10-08-2021 | 16:00:00 | 4 | 1006 | ||
| 11-08-2021 | 08:00:00 | 343.55 | 666.35 | 4 | 361 |
| 11-08-2021 | 12:00:00 | 0 | 0 | ||
| 12-08-2021 | 08:00:00 | 344.05 | 691.23 | ||
| 13-08-2021 | 08:00:00 | 344.3 | 706.3 | ||
| 14-08-2021 | 08:00:00 | 344.5 | 718.36 | ||
| 15-08-2021 | 08:00:00 | 344.65 | 727.4 |
(Source: Madhya Pradesh Water Resources Department)
All 10 gates of Madikheda dam were opened between 9 pm on 2nd August and 8 am on 3rd August, and the discharge rate was 10800 cumec. Madikheda dam’s officials said that they started opening dam gates on 2nd August at 9 pm. This high discharge was released for 2 days (2nd August to 4th August). The rainfall data showed that heavy rainfall was recorded on 2nd and 3rd August in Shivpuri district (both dams are in this district) and dams’ upstream districts. IMD publishes figures of rainfall for 24 hours ending at 8 am daily – so if IMD reports heavy rainfall for 2nd August, it means that it has rained heavily between 8 am on 1st August to 8 am on 2nd August. Madikheda and Mohini dams’ gates’ should have gradually opened on 1st August or earlier (with proper forecast considerations) and begin to release water from the reservoirs in small amounts. The sudden opening of all 10 gates of Madikheda dam on Aug 2-3 led to sudden rapid increase in river water level, resulting in massive damaging flood impacts.
Mohini – Water level, reservoir capacity, gate opening, discharge hourly data:
| Observation date | Time | WL MPUW | Live Capacity | No. of gates open | Gate opening details | Overflow from spillway (cumec) |
| 31.07.2021 | 8:00 AM | 269 | 19.9 | 0 | All gates closed | |
| 10:00 AM | 269 | 19.9 | 0 | |||
| 12:00 PM | 269 | 19.9 | 0 | |||
| 2:00 PM | 269 | 19.9 | 0 | |||
| 4:00 PM | 269 | 19.9 | 0 | |||
| 6:00 PM | 269.1 | 20.59 | 0 | |||
| 8:00 PM | 269.1 | 20.59 | 0 | |||
| 10:00 PM | 269.1 | 20.59 | 0 | |||
| 01.08.2021 | 12:00 AM | 269.1 | 20.59 | 0 | ||
| 2:00 AM | 269.1 | 20.59 | 0 | |||
| 4:00 AM | 269.1 | 20.59 | 0 | |||
| 6:00 AM | 269.1 | 20.59 | 0 | |||
| 8:00 AM | 269.1 | 20.59 | 0 | |||
| 10:00 AM | 269.1 | 20.59 | 0 | |||
| 12:00 PM | 269.1 | 20.59 | 0 | |||
| 2:00 PM | 269.1 | 20.59 | 0 | |||
| 4:00 PM | 269.1 | 20.59 | 0 | |||
| 6:00 PM | 269.1 | 20.59 | 0 | |||
| 8:00 PM | 269.2 | 21.29 | 0 | |||
| 10:00 PM | 269.4 | 22.68 | 0 | |||
| 02.08.2021 | 12:00 AM | 269.7 | 24.77 | 0 | ||
| 2:00 AM | 270 | 26.85 | 0 | |||
| 4:00 AM | 270.2 | 28.49 | 0 | |||
| 6:00 AM | 270.6 | 31.76 | 0 | |||
| 8:00 AM | 270.7 | 32.58 | 0 | |||
| 10:00 AM | 270.8 | 33.3 | 0 | |||
| 12:00 PM | 271.2 | 36.92 | 0 | |||
| 2:00 PM | 271.9 | 49.54 | 0 | |||
| 4:00 PM | 273 | 55.21 | 0 | |||
| 6:00 PM | 273.8 | 64.87 | 0 | All gates closed | ||
| 8:00 PM | 274.4 | 72.68 | 3 | #13 gate – 0.9 m – 4239 cusec #12 #14 gates – 0.6 m – 5704 cusec | 196 | |
| 10:00 PM | 273.1 | 56.42 | ||||
| 03.08.2021 | 12:00 AM | 272 | 44.49 | |||
| 2:00 AM | 272.6 | 50.92 | 21 | at 1.30 am, 20 gates – 7 m 1 gate – 1 m | 5891 | |
| 4:00 AM | 273.4 | 62.46 | ||||
| 6:00 AM | 274.9 | 79.42 | 23 | 21 gates – 8 m – 387918 cusec 1 gate – 3 m – 9520 cusec 1 gate – – 4082 cusec | 11363 | |
| 8:00 AM | 275.4 | 86.81 | ||||
| 10:00 AM | 275.35 | 86.05 | ||||
| 12:00 PM | 275.3 | 85.3 | 23 | at 11 am, 23 gates | 12168 | |
| 2:00 PM | 275.1 | 82.28 | ||||
| 4:00 PM | 274.9 | 79.42 | 11363 | |||
| 6:00 PM | 274.8 | 78.07 | ||||
| 8:00 PM | 274.7 | 76.73 | 23 | 10672 | ||
| 10:00 PM | 274.7 | 76.73 | ||||
| 04.08.2021 | 12:00 AM | 274.5 | 74.03 | |||
| 2:00 AM | 274.3 | 71.33 | ||||
| 4:00 AM | 274 | 67.19 | ||||
| 6:00 AM | 273.5 | 61.25 | 23 | 8747 | ||
| 8:00 AM | 273.4 | 50.92 | ||||
| 10:00 AM | 272.2 | 46.63 | 14 | At 9.30 am | 4668 | |
| 12:00 PM | 272.8 | 47.71 | ||||
| 2:00 PM | 271.9 | 43.54 | 7 | At 1 pm | 973 | |
| 4:00 PM | 271.9 | 43.54 | ||||
| 6:00 PM | 271.9 | 43.54 | 7 | At 5 pm | 973 | |
| 8:00 PM | 272.1 | 44.49 | 5 | At 7 pm | 799 | |
| 10:00 PM | 272.1 | 45.56 | 5 | At 9 pm | 799 | |
| 05.08.2021 | 12:00 AM | 272 | 44.49 | 5 | At 11 pm | 799 |
| 2:00 AM | 272 | 44.49 | 5 | 799 | ||
| 4:00 AM | 272 | 44.49 | 5 | 799 | ||
| 6:00 AM | 272.1 | 45.56 | 5 | 799 | ||
| 8:00 AM | 272.2 | 46.63 | 5 | 799 | ||
| 10:00 AM | 272.2 | 46.63 | 5 | 799 | ||
| 12:00 PM | 272.2 | 46.64 | 5 | 799 | ||
| 2:00 PM | 272.2 | 46.64 | 5 | 799 | ||
| 4:00 PM | 272.1 | 46.64 | 5 | #13 gate – 4.9 m #12 #14 gate – 4.3 m #11 #15 gate – 3.6 m | 1200 | |
| 6:00 PM | 272 | 46.64 | 5 | 1200 | ||
| 8:00 PM | 272.5 | 46.64 | 5 | 1200 | ||
| 10:00 PM | 272 | 46.64 | 5 | 1200 | ||
| 06.08.2021 | 12:00 AM | 272 | 46.64 | |||
| 2:00 AM | 272.4 | 48.78 | 13 | At 1.20 am, #13 gate – 4.5 m #12 #14 gate – 4.0 m #11 #15 gate – 3.5 m #10 #16 gate – 3.0 m #09 #17 gate – 2.5 m #08 #18 gate – 2.0 m #07 #19 gate – 1.5 m | 2467 | |
| 4:00 AM | 272.5 | 49.85 | 2467 | |||
| 6:00 AM | 272.5 | 50.02 | 2467 | |||
| 8:00 AM | 272.7 | 51.99 | 2467 | |||
| 10:00 AM | 272.8 | 53.07 | 2467 | |||
| 11:00 AM | 272.85 | 53.6 | 2467 | |||
| 12:00 PM | 272.9 | 54.14 | 2467 | |||
| 1:00 PM | 272.9 | 54.14 | 2467 | |||
| 2:00 PM | 272.95 | 54.67 | 2467 | |||
| 3:00 PM | 272.95 | 54.67 | 2467 | |||
| 4:00 PM | 273 | 55.21 | 2467 | |||
| 5:00 PM | 273 | 55.21 | 2467 | |||
| 6:00 PM | 273 | 55.21 | 11 | #13 gate – 4.9 m #12 #14 gate – 4.6 m #11 #15 gate – 4.3 m #10 #16 gate – 4.0 m #09 #17 gate – 3.6 m #08 #18 gate – 3.3 m | 3128 | |
| 7:00 PM | 273 | 55.21 | ||||
| 8:00 PM | 273 | 55.21 | 15 | #13 gate – 5.2 m #12 #14 gate – 4.9 m #11 #15 gate – 4.6 m #10 #16 gate – 4.3 m #09 #17 gate – 4.0 m #08 #18 gate – 3.7 m #07 #19 gate – 3.3 m #06 #20 gate – 3.0 m | 4235 | |
| 9:00 PM | 273.3 | 58.83 | ||||
| 10:00 PM | 273.3 | 58.83 | 16 | #12 #13 gate – 5.8 m #11 #14 gate – 5.5 m #10 #15 gate – 5.2 m #09 #16 gate – 4.9 m #08 #17 gate – 4.6 m #07 #18 gate – 4.3 m #06 #19 gate – 4.0 m #05 #20 gate – 3.7 m | 5060 | |
| 11:00 PM | 273.35 | 59.43 | 5060 | |||
| 07.08.2021 | 12:00 AM | 273.3 | 58.83 | 5060 | ||
| 1:00 AM | 273.3 | 58.83 | 5060 | |||
| 2:00 AM | 273.3 | 58.83 | 5060 | |||
| 3:00 AM | 273.3 | 58.83 | 5060 | |||
| 4:00 AM | 273.3 | 58.83 | 5060 | |||
| 5:00 AM | 273.3 | 58.83 | 5060 | |||
| 6:00 AM | 273.3 | 58.83 | 5060 | |||
| 7:00 AM | 273.3 | 58.83 | 5060 | |||
| 8:00 AM | 273.3 | 58.83 | 5060 | |||
| 10:00 AM | 273.1 | 56.42 | 5060 | |||
| 12:00 PM | 273.1 | 56.42 | 5060 | |||
| 1:00 PM | 273 | 55.21 | #16 gate – open; #05 #20 gates closed #12 gate – open; #05 #20 gates closed | 4172 -> 4100 | ||
| 2:00 PM | 272.8 | 53.07 | ||||
| 3:00 PM | 272.4 | 48.78 | 11 | #13 gate – 6.0 m #12 #14 gate – 5.8 m #11 #16 gate – 5.5 m #10 #17 gate – 5.5 m #09 #18 gate – 1.0 m #08 #19 gate – 1.0 m | 2322 -> 2854 | |
| 4:00 PM | 272.3 | 47.71 | ||||
| 6:00 PM | 272 | 44.49 | ||||
| 8:00 PM | 272 | 44.49 | 1681 -> 2400 | |||
| 10:00 PM | 272.4 | 48.78 | ||||
| 11:00 PM | 272.6 | 50.92 | ||||
| 08.08.2021 | 12:00 AM | 272.75 | 52.53 | |||
| 1:00 AM | 272.9 | 54.14 | ||||
| 2:00 AM | 273 | 55.21 | ||||
| 3:00 AM | 273.1 | 56.42 | ||||
| 4:00 AM | 273.2 | 57.68 | ||||
| 5:00 AM | 573.3 | 58.83 | ||||
| 6:00 AM | 273.3 | 58.83 | ||||
| 7:00 AM | 273.4 | 60.04 | ||||
| 8:00 AM | 273.4 | 60.04 | ||||
| 9:00 AM | 273.4 | 60.04 | 3 | At 9.30 am, #13 gate – 1.5 m #12 #14 gate – 0.9 m Total opening – 2.4 m | 350 -> 550 | |
| 10:00 AM | 273.4 | 60.04 | ||||
| 11:00 AM | 273.6 | 62.46 | ||||
| 12:00 PM | 273.7 | 63.67 | ||||
| 1:00 PM | 273.8 | 64.87 | 0 | All gates closed | 0 -> 150 | |
| 2:00 PM | 273.8 | 64.87 | ||||
| 3:00 PM | 273.8 | 64.87 | ||||
| 4:00 PM | 273.8 | 64.87 | ||||
| 5:00 PM | 273.8 | 64.87 |
For Mohini reservoir, as seen in the table,
- 3 gates were first opened at 8 pm on 2nd August: 196 cumec discharge
- 21 gates were opened at 2 am on 3rd August: 5891 cumec discharge
- 23 gates were opened at 6 am on 3rd August: 11363 cumec discharge
The increase in discharge from spillway from 196 cumec to 11363 cumec, is within a span of 10 hours. This release also correlates to the timing and discharge from its upstream Madikheda dam. The officers at Mohini reservoir said that the water released from Madikheda reaches Mohini dam in about 2 hours. They noticed Mohini reservoir’s water level rising from 6 pm onwards on 2nd Aug ‘21.
River flow monitoring and dam operations:
As per MPWRD’s portal called Water Resources Information and Management System there are 2 hydrological observation sites on River Sindh monitored by Central Water Commission. CWC’s Ganga basin report maps one site as a gauge – discharge – water quality station, which is at Pachauli (upstream of the dams); and the other is a gauge – discharge – sediment – water quality station, at Seondha (downstream of the dams). The MPWRD portal shows hydrological stations monitored by the state on some tributaries of River Sindh, but not on the river itself, and India WRIS portal mentions three state monitored sites at Behgawan, Behtaghat and Goraghat.[ii]

The staff at Madikheda dam informed us that they get hourly river water level data from the Pachauli gauge station during monsoon; and it takes around 8 hours for river water to reach Madikheda dam from Pachauli station. Reservoir level in the dam is measured at an hourly interval during monsoon. Rainfall contribution from different rain gauge stations in the dam’s catchment area is considered as Madikheda – 19.12%, Rannod – 35.06%, Behtaghat – 17.7%, Aron – 21.86%, Lateri – 6.26%. Decision to open gates of the dam is taken by the executive engineer based on rainfall data in the dam’s catchment, river’s discharge data in the upstream of the dam (inflow to dam) and water level in the reservoir.
Rule curve of a dam shows the changing storage in the dam across time and guides the gate opening schedule. Rule curves for Madikheda and Mohini dams are not available in the public domain, and three RTI applications have been filed by the authors with the MP Water Resource Department for the same and it has been more than 30 days and the response is still awaited. Mr. A B Pandya, Secretary General, ICID and Ex-CWC Chairman mentioned, “Dam operations are done by the state water resource departments, unless it is an inter-state river which is where CWC is involved. So, preparing the rule curve, and updating it is under the state’s water resource department, and CWC could provide advisory such as inflow forecast and flood forecast.” Rule curve should be prepared as per BIS code 7323-1994, and there is no fixed interval when a rule curve should be revised as per the code, but it depends upon factors such as, change in elevation-capacity relationship due to siltation, revision in design flood, construction of dams upstream or downstream, downstream channel capacity changes, change in hydrology or pattern of inflows, change in water demands etc. (CWC’s RTI response 05 April 2023 &13 April 2023).
When we spoke to some officers involved in dam operations of Madikheda and Mohini dams, the decision to release water from the dams seemed to be governed mostly by inflow to reservoir and reservoir levels to ensure water storage for Rabi crops’ irrigation. Water is stored in reservoir and not released until it reaches FRL, and any more inflow into the dam than is promptly released downstream, irrespective of the situation of floods in the downstream area. During high intensity rainfall, if water is released only when a reservoir reaches FRL there is a chance that it is released all at once and at high discharge, as was the case of Madikheda dam, and all the rapid release would add to the floods in the downstream area. In the downstream of dam, this is coupled with rainfall induced increased flow of river, multiplying the flood damage in the downstream area.
It rained heavily on 1st, 2nd, and 3rd August 2021, but Madikheda dam’s gates were opened only on the night of 2nd August, with a very high outflow (10 gates opened with outflow of 10800 cumecs) by morning of 3rd August, which was too sudden, too rapid, and coinciding with the flooded river downstream. It may be noted here that the SW Monsoon season is hardly halfway through by the first week of Aug. The dam should clearly not have been filled to FRL by that date particularly when heavy rainfall events were ongoing.
Rainfall forecast, upstream and downstream river flow data, upstream and downstream rainfall, downstream river flow capacity should be factored in before releasing water from dams. But this clearly did not happen at Madikheda dam, and the dam ended up creating a sudden flood disaster for the downstream area.
The central government enacted the Dam Safety Act at the end of the year 2021 for safe operations of dams. Mr. A. B. Pandya, former chairman of the Central Water Commission, in an interview given for this article, in response to a question about the role of the Dam Safety Act – 2021 made by the Central Government, said, “Dam itself is not the cause of disaster. Rather, Dam Safety Authority and Dam Safety Committee have been constituted to ensure that dams do not become the cause of any disaster due to natural and other types of disasters. This committee has been formed to handle the disaster”.
Episodes of high intensity rainfall are increasing, and real time rainfall data, reliable rain forecasts, reliable river flow data and river carrying capacity figures would be hugely helpful in taking dam operation decisions to minimise floods in the downstream area. But such dam operation is possible only if there is accountable dam operation standard operating procedure and those responsible are made answerable for the decisions taken.
After the decision is taken to open dam gates and release water, the information should be promptly communicated in the region downstream of the dam, which are likely to be impacted by such releases. Mr. R. P. Jha, Chief Engineer, Yamuna basin, MP Water Resources Department mentions, “Before opening the gates of the dam, we inform the concerned district administration about the amount of water to be released, and the villages that may be affected by it. The collectors and ADM of Gwalior, Datia and Bhind districts are notified about it by email, phone call or wireless. The collectors convey this information to the village through Patwari, Panchayat Secretary, Tehsildar and other government personnel”. He adds that sometimes there are issues in network connectivity during monsoon, and they contact the control room and wireless communication is helpful to pass the information. We did not see any evidence of this communication channels working to warn the downstream affected people.
This communication channels and SOPs (Standard Operating Procedures) must be clearly defined and responsibility fixed when they do not function as defined. This should in fact be legally enforceable so that local people not only know about it, but seek redressal when it does not function. Unfortunately in India, we do not have such a codified system in place.
The devastating impacts of the 2021 floods on villagers, living near River Sindh were distressing. Many had to suffer damage to crops, houses, cattle, had to rebuild and repair their houses, treat the eroded agriculture soil, set-up damaged infrastructure and bear other losses. Kiran and many others like her are worried if the floods would occur again in the next monsoons. In addition to providing irrigation water to their command areas, dams can play a role in flood management, provided they are operated with that objective. In any case they should not be a cause in aggravating flood impacts for their downstream region. And when they do create avoidable flood disaster in the downstream areas, the dam operators must be held accountable. Under changing climate this becomes even more pertinent as the rain patterns are rapidly changing to increase frequency, spread and intensity of high rainfall events. Unaccountable dam operations like was the case for Madhikheda system of dams in Aug 2021 could create frequent, avoidable flood disasters.
Aishani Goswami and Rahul Singh[iii] (Aishani Goswami (aishaningoswami@gmail.com) is an Ahmedabad based architect and water practitioner, currently working as senior project associate with WIN Foundation. Rahul Singh is a Jharkhand-based freelance journalist, and writes on environmental issues from Jharkhand, Bihar, and West Bengal. He was previously associated with Prabhat Khabar newspaper.)
ANNEXURE:
From old boards kept unused condition at Mohini and Madikheda:
- Mohini
| Reservoir level (meter) | Live capacity (MCM) | Gross capacity (MCM) | Reservoir capacity (%) | |
| By 30th July | 273 | 56.67 | 58.37 | 54.49 |
| By 15th Aug | 273 | 56.67 | 58.37 | 54.49 |
| By 31st Aug | 273 | 56.67 | 58.37 | 54.49 |
| By 15th Sept | 276.25 | 105.41 | 107.11 | 100 |
- Madikheda:
| Reservoir level (meter) | Live capacity (MCM) | Gross capacity (MCM) | Reservoir capacity (%) | |
| By 30th July | 337 | 379.21 | 446.19 | 45 |
| By 15th Aug | 342 | 591.23 | 658.21 | 71 |
| By 31st Aug | 345 | 748.5 | 815.48 | 90 |
| By 15th Sept | 346.25 | 834.83 | 901.81 | 100 |
END NOTES:
[i] Report of the Comptroller and Auditor General of India on Performance Audit on Achievement of objectives of Sindh Project Phase-II for the year ended 31 March 2019 – Government of Madhya Pradesh, Report No. 2 of the year 2022
[ii] https://geoportal.mp.gov.in/wrd/home.aspx; https://app.powerbi.com/view?r=eyJrIjoiYjNmNDRjYjgtYzc3MS00MjY1LWExZjYtZWE1NDE4NGU2ZTM1IiwidCI6IjQ2MjM5ZWQ0LTk0OTktNDU3NS04YzMxLTBjNjhhZWJhNTI3NSJ9, https://indiawris.gov.in/wris/#/RiverMonitoring
[iii] This article is an output from ‘Moving Upstream: Sindh’ fellowship offered by Veditum India Foundation, through which Aishani Goswami and Rahul Singh walked for 155 kms along River Sindh in 12 days. Authors would like to acknowledge the guidance of Himanshu Thakkar of SANDRP in writing this article.
