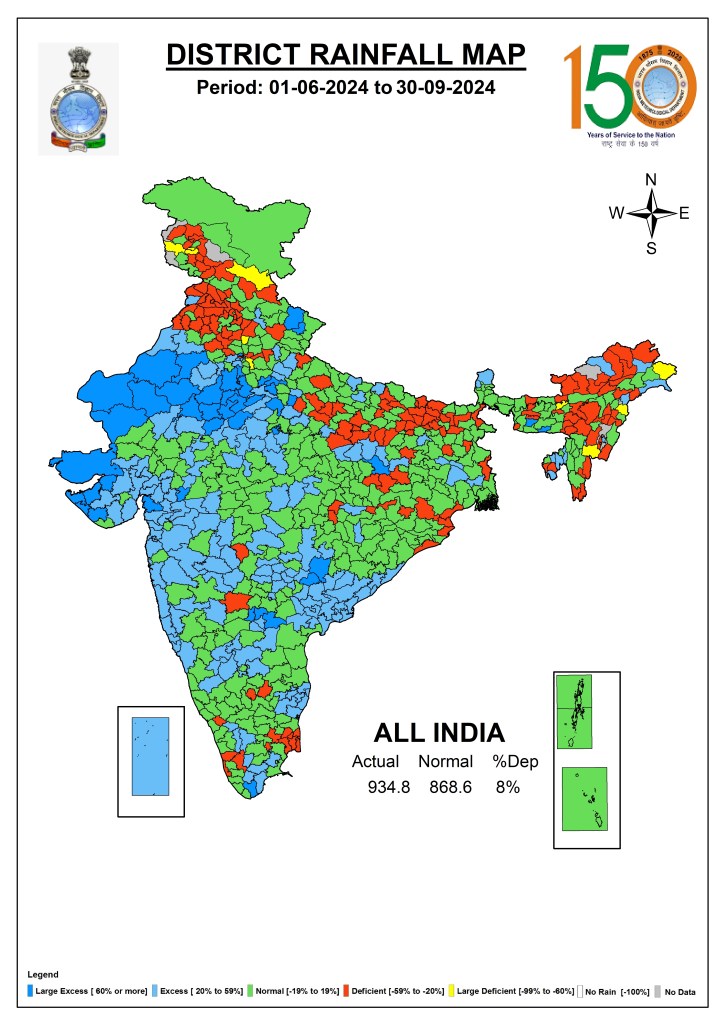
In the just concluded South West Monsoon 2024, India received 934.8 mm (820 mm in SW Monsoon 2023, 925 mm in SW Monsoon 2022[i]) rainfall, about 107.6% (94.45 % in 2023, 106.5% in 2022) of the Normal SW Monsoon rainfall of 868.6 mm as per India Meteorological Department (IMD). This rainfall is categorised as above normal rainfall.
In SW Monsoon 2021, the rainfall was 874.6 mm, 0.68% below normal rainfall. In SW Monsoon 2020, the rainfall was 956.7 mm, or about 8.74% above normal and in SW Monsoon 2019 it was 10.4% above normal. The district wise, state wise rainfall figures for June 2024[ii] (June 2023,[iii] June 2022), June-July 2024[iv], (June-July 2023[v] June-July 2022) and June-Aug 2024[vi] (June-Aug 2023,[vii] June-Aug 2022) are given in separate articles with maps.
Monthly Rainfall The Month wise rainfall during the SW Monsoon 2024 was as follows.
| Month | Actual Rainfall, mm | Normal Rainfall, mm | % Departure |
| June | 147.2 | 165.4 | 89 |
| July | 305.8 | 280.5 | 109 |
| Aug | 293.9 | 254.9 | 115 |
| Sept | 187.3 | 167.9 | 112 |
| SW Monsoon 2024 | 934.8 | 868.6 | 107.6 |
It is interesting to note here that June rainfall has been below normal in 2022 and 2023 too. Similarly July and Sept rainfall has been above normal in 2022, 2023 and 2024.
As we can see from the table above, the rainfall varied widely across the four monsoon months ranging from over 11% below normal in Jun to 15% above normal in Aug. There has been similar variation spatially and within the monsoon months, but we do not have an index of rainfall distribution over time and sptially that captures these variations. What we need is a more detailed, nuanced index of rainfall that will not only capture the quantum of rainfall as it does today, but also the temporal and spatial distribution of rainfall across the monsoon and across the nation. This will give a better picture of the monsoon rainfall and would also help us understand how this index is changing.
Forecast Vs Actual IMD Press Release of Oct 1 2024[viii] said: “The forecast for the rainfall over the country as whole during the season as a whole was correct as the realized rainfall is 108% of LPA against the forecast of 106% ± 4%.” For June 2024, IMD had forecast Normal rainfall, that is 92-108% of Normal, but actual rainfall was 89% of normal, thus forecast turned out to be an over estimate. Similarly, for August 2024, IMD forecast was 94-106% of normal, but actual rainfall was 115%. Thus forecast was an under estimate.
Region wise rainfall IMD divides India into four regions and reports rainfall for each of the region as follows. It also provides rainfall for what it calls “Monsoon Core Zone” that includes most of the rainfed areas of India.
| Region | Actual Rainfall, mm | Normal Rainfall, mm | % departure |
| North West India | 628.6 | 587.6 | 107 |
| Central India | 1168.5 | 978 | 119 |
| E + NE India | 1178.7 | 1367.3 | 86 |
| South India | 815.4 | 716.2 | 114 |
| Monsoon Core Zone | 1017.1 | 832.2 | 122 |
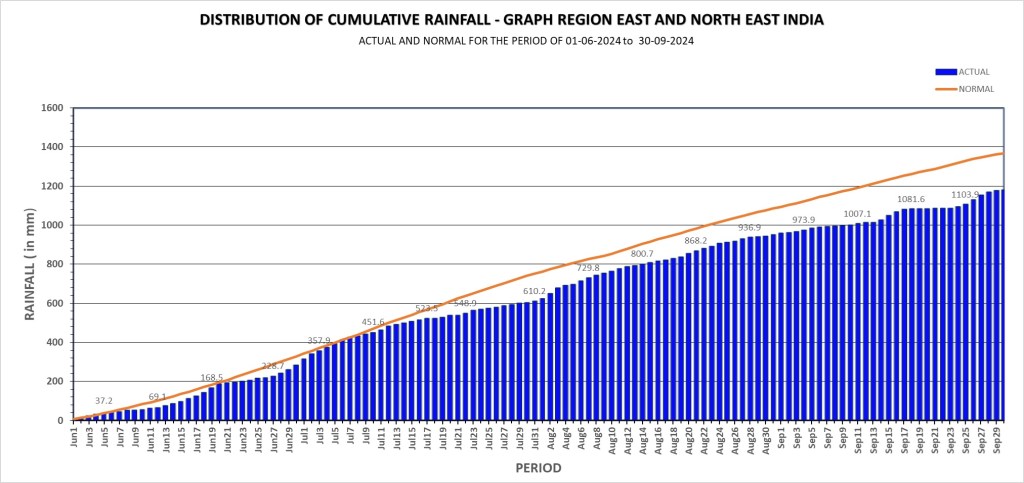
Region wise rainfall graphs The first bar chart below is for the National Rainfall figure till Sep 30 2024.

The IMD divides the country into four regions. As can be seen from the following graph, the East and North East India had 14% below normal for SW Monsoon 2024 (18% below normal in SW Monsoon 2023).
The North West India ended the SW Monsoon 2023 with just 7% surplus (1% surplus in 2023).

The Central India ended the SW Monsoon 2023 with 19% above normal rainfall (0% surplus or deficit in 2023).

The South Peninsular India had surplus rainfall at 14% at the end of SW Monsoon 2024 (8% deficit in 2023).


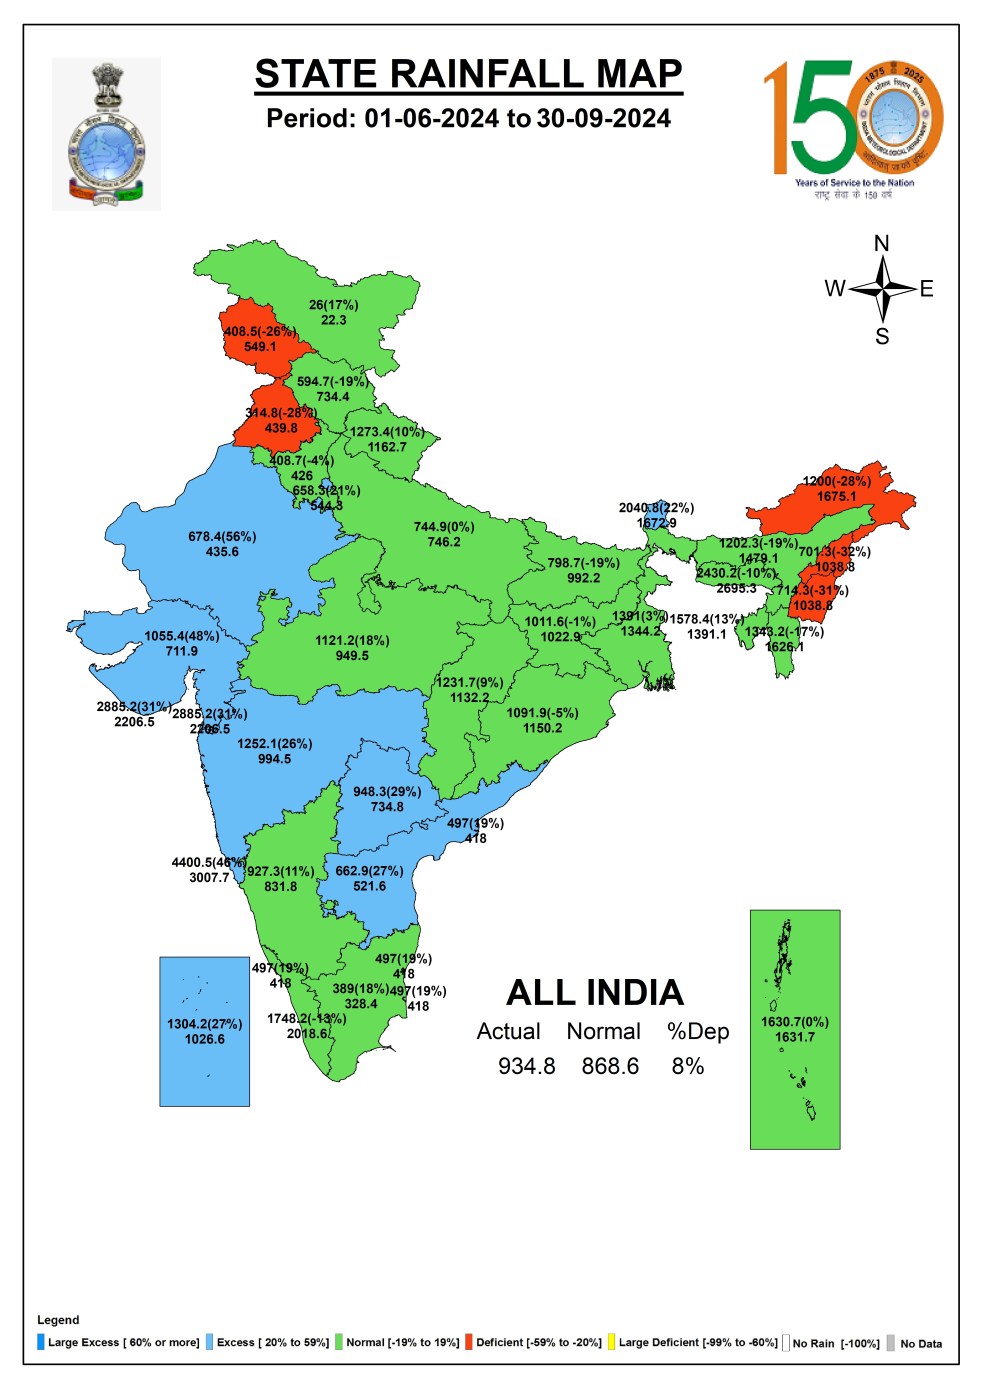
State wise Rainfall As we can see from the IMD map above, in the four month long South West Monsoon 2024, out of 36 States and Union Territories (UTs), None had Large Excess, Nine had Excess (Actual rainfall 20-59% above normal), 22 had normal (Actual rainfall 19% below normal to 19% above normal), Five had deficit (Actual rainfall 20-59% below normal rainfall) and none had Large Deficit (Actual rainfall over 60% below normal) in rainfall. Ladakh had the lowest rainfall (like in 2022 and 2023) at 26 mm. Goa had the highest rainfall (like in 2022 & 2023) at 4400 mm.
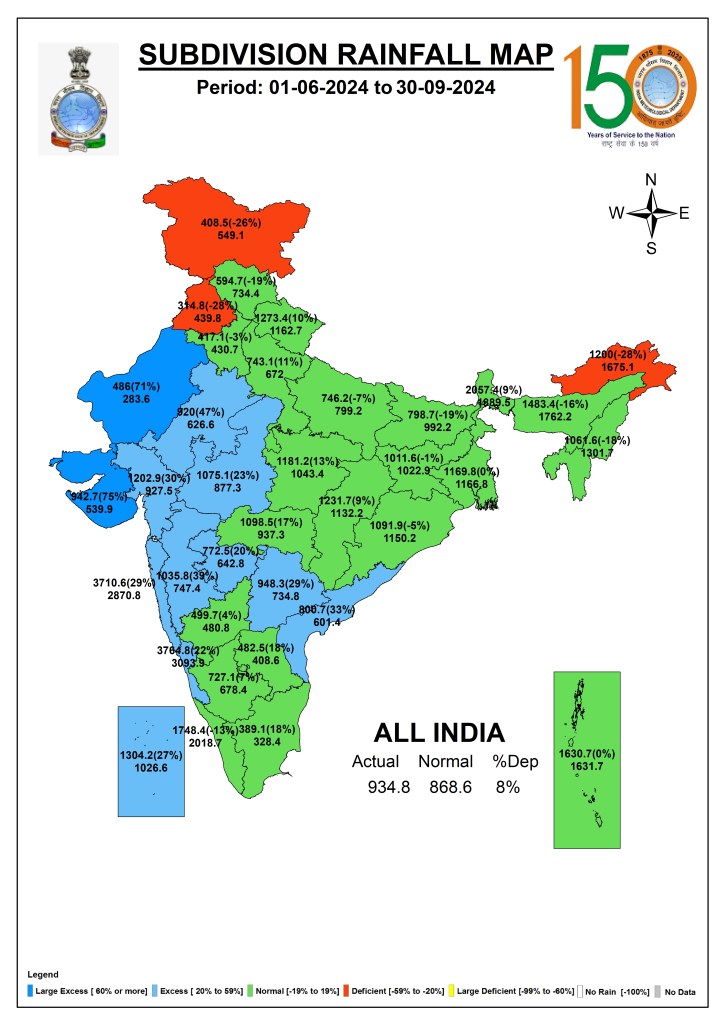
Sub Division wise rainfall IMD divides India into 36 meteorological divisions (the logic of many of them is questionable). As we can see from the IMD map of Sub Division wise rainfall above of SW Monsoon 2024, 2 sub divisions (Saurashtra-Kutch, W Rajasthan) had Large Excess rainfall, Ten sub divisions had excess rainfall, 21 had Normal rainfall and 3 had deficit rainfall. Coastal Karnataka had the highest rainfall at 3764.8 mm and Punjab had the lowest at 314.8 mm rainfall. Kutch-Saurashtra had the highest surplus rainfall % at 75%. Arunachal Pradesh and Punjab had the highest deficit rainfall % at 28%.
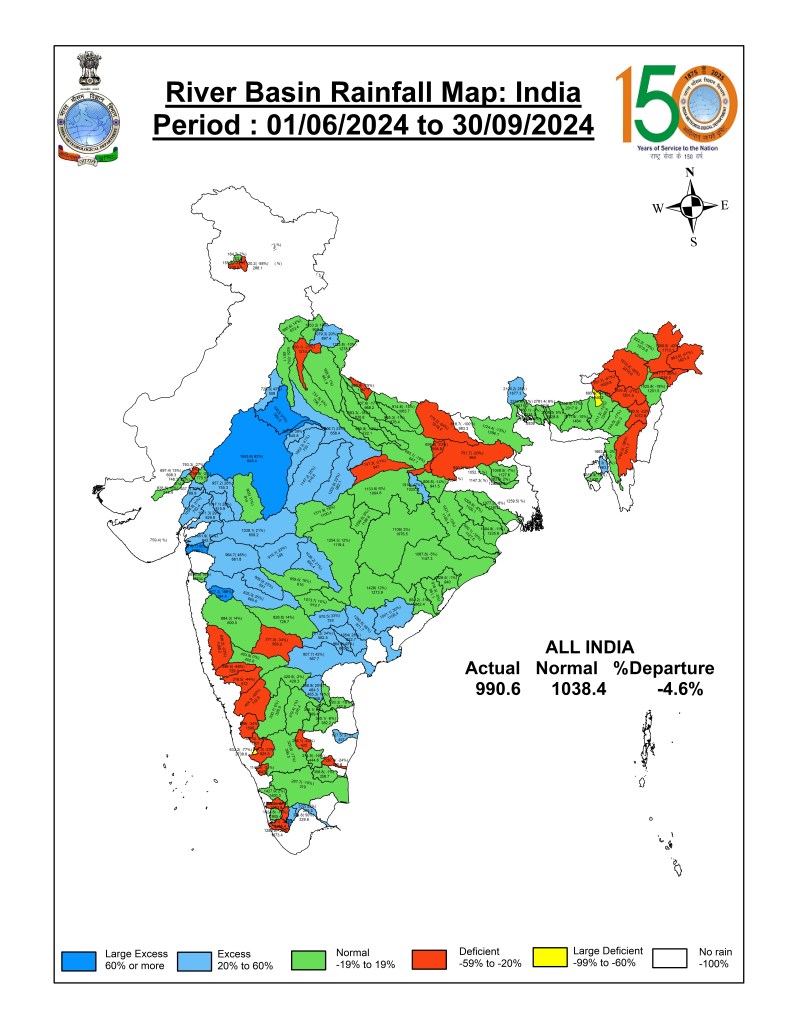
River Basin wise Rainfall As we can see from the IMD’s river basin wise rainfall map above, IMD also reports river basin wise rainfall. However, as we have been noting in the past, this reporting remains rather callous and inadequate, unfortunately, though IMD would know that it is much more important to provide accurate figures of river basin wise and sub basin wise rainfall figures. This is clear from the map, where was can see that IMD reports NO DATA in whole of the four month long monsoon 2024 for large number of river basins.
All India District wise rainfall departure map The map below provides district wise picture of rainfall at all India level.
DISTRICT WISE STATE WISE RAINFALL: ISLAND: Andaman & Nicobar

Lakshadweep

NORTH INDIA: Jammu & Kashmiar

Ladakh

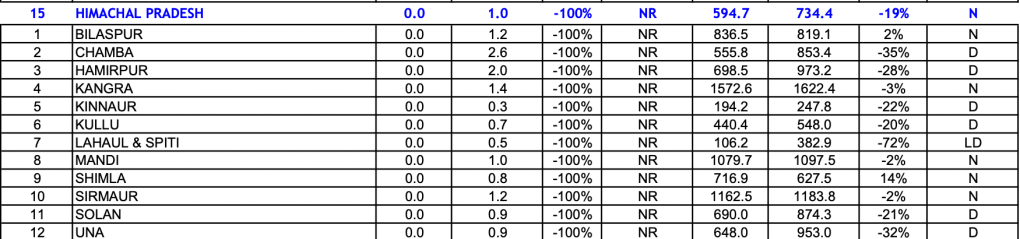
Himachal Pradesh
Uttarakhand

Punjab

Chandigarh

Haryana

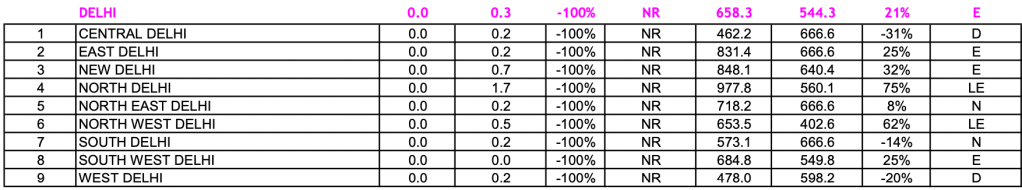
Delhi
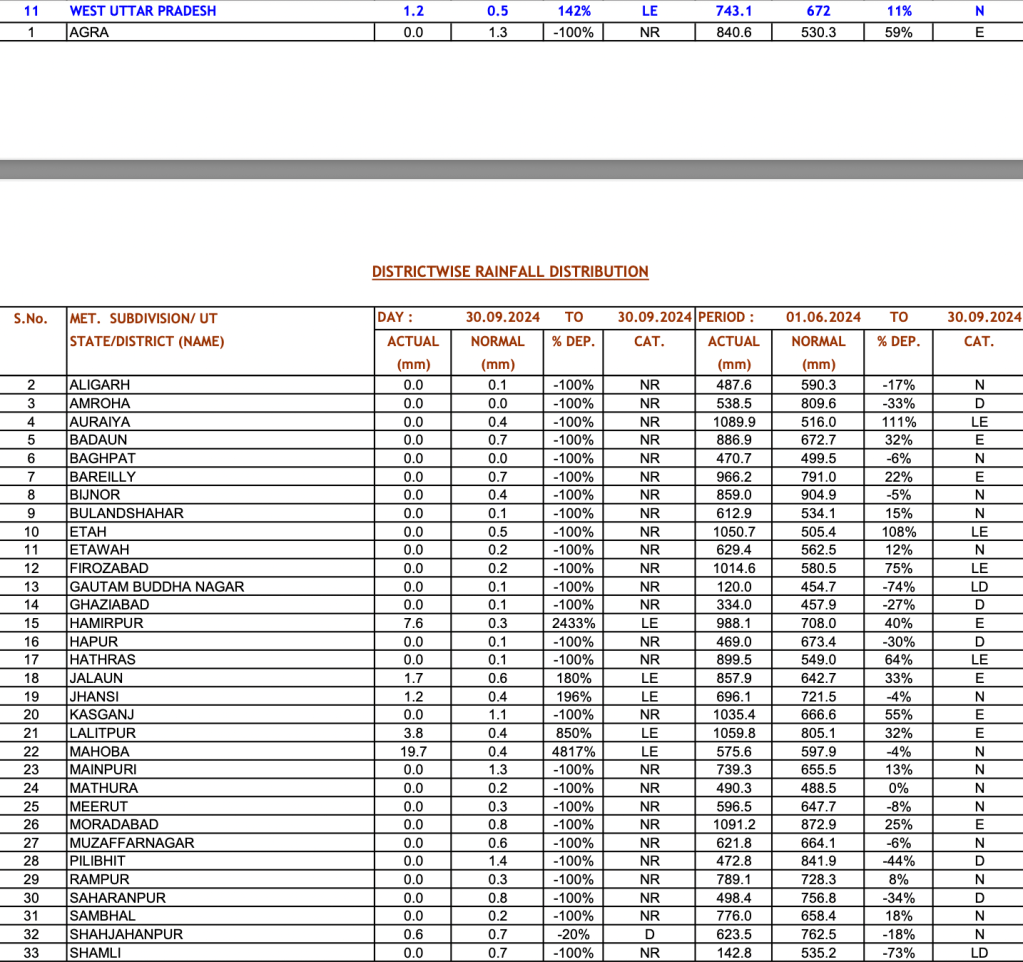
EAST INDIA: Uttar Pradesh

Bihar

W Bengal

Jharkhand

Odisha

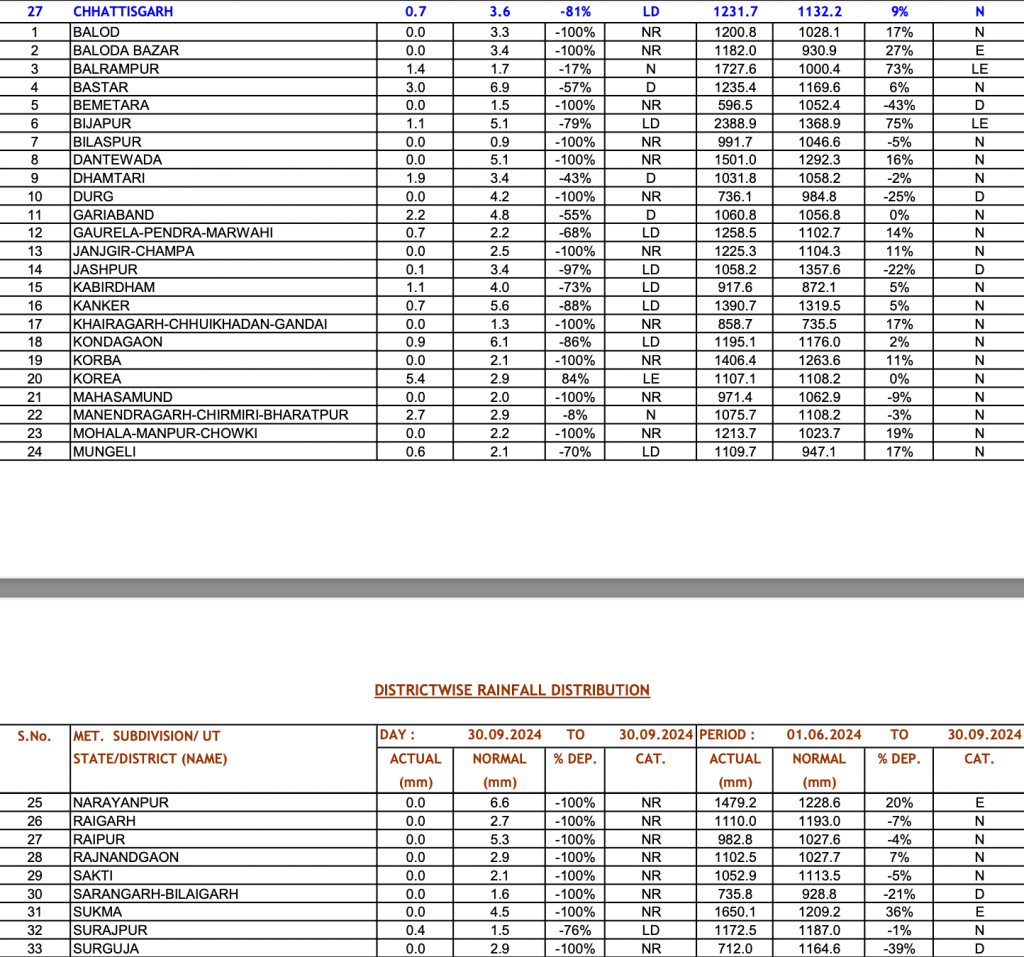
Chhattisgarh
NORTH EAST INDIA: Sikkim

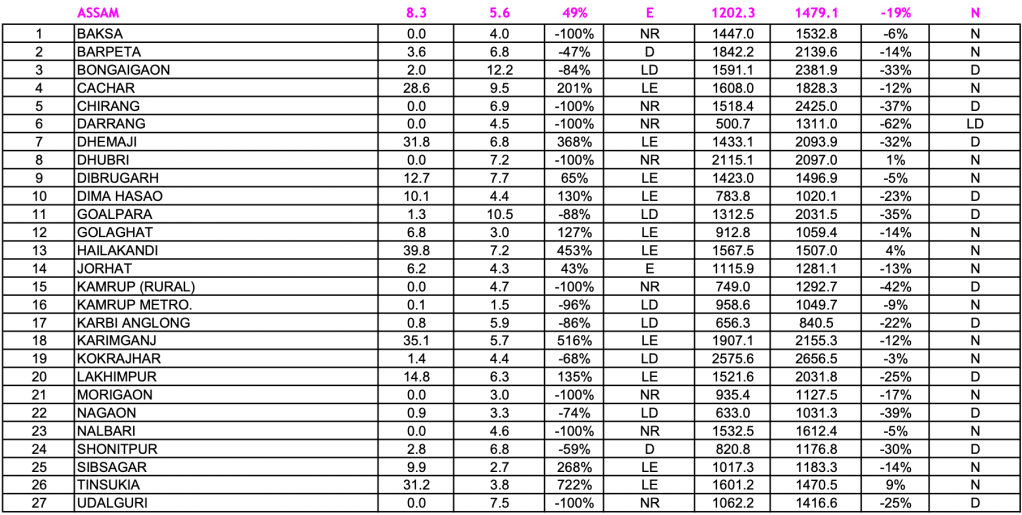
Assam
Arunachal Pradesh

Meghalaya

Manipur

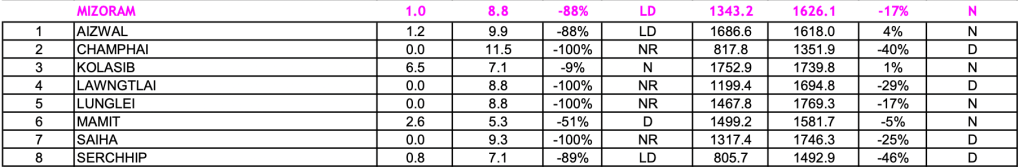
Mizoram
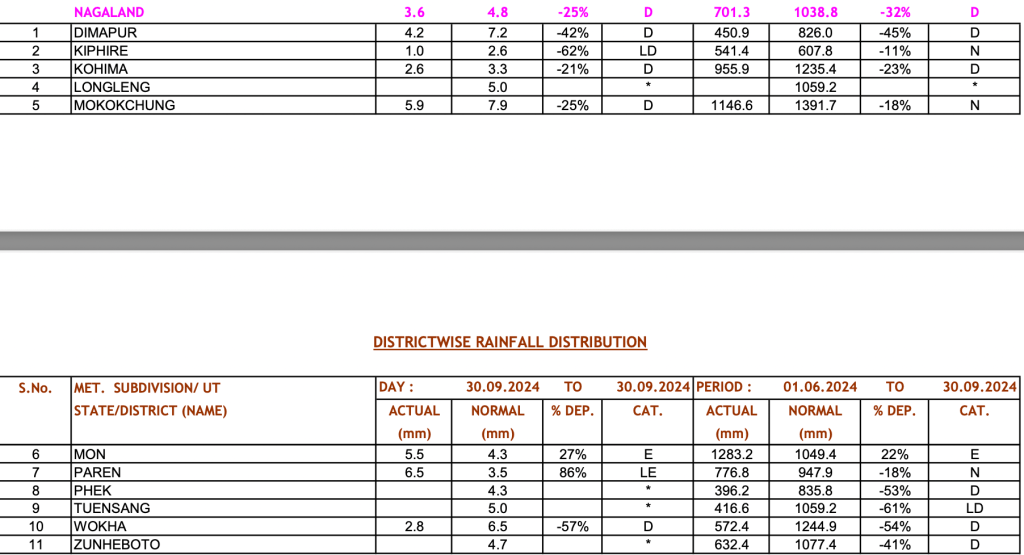
Nagaland
Tripura

SOUTH INDIA: Andhra Pradesh

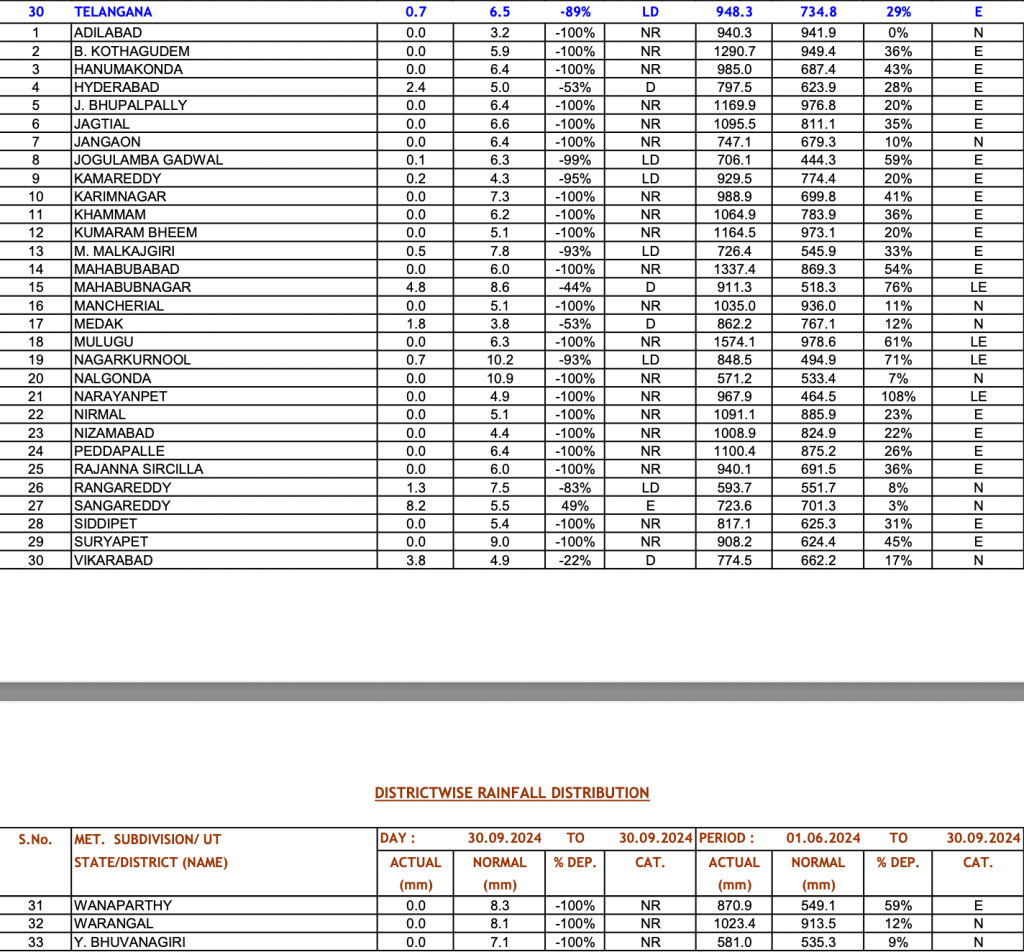
Telangana
Karnataka

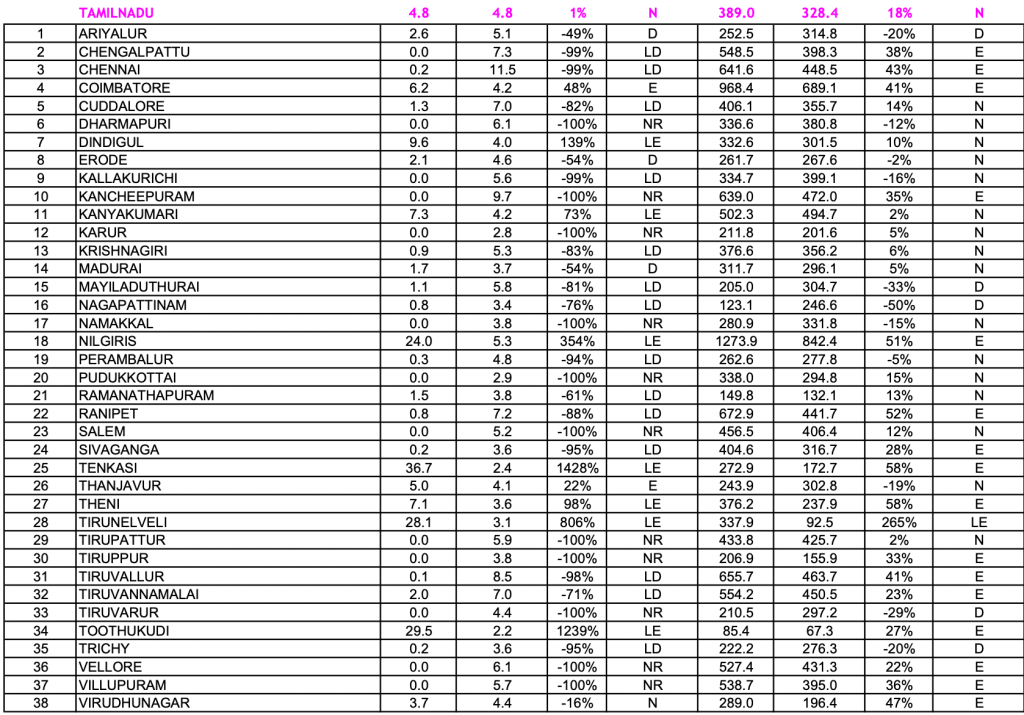
Tamil Nadu
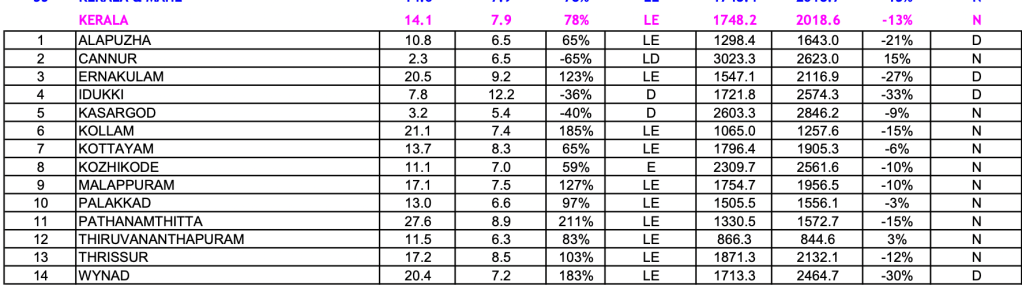
Kerala
Puducherry

WEST INDIA: Goa

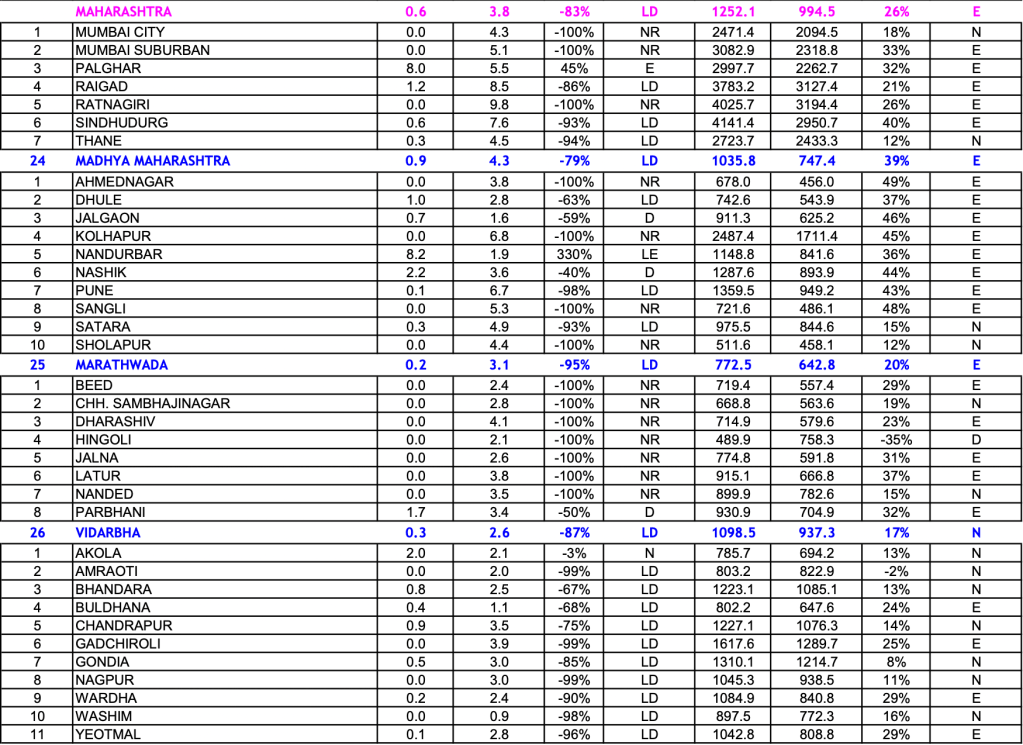
Maharashtra
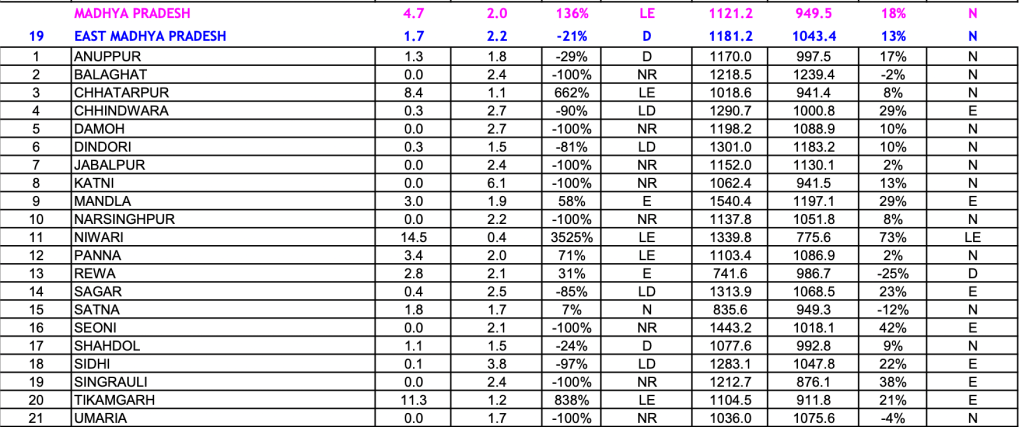
Madhya Pradesh

Gujarat

Rajasthan

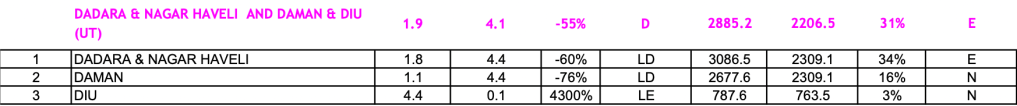
Diu, Daman, Dadar & Nagarhaveli
SANDRP (ht.sandrp@gmail.com)
Relevant Links:
[i] https://sandrp.in/2022/10/01/sw-monsoon-2022-district-wise-rainfall-in-india/
[ii] https://sandrp.in/2024/07/03/june-2024-district-wise-rainfall-in-indias-sw-monsoon/
[iii] https://sandrp.in/2023/07/07/june-2023-district-wise-rainfall-in-indias-sw-monsoon/
[iv] https://sandrp.in/2024/08/07/june-july-2024-district-wise-rainfall-in-indias-sw-monsoon/
[v] https://sandrp.in/2023/08/04/june-july-2023-district-wise-rainfall-in-in-indias-sw-monsoon/
[vi] https://sandrp.in/2024/09/03/june-aug-2024-district-wise-rainfall-in-in-indias-sw-monsoon/
[vii] https://sandrp.in/2023/09/01/june-aug-2023-district-wise-rainfall-in-in-indias-sw-monsoon/
[viii] https://internal.imd.gov.in/press_release/20241001_pr_3310.pdf
