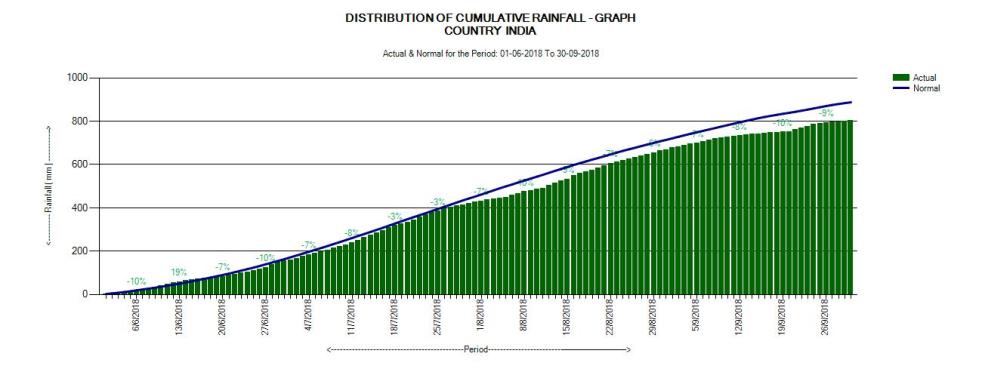
2018 becomes fifth year in a row when India’s south west monsoon has been below normal. In the beginning of monsoon season, Indian Meteorological Department (IMD) has forecasted rains to be normal with rainfall equal to 97 percent of the long term average. However at the end of the season the overall rainfall turned out to be 91 percent, with deficit of 9 percent at national level. However, as we see in this overview, the situation as move from national to local figures, is much different, mostly much worse.
According to IMD’s State Rainfall Map (cumulative) dated 30 Sept. 2018, the country received 804.0 mm rains against 887.5 mm of normal average. Thus the south west monsoon 2018 had 9.4 percent below normal rainfall.
According to map, 8 states and Union Territory (UT) Lakshadweep have received deficit rains. Interestingly 7 of these rain deficit States/ UTs are from East and North East India. If Assam with -18 deficit is also included in the list, it may be concluded that the East and North East region suffered worst deficit of rain in 2018 monsoon season.
The map also shows that Gujarat is the only state from western India which has fell short of Normal Monsoon category. 26 States plus UTs have received normal rainfall while with 23% surplus rain, Kerala is the only state in excess rain category.

Details of States With Deficit Monsoon In 2018 (Source: IMD)
| SN | States | Actual (mm) | Normal (mm) | Departure % |
| 1 | Manipur | 644.1 | 1404.5 | -54 |
| 2 | Lakshadweep | 553.2 | 998.5 | -45 |
| 3 | Meghalaya | 1652.6 | 2786.8 | -40 |
| 4 | Arunachal Pradesh | 1198.4 | 1768.0 | -32 |
| 5 | Jharkhand | 784.3 | 1091.9 | -28 |
| 6 | Bihar | 770.8 | 1027.6 | -25 |
| 7 | Gujarat | 484.6 | 672.7 | -22 |
| 8 | Tripura | 1165.1 | 1489.1 | -22 |
| 9 | West Bengal | 1102.0 | 1390.4 | -21 |
| 10 | Assam | 1242.4 | 1523.4 | -18 |
However, IMD’s Sub-Divisional Rainfall Map (cumulative) for 2018, presents a different pictures. 23 sub-divisions have received normal rainfall, while 12 sub-divisions suffered rain deficit. The Map shows significant shortfall in monsoon rains in Rayalseema, Western Rajasthan, North Interior Karnataka and Marathwada sub-division.

List of Sub-Division With Deficit Monsoon In 2018 (Source: IMD)
| SN | Subdivision | Actual (mm) | Normal (mm) | Departure % |
| 1 | Lakshadweep | 553.2 | 998.5 | -45 |
| 2 | Rayalseema | 252.6 | 398.3 | -37 |
| 3 | Saurashtra & Kutch | 316.0 | 477.5 | -34 |
| 4 | Arunchal Pradesh | 1198.4 | 1768.0 | -32 |
| 5 | NI Karnataka | 328.0 | 506.0 | -29 |
| 6 | Jharkhand | 783.3 | 1091.9 | -28 |
| 7 | Assam & Meghalaya | 1322.9 | 1792.8 | -26 |
| 8 | Bihar | 770.8 | 1027.6 | -25 |
| 9 | Gujarat Region | 696.1 | 914.7 | -24 |
| 10 | Marthawada | 534.6 | 682.9 | -22 |
| 11 | Western Rajasthan | 201.7 | 263.2 | -23 |
| 12 | Gangetic West Bengal | 936.8 | 1167.9 | -20 |
Region Wise Monsoon 2018 Distribution (cumulative) Source: IMD
Monsoon 2018 District Wise Rainfall Departure Map Source: IMD
State Wise Monsoon Rainfall Situation
NORTH INDIA
JAMMU & KASHMIR

Jammu & Kashmir districts with significant excess and deficit rains (Source: IMD)
| Period: 01-06-2018 To 30-09-2018 | |||||
| SN | State | Actual (mm) | Normal(mm) | Departure(%) | Category |
| JAMMU & KASHMIR | 597.3 | 534.6 | 12% | N | |
| 1 | BANDIPORE | 471.0 | 168.6 | 179% | LE |
| 2 | DODA | 528.6 | 441.4 | 20% | E |
| 3 | GANDERWAL | 236.8 | 184.3 | 28% | E |
| 4 | JAMMU | 1286.2 | 860.5 | 49% | E |
| 5 | KARGIL | 18.9 | 49.7 | -62% | LD |
| 6 | KATHUA | 1184.0 | 982.0 | 21% | E |
| 7 | KULGAM | 420.0 | 268.9 | 56% | E |
| 8 | LEH & LADAKH | 70.8 | 39.6 | 79% | LE |
| 9 | PULWAMA | 221.4 | 151.4 | 46% | E |
| 10 | RAJOURI | 493.4 | 649.5 | -24% | D |
| 11 | RAMBAN | 491.2 | 400.6 | 23% | E |
| 12 | SRINAGAR | 251.5 | 184.3 | 36% | E |
| 13 | UDHAMPUR | 938.4 | 1377.2 | -32% | D |
With 12% above normal rains, J&K experienced normal monsoon. However, out of 22 districts 8 has received over 20% excess rainfall. In addition to this Leh & Ladhakh (79%) and Bandipore (179%) districts have received large surplus rains. 2 districts are rain deficit with Kargil recording large deficit by -62%.
HIMACHAL PRADESH

Himachal Pradesh received 917.3 mm rainfall during South West Monsoon 2018, 11 percent over normal rainfall of 825.3 mm. At district level there is considerable variation in the distribution of rainfall. Out of 12 districts in the state, rainfall has been in deficit in three districts namely Chamba, Kinnaur and Lahul & Spiti by 38 percent, 32 percent and 43 per cent respectively. All these three districts are in upper part of Himalaya, the origin of many rivers & where mountains are mostly snow covered. For more details on this, kindly see Himachal Pradesh Monsoon 2018: Overview.
UTTRAKHAND

Uttarakhand received 3% below normal rainfall during South West Monsoon 2018. District level rainfall data paints a very different picture. Out of total 13 districts in the Himalayan state, four districts namely Almora, Pauri Garhwal, Tehri Garhwal and Udham Singh Nagar have received deficit rains, whereas three districts which includes Bageshwar, Chamoli and Haridwar have got above average rainfall. For more detail kindly see, Uttarakhand Monsoon 2018 Overview: Rainfall Normal, Distribution Abnormal.
PUNJAB

Punjab districts with significant excess and deficit rains (Source: IMD)
|
Period: 01-06-2018 To 30-09-2018 |
|||||
| SN | State | Actual
(mm) |
Normal
(mm) |
Dep.
(%) |
Cat. |
| PUNJAB | 527.4 | 497.9 | 7% | N | |
| 1 | BATHINDA | 209.1 | 321.0 | -35% | D |
| 2 | FIROZPUR | 91.8 | 352.3 | -74% | LD |
| 3 | GURDASPUR | 1144.3 | 827.8 | 38% | E |
| 4 | KAPURTHALA | 562.9 | 422.6 | 33% | E |
| 5 | LUDHIANA | 685.6 | 534.2 | 28% | E |
| 6 | MANSA | 142.0 | 334.8 | -58% | D |
| 7 | MOGA | 281.5 | 354.0 | -20% | D |
| 8 | NAWASHAHR | 1027.9 | 788.6 | 30% | E |
| 9 | PATIALA | 742.2 | 615.2 | 21% | E |
| 10 | RUPNAGAR | 1246.7 | 728.5 | 71% | LE |
| 11 | SAS NAGAR | 805.4 | 644.5 | 25% | E |
| 12 | TARN TARAN | 510.5 | 336.8 | 52% | E |
Punjab at state level had normal rainfall, with 7% above normal precipitation. Out of 22 districts 7 have received excess rain excluding Rupnagar in east which has recorded rainfall large excess by 71%. While, rainfall has been normal in 8 districts. There 3 districts with deficit monsoon apart from Firozpur in west registering large deficit of -74%.
HARYANA

Haryana districts with significant excess and deficit rains (Source: IMD)
| Period: 01-06-2018 To 30-09-2018 | |||||
| SN | State | Actual
(mm) |
Normal
(mm) |
Dep.
(%) |
Cat. |
| HARYANA | 514.2 | 455.8 | 10% | N | |
| 1 | AMBALA | 704.4 | 916.6 | -23% | D |
| 2 | HISAR | 213.7 | 325.1 | -34% | D |
| 3 | KAITHAL | 475.1 | 384.0 | 24% | E |
| 4 | KARNAL | 828.0 | 577.0 | 44% | E |
| 5 | PALWAL | 349.9 | 446.9 | -22% | D |
| 6 | PANCHKULA | 526.9 | 950.4 | -45% | D |
| 7 | PANIPAT | 392.5 | 521.7 | -25% | D |
| 8 | ROHTAK | 306.9 | 508.0 | -40% | D |
| 9 | SONIPAT | 378.3 | 534.3 | -29% | D |
| 10 | FATEHABAD | 157.1 | 283.0 | -45% | D |
With 10 % excess rain, Haryana rains falls in normal category, however out of 21 districts 8 are in deficit category whereas only two districts of Karnal and Kaithal have recorded excess rainfall.
UTTAR PRADESH

Uttar Pradesh District Wise Rainfall Distribution 2018 (Source: IMD)
|
Period: 01-06-2018 To 30-09-2018 |
|||||
| SN | State | Actual
(mm) |
Normal
(mm) |
Dep.
(%) |
Cat. |
| UTTAR PRADESH | 764.5 | 846.1 | -10% | N | |
| 1 | ALLAHABAD | 650.6 | 808.7 | -20% | D |
| 2 | AZAMGARH | 507.6 | 952.7 | -47% | D |
| 3 | BAHRAICH | 1235.7 | 993.8 | 24% | E |
| 4 | BALLIA | 429.0 | 827.2 | -48% | D |
| 5 | BALRAMPUR | 707.6 | 1071.7 | -34% | D |
| 6 | BARABANKI | 1231.7 | 930.5 | 32% | E |
| 7 | BASTI | 636.7 | 943.6 | -33% | D |
| 8 | CHANDAULI | 447.0 | 846.1 | -47% | D |
| 9 | DEORIA | 441.4 | 950.9 | -54% | D |
| 10 | FAIZABAD | 733.9 | 989.7 | -26% | D |
| 11 | FATEHPUR | 470.7 | 812.5 | -42% | D |
| 12 | GAZIPUR | 688.1 | 883.0 | -22% | D |
| 13 | GONDA | 648.8 | 1027.2 | -37% | D |
| 14 | GORAKHPUR | 845.3 | 1175.5 | -28% | D |
| 15 | HARDOI | 606.4 | 787.9 | -23% | D |
| 16 | JAUNPUR | 501.7 | 874.1 | -43% | D |
| 17 | KANNAUJ | 1260.7 | 776.7 | 62% | LE |
| 18 | KANPUR DEHAT | 399.8 | 765.0 | -48% | D |
| 19 | KAUSHAMBI | 489.5 | 765.6 | -36% | D |
| 20 | KHERI | 1175.7 | 926.1 | 27% | E |
| 21 | KUSHINAGAR | 207.6 | 1158.4 | -82% | LD |
| 22 | LACKNOW | 959.5 | 772.5 | 24% | E |
| 23 | MAHARAJGANJ | 653.8 | 1214.1 | -46% | D |
| 24 | MAU | 362.3 | 1004.7 | -64% | LD |
| 25 | MIRZAPUR | 1099.8 | 901.1 | 22% | E |
| 26 | RAIBEARELI | 536.8 | 750.3 | -28% | D |
| 27 | SANT KABIR NAGAR | 525.5 | 990.7 | -47% | D |
| 28 | SANT RAVIDAS NAGAR | 1262.0 | 846.1 | 49% | E |
| 29 | SIDDHARTHNAGAR | 804.9 | 1009.9 | -20% | D |
| 30 | VARANASI | 679.9 | 923.5 | -26% | D |
| 31 | AURAIYA | 550.1 | 700.0 | -21% | D |
| 32 | BAGHPAT | 734.6 | 545.3 | 35% | E |
| 33 | BAREILLY | 1256.5 | 853.8 | 47% | E |
| 34 | BIJNOR | 1111.7 | 914.2 | 22% | E |
| 35 | BULANDSAHAR | 455.9 | 670.7 | -32% | D |
| 36 | ETAH | 877.1 | 615.3 | 43% | E |
| 37 | GAUTAMBUDHNAGAR | 754.0 | 572.8 | 32% | E |
| 38 | GHAZIABAD | 396.2 | 641.7 | -38% | D |
| 39 | JALAUN | 600.4 | 774.9 | -23% | D |
| 40 | JYOTIBAPHULE NAGAR | 637.5 | 783.0 | -19% | N |
| 41 | KANSHIRAMNAGAR | 899.9 | 701.5 | 28% | E |
| 42 | MAHOBA | 340.4 | 776.4 | -56% | D |
| 43 | MATHURA | 789.7 | 579.9 | 36% | E |
| 44 | MORADABAD | 1081.6 | 855.2 | 26% | E |
| 45 | PILHIBHIT | 733.1 | 988.6 | -26% | D |
| 46 | RAMPUR | 604.7 | 915.5 | -34% | D |
| 47 | SHARANPUR | 977.2 | 804.6 | 21% | E |
Uttar Pradesh has received 10% below normal rainfall. Out of 75 districts, South west monsoon 2018 has left 30 rain deficit. The shortfall is as wide as more than 40% in 10 districts in addition to Mau and Kushinagar recording large deficits of -64% and -82% respectively. 16 districts have been rain surplus and only one district of Kannuaj has received rainfall in large excess, of 62%.
Also see, Bundelkhand: Overview of Monsoon 2018
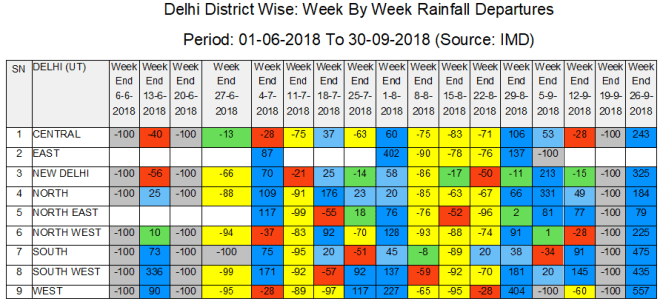
DELHI

Delhi District Wise Rainfall Distribution 2018 (Source: IMD)
|
Period: 01-06-2018 To 30-09-2018 |
|||||
| SN | State | Actual
(mm) |
Normal
(mm) |
Dep.
(%) |
Cat. |
| DELHI | 630.4 | 636.2 | -1% | N | |
| 1 | CENTRAL | 518.0 | 636.2 | -19% | N |
| 2 | EAST | 450.2 | 636.2 | -29% | D |
| 3 | NORTH | 779.1 | 636.2 | 22% | E |
| 4 | NORTH EAST | 498.5 | 636.2 | -22% | D |
| 5 | NORTH WEST | 516.3 | 636.2 | -19% | N |
| 6 | SOUTH WEST | 760.4 | 636.2 | 20% | E |
With 1% below normal rainfall deficit, Delhi had normal monsoon. As per the week by week data, out of 17 monsoon weeks, most rainfall occurred in just 7 weeks and there were 5 weeks with no or very little rains.
NORTH EAST INDIA
ARUNACHAL PRADESH

Arunachal Pradesh District Wise Rainfall Distribution 2018 (Source: IMD)
|
Period: 01-06-2018 To 30-09-2018 |
|||||
| SN | State | Actual
(mm) |
Normal
(mm) |
Dep.
(%) |
Cat. |
| ARUNACHAL PRADESH | 1198.4 | 1768.0 | -32% | D | |
| 1 | CHANGLANG | 770.6 | 1632.1 | -53% | D |
| 2 | EAST KAMENG | 620.4 | 1246.3 | -50% | D |
| 3 | EAST SIANG | 2172.1 | 3008.4 | -28% | D |
| 4 | LOHIT | 1188.4 | 1848.5 | -36% | D |
| 5 | LOWER DIBANG VALLEY | 2286.4 | 1073.4 | 113% | LE |
| 6 | TAWANG | 1016.2 | 2485.2 | -59% | D |
| 7 | TIRAP | 782.7 | 2385.5 | -67% | LD |
| 8 | UPPER SIANG | 856.8 | 2558.8 | -67% | LD |
| 9 | WEST KAMENG | 1330.2 | 2485.2 | -46% | D |
| 10 | WEST SIANG | 1213.7 | 1612.5 | -25% | D |
| 11 | DIBANG VALLEY | 1073.4 | ND | ||
| 12 | SUBANSIRI | 996.2 | ND | ||
| 13 | ANJAW | 1848.5 | ND | ||
Arunachal Pradesh state has registered rainfall deficit of 32%. Out of 20 districts in the state, 9 have recorded significant shortfall in monsoon rain including Tirap and Upper Siang district which has recorded large deficit by -67% each. Interestingly, Lower Dibang Valley is only district which has registered large excess rainfall, with 113% above normal rains. Shockingly, in three districts, IMD has no rainfall data (ND).
ASSAM

Assam District Wise Rainfall Distribution 2018 (Source: IMD)
|
Period: 01-06-2018 To 30-09-2018 |
|||||
| SN | State | Actual (mm) | Normal
(mm) |
Dep.
(%) |
Cat. |
| ASSAM | 1242.4 | 1523.4 | -18% | N | |
| 1 | BAKSA | 1404.8 | 2441.0 | -42% | D |
| 2 | CHIRANG | 3030.9 | 2296.1 | 32% | E |
| 3 | DHUBRI | 1143.6 | 1916.5 | -40% | D |
| 4 | GOALPARA | 1165.9 | 1710.1 | -32% | D |
| 5 | HAILAKANDI | 1231.5 | 1621.1 | -24% | D |
| 6 | KAMRUP METRO | 812.8 | 1147.7 | -29% | D |
| 7 | KAMRUP RURAL | 846.5 | 1147.7 | -26% | D |
| 8 | MORIGAON | 788.1 | 1215.5 | -35% | D |
| 9 | N.C HILLS | 751.9 | 988.8 | -24% | D |
| 10 | NAGAON | 744.3 | 1124.9 | -34% | D |
| 11 | NALBARI | 1203.2 | 1564.3 | -23% | D |
| 12 | TINSUKIA | 1176.6 | 1617.8 | -27% | D |
| 13 | UDALGURI | 1520.8 | 1259.1 | 21% | E |
| 14 | DARRANG | 1259.1 | ND | ||
| 15 | DHEMAJI | 2025.2 | ND | ||
Assam has received 18% below normal rains. 11 districts have recorded deficit rainfall. Out of 27 districts only two Udalguri and Chirang have registered excess rains in monsoon 2018. IMD has no rainfall data for two districts in the state.
MEGHALAYA

Meghalaya District Wise Rainfall Distribution 2018 (Source: IMD)
|
Period: 01-06-2018 To 30-09-2018 |
|||||
| SN | State | Actual (mm) | Normal
(mm) |
Dep.
(%) |
Cat. |
| MEGHALAYA | 1652.6 | 2786.8 | -45% | D | |
| 1 | EAST KHASI HILLS | 3593.3 | 4621.8 | -22% | D |
| 2 | RI BHOI | 855.7 | 1479.5 | -42% | D |
| 3 | WEST GARO HILLS | 1013.6 | 1681.5 | -40% | D |
| 4 | WEST KHASI HILLS | 1496.9 | 2775.0 | -46% | D |
| 5 | JANTIA HILLS | 4667.5 | ND | ||
Meghalaya received 45% below normal rains. Out of 7 districts 4 have recorded significant shortfall in rain while for Jantia Hills IMD has no data.
NAGALAND
Nagaland District Wise Rainfall Distribution 2018 (Source: IMD)
|
Period: 01-06-2018 To 30-09-2018 |
|||||
| SN | State | Actual (mm) | Normal
(mm) |
Departure
(%) |
Category |
| NAGALAND | 1161.7 | 1329.9 | -13% | N | |
| 1 | DIMAPUR | 1156.3 | 815.3 | 42% | E |
| 2 | LONGLENG | 1078.0 | 1386.1 | -22% | D |
| 3 | MON | 1229.8 | 823.9 | 49% | E |
| 4 | PHEK | 871.3 | 1308.0 | -33% | D |
| 5 | TUENSANG | 945.0 | 1386.1 | -32% | D |
| 6 | ZUNHEBOTO | 1014.0 | 1386.1 | -27% | D |
| 7 | KIPHIRE | 1386.1 | ND | ||
Nagaland has received 13% below normal rains. Out of 11 districts 4 are in deficit category, 2 are in excessive rainfall category whereas for one district (Kiphire) IMD has no data.
MANIPUR

Manipur District Wise Rainfall Distribution 2018 (Source: IMD)
|
Period: 01-06-2018 To 30-09-2018 |
|||||
| SN | State | Actual (mm) | Normal
(mm) |
Dep.
(%) |
Cat. |
| MANIPUR | 644.1 | 1404.5 | -54% | D | |
| 1 | BISHNUPUR | 1334.3 | ND | ||
| 2 | CHANDEL | 604.9 | 2007.1 | -70% | LD |
| 3 | CHURACHANDPUR | 1560.6 | ND | ||
| 4 | IMPHAL EAST | 737.1 | 1164.2 | -37% | D |
| 5 | IMPHAL WEST | 1246.2 | 971.8 | 28% | E |
| 6 | SENAPATI | 568.0 | 1281.0 | -56% | D |
| 7 | TAMENGLONG | 5228.0 | ND | ||
| 8 | THOUBAL | 833.6 | ND | ||
| 9 | UKHRUL | 1057.5 | ND | ||
Manipur state has recorded rainfall deficit of 54%, highest by any state in India. Out of 9 districts IMD has no data for 5 while 3 are in deficit category including Chandel which has a large defict of -70%. Imphal west is the only district in the state which is in excess rainfall category.
MIZOARAM

Mizoram District Wise Rainfall Distribution 2018 (Source: IMD)
|
Period: 01-06-2018 To 30-09-2018 |
|||||
| SN | States/ UTs | Actual (mm) | Normal
(mm) |
Dep.
(%) |
Cat. |
| MIZORAM | 1931.9 | 1708.3 | 13% | N | |
| 1 | AIZAWL | 1393.8 | 1788.0 | -22% | D |
| 2 | LUNGLEI | 2291.5 | 1866.3 | 23% | E |
| 3 | SERCHHIP | 2317.0 | 1650.4 | 40% | E |
| 4 | CHAMPHAI | 1352.5 | ND | ||
| 5 | CHHIMTUIPUI | 1788.0 | ND | ||
| 6 | LAWNGTLAI | 1705.7 | ND | ||
| 7 | MAMIT | 1788.0 | ND | ||
| 8 | SAIHA | 1622.6 | ND | ||
At state level Mizoram has received normal rainfall however for 5 out of 9 districts IMD has no data, 1 is deficit and 2 are in excess rainfall category.
TRIPURA

Tripura District Wise Rainfall Distribution 2018 (Source: IMD)
|
Period: 01-06-2018 To 30-09-2018 |
|||||
| SN | States/ UTs | Actual (mm) | Normal
(mm) |
Dep.
(%) |
Cat. |
| TRIPURA | 1165.1 | 1489.1 | -22% | D | |
| 1 | NORTH | 1177.3 | 1527.7 | -23% | D |
| 2 | SOUTH | 1310.8 | 1624.2 | -19% | N |
| 3 | WEST | 854.6 | 1396.3 | -39% | D |
Tripura, with 22% below normal rainfall, is in deficit rainfall category. 2 out of its 4 districts have recorded rainfall deficit of over 20%. In addition, South Tripura is also rainfall deficit by -19%.
SIKKIM

Sikkim state has received 2150.2 mm rains against the normal rainfall of 1800.8 mm, recording 19% surplus rains. Out of 4 districts in the state 3 have recorded normal rain while 1 have registered rainfall excess of over 20%.
EAST INDIA
BIHAR

Bihar District Wise Rainfall Distribution 2018 (Source: IMD)
|
Period: 01-06-2018 To 30-09-2018 |
|||||
| SN | Actual (mm) | Normal
(mm) |
Dep.
(%) |
Cat. | |
| BIHAR | 770.8 | 1027.6 | -25% | D | |
| 1 | ARARIYA | 1007.1 | 1347.0 | -25% | D |
| 2 | ARWAL | 498.8 | 789.7 | -37% | D |
| 3 | AURANGABAD | 700.0 | 859.6 | -19% | N |
| 4 | BEGUSARAI | 612.5 | 921.6 | -34% | D |
| 5 | BHOJPUR | 568.2 | 924.4 | -39% | D |
| 6 | BUXAR | 1060.1 | 861.2 | 23% | E |
| 7 | DRABHANGA | 636.5 | 924.6 | -31% | D |
| 8 | GOPALGANJ | 754.9 | 989.9 | -24% | D |
| 9 | JAHANABAD | 496.5 | 820.4 | -39% | D |
| 10 | JAMUI | 587.1 | 951.8 | -38% | D |
| 11 | KATIHAR | 653.3 | 1109.9 | -41% | D |
| 12 | KHAGARIA | 596.5 | 1057.7 | -44% | D |
| 13 | LAKHISARAI | 610.6 | 974.0 | -37% | D |
| 14 | MADHEPURA | 847.5 | 1153.5 | -27% | D |
| 15 | MUNGER | 705.3 | 974.0 | -28% | D |
| 16 | MUZAFFARPUR | 538.4 | 981.1 | -45% | D |
| 17 | NALANDA | 606.2 | 876.8 | -31% | D |
| 18 | NAWADA | 727.7 | 896.6 | -19% | N |
| 19 | PATNA | 623.6 | 941.3 | -34% | D |
| 20 | PURBA CHAMPARAN | 637.0 | 1021.6 | -38% | D |
| 21 | PURNIA | 1013.0 | 1313.3 | -23% | D |
| 22 | ROHTAS | 660.5 | 834.5 | -21% | D |
| 23 | SAHARSA | 603.3 | 1408.1 | -57% | D |
| 24 | SAMASTIPUR | 773.4 | 1025.2 | -25% | D |
| 25 | SARAN | 452.0 | 973.5 | -54% | D |
| 26 | SHEIKHPURA | 555.4 | 865.7 | -36% | D |
| 27 | SHEOHAR | 692.2 | 1084.4 | -36% | D |
| 28 | SITAMARHI | 871.3 | 1084.4 | -20% | D |
| 29 | SIWAN | 556.9 | 1004.2 | -45% | D |
| 30 | SUPAUL | 784.5 | 1055.6 | -26% | D |
| 31 | VAISHALI | 524.2 | 1021.6 | -49% | D |
| 32 | Buxar | 1060.1 | 86.2 | 23% | E |
Bihar state has recorded 25% below normal rainfall. Out of total 39 districts in the state, 29 are rain deficit, 2 are very close to deficit category while only 1 districts Buxar has registered excess rainfall.
JHARKHAND

Jharkhand District Wise Rainfall Distribution 2018 (Source: IMD)
|
Period: 01-06-2018 To 30-09-2018 |
|||||
| SN | State | Actual (mm) | Normal
(mm) |
Dep.
(%) |
Cat. |
| 1 | JHARKHAND | 784.3 | 1091.9 | -28% | D |
| 2 | BOKARO | 606.3 | 1048.2 | -42% | D |
| 3 | CHATRA | 567.1 | 1031.3 | -45% | D |
| 4 | DEVGARH | 581.6 | 976.2 | -40% | D |
| 5 | DHANBAD | 754.1 | 1122.3 | -33% | D |
| 6 | DUMKA | 702.0 | 1096.9 | -36% | D |
| 7 | GARHWA | 432.6 | 927.8 | -53% | D |
| 8 | GIRIDIH | 700.8 | 1065.0 | -34% | D |
| 9 | GOODA | 641.1 | 943.2 | -32% | D |
| 10 | GUMLA | 830.7 | 1197.0 | -31% | D |
| 11 | JAMTARA | 830.1 | 1193.8 | -30% | D |
| 12 | KHUNTI | 513.5 | 1251.1 | -59% | D |
| 13 | KODARMA | 480.9 | 929.6 | -48% | D |
| 14 | PAKUR | 583.0 | 1286.2 | -55% | D |
| 15 | PALAMU | 666.4 | 974.5 | -32% | D |
| 16 | RANCHI | 752.3 | 1160.2 | -35% | D |
| 17 | SAHEBGANJ | 846.4 | 1299.3 | -35% | D |
| 18 | SARAIKELA | 725.7 | 1135.5 | -36% | D |
Monsoon has seen huge deficit of 28%. Out of 24 districts in the state 18 are in deficit category including 7 registering shortfall higher than 40% and the rest above 20%. Not a single district has registered excess rains in the state.
ODISHA

Odisha District Wise Rainfall Distribution 2018 (Source: IMD)
|
Period: 01-06-2018 To 30-09-2018 |
|||||
| SN | States | Actual (mm) | Normal
(mm) |
Dep.
(%) |
Cat. |
| ODISHA | 1290.2 | 1149.9 | 12% | N | |
| 1 | BALANGIR | 932.0 | 1174.1 | -21% | D |
| 2 | BHADRAK | 1337.2 | 1069.9 | 25% | E |
| 3 | JAGATSINGHAPUR | 1452.2 | 1120.8 | 30% | E |
| 4 | JAJAPUR | 1552.6 | 1154.8 | 34% | E |
| 5 | KALAHANDI | 1686.8 | 1207.6 | 40% | E |
| 6 | KENDRAPARHA | 1573.1 | 1088.5 | 45% | E |
| 7 | KENDUJHAR | 1283.3 | 1056.5 | 21% | E |
| 8 | KORAPUT | 1746.3 | 1262.8 | 38% | E |
| 9 | MALKANGIRI | 1844.9 | 1324.1 | 39% | E |
| 10 | PURI | 1565.3 | 1021.5 | 53% | E |
| 11 | RAYAGARHA | 1262.9 | 960.5 | 31% | E |
With 12% excess rains Odisha state is in normal category. Out of 30 districts only 1 has recorded deficit rain and 10 districts have received excess rain during 2018 SW monsoon.
WEST BENGAL

West Bengal District Wise Rainfall Distribution 2018 (Source: IMD)
|
Period: 01-06-2018 To 30-09-2018 |
|||||
| SN | State | Actual (mm) | Normal
(mm) |
Dep.
(%) |
Cat. |
| WEST BENGAL | 1102.0 | 1390.4 | -21% | D | |
| 1 | DAKSHIN DINAJPUR | 525.7 | 1185.9 | -56% | D |
| 2 | KOCHBIHAR | 1604.1 | 2737.6 | -41% | D |
| 3 | MALDA | 587.9 | 1117.3 | -47% | D |
| 4 | UTTAR DINAJPUR | 840.0 | 1394.5 | -40% | D |
| 5 | BARDAMAN | 810.5 | 1028.7 | -21% | D |
| 6 | BIRBHUM | 709.6 | 1106.0 | -36% | D |
| 7 | HAORA | 843.9 | 1211.4 | -30% | D |
| 8 | HUGLI | 787.1 | 1067.9 | -26% | D |
| 9 | MURSIDABAD | 514.4 | 1079.3 | -52% | D |
| 10 | NADIA | 723.2 | 955.0 | -24% | D |
West Bengal has recorded 21% below normal rainfall. Out of 19 districts in the state 10 are in deficit category. The shortfall is higher than 40% in 5 districts. Apart from these, 3 other districts Purlia, Pachim Medinipur and South 24 Parganas have also registered deficit rainfall by -17 %, -18% and -19% respectively.
WEST INDIA
RAJASTHAN

Rajasthan District Wise Rainfall Distribution 2018 (Source: IMD)
|
Period: 01-06-2018 To 30-09-2018 |
|||||
| SN | States | Actual (mm) | Normal
(mm) |
Dep.
(%) |
Cat. |
| RAJASTHAN | 393.6 | 490.0 | -6% | N | |
| 1 | BARMER | 123.2 | 243.4 | -49% | D |
| 2 | HANUMANGARH | 138.1 | 252.5 | -45% | D |
| 3 | JAISELMER | 110.5 | 158.4 | -30% | D |
| 4 | JALOR | 155.9 | 394.2 | -60% | LD |
| 5 | PALI | 316.9 | 446.7 | -29% | D |
| 6 | BHARATPUR | 755.4 | 557.6 | 35% | E |
| 7 | PRATAPGARH | 1135.0 | 845.8 | 34% | E |
| 8 | SIKAR | 565.6 | 402.5 | 41% | E |
| 9 | SIROHI | 409.0 | 868.6 | -53% | D |
| 10 | SWAIMADHOPUR | 1008.7 | 664.0 | 52% | E |
The state has registered 6% below normal rainfall. Out of 33 districts 6 are in deficit category including Jalor which is in large deficit category with rainfall 60% below normal. 4 districts are in excess rainfall category. Nagaur district has also registered deficit rains by -18%.
GUJARAT

Gujarat District Wise Rainfall Distribution 2018 (Source: IMD)
|
Period: 01-06-2018 To 30-09-2018 |
|||||
| SN | State | Actual (mm) | Normal
(mm) |
Dep.
(%) |
Cat. |
| GUJARAT | 484.6 | 672.7 | -28% | D | |
| 1 | AHMADABAD | 285.9 | 630.6 | -55% | D |
| 2 | BANASKANTHA | 214.5 | 563.5 | -62% | LD |
| 3 | CHHOTA UDEPUR | 778.6 | 1059.6 | -27% | D |
| 4 | DAHOD | 571.7 | 853.3 | -33% | D |
| 5 | GANDHINAGAR | 326.5 | 715.6 | -54% | D |
| 6 | KHERA | 605.1 | 819.1 | -26% | D |
| 7 | MAHESANA | 293.5 | 655.7 | -55% | D |
| 8 | MAHISAGAR | 599.8 | 802.0 | -25% | D |
| 9 | NARMADA | 684.7 | 1099.8 | -38% | D |
| 10 | PATAN | 185.1 | 513.9 | -64% | LD |
| 11 | SABAR KANTHA | 508.8 | 756.0 | -33% | D |
| 12 | TAPI | 1132.6 | 1484.9 | -24% | D |
| 13 | VADODARA | 538.6 | 909.8 | -41% | D |
| 14 | BHAVNAGAR | 412.9 | 533.3 | -23% | D |
| 15 | BOTAD | 379.0 | 483.3 | -22% | D |
| 16 | DEVBHOOMI DWARKA | 245.8 | 414.7 | -41% | D |
| 17 | GIR SOMNATH | 1250.8 | 779.5 | 60% | LE |
| 18 | JAMNAGAR | 340.0 | 509.9 | -33% | D |
| 19 | KACHCHH | 130.8 | 361.3 | -64% | LD |
| 20 | MORBI | 228.2 | 490.8 | -54% | D |
| 21 | PORBANDAR | 417.7 | 603.5 | -31% | D |
| 22 | RAJKOT | 369.4 | 576.8 | -36% | D |
| 23 | SURENDRANAGAR | 237.5 | 492.3 | -52% | D |
Gujarat has registered rainfall deficit of 28%. 22 districts out of 33 in the state are in deficit category including 3 districts of Kachchh, Patan and Banaskantha where rainfall deficit has been more that -64%. Only one district in the state (Gir Somnath) has recorded excess rains and the rest are in normal category.
GOA

Goa District Wise Rainfall Distribution 2018 (Source: IMD)
|
Period: 01-06-2018 To 30-09-2018 |
|||||
| SN | State | Actual (mm) | Normal
(mm) |
Dep.
(%) |
Cat. |
| GOA | 2432.5 | 2970.3 | -18% | N | |
| 1 | NORTH | 2623.7 | 3154.9 | -17% | N |
| 2 | SOUTH | 2263.7 | 2806.9 | -19% | N |
Goa rainfall has been 18% below normal. Both North and South districts of the state are also deficit by -17% and -19% respectively.
CENTRAL INDIA
MADHYA PRADESH

Madhya Prdesh District Wise Rainfall Distribution 2018 (Source: IMD)
|
Period: 01-06-2018 To 30-09-2018 |
|||||
| SN | State | Actual (mm) | Normal
(mm) |
Dep.
(%) |
Cat. |
| MADHYA PRADESH | 873.1 | 952.3 | -8% | N | |
| 1 | BETUL | 595.0 | 918.5 | -35% | D |
| 2 | BHIND | 916.7 | 685.5 | 34% | E |
| 3 | DATIA | 945.9 | 775.8 | 22% | E |
| 4 | DEWAS | 670.7 | 949.8 | -29% | D |
| 5 | HARDA | 770.1 | 1042.3 | -26% | D |
| 6 | KHANDWA | 1036.9 | 850.8 | 22% | E |
| 7 | NIMACH | 1058.3 | 747.4 | 42% | E |
| 8 | SHIVPURI | 992.6 | 779.8 | 27% | E |
| 9 | ANUPPUR | 843.7 | 1174.8 | -28% | D |
| 10 | BALAGHAT | 982.8 | 1334.6 | -26% | D |
| 11 | CHHINDWARA | 643.3 | 882.8 | -27% | D |
| 12 | SATNA | 764.5 | 953.2 | -20% | D |
| 13 | SEONI | 779.5 | 1038.4 | -25% | D |
| 14 | TIKAMGARH | 1289.4 | 853.2 | 51% | E |
| 15 | UMARIA | 1363.6 | 1093.9 | 25% | E |
Madhya Pradesh has received 8% below normal monsoon rain. Out of 51 districts 8 districts are in deficit category and 7 are in excess rainfall category. Apart from this Bhopal and Sagar districts have recorded 19% (each) rainfall and Hoshangabad, Sehore, Panna and Shadol districts are rainfall deficit by -18% (each).
CHHATTISGARH

Chhattisgarh District Wise Rainfall Distribution 2018 (Source: IMD)
|
Period: 01-06-2018 To 30-09-2018 |
|||||
| SN | State | Actual (mm) | Normal
(mm) |
Dep.
(%) |
Cat. |
| CHHATTISGARH | 1101.5 | 1153.3 | -4% | N | |
| 1 | BALARAMPUR | 678.2 | 1141.3 | -41% | D |
| 2 | BEMETARA | 1251.4 | 1008.9 | 24% | E |
| 3 | BIJAPUR | 1961.8 | 1369.1 | 43% | E |
| 4 | BILASPUR | 822.1 | 1080.9 | -24% | D |
| 5 | JANJGIR CHAMPA | 839.2 | 1201.9 | -30% | D |
| 6 | JASHPUR | 1002.3 | 1348.6 | -26% | D |
| 7 | KORBA | 1021.5 | 1365.2 | -25% | D |
| 8 | MUNGELI | 868.8 | 1080.9 | -20% | D |
| 9 | SUKMA | 1691.8 | 1145.5 | 48% | E |
Chhattisgarh state has received normal monsoon. Out of 27 districts 6 are in deficit category and 3 are in excess category. The rest districts are in normal rainfall category including Korea which has recorded short fall of -19%.
MAHARASHTRA

Maharashtra District Wise Rainfall Distribution 2018 (Source: IMD)
|
Period: 01-06-2018 To 30-09-2018 |
|||||
| SN | State | Actual
(mm) |
Normal
(mm) |
Dep.
(%) |
Cat. |
| MAHARASHTRA | 925.8 | 1007.3 | -8% | N | |
| Madhya Maharashtra | 665.4 | 729.3 | -9% | ||
| 1 | AHMADNAGAR | 339.9 | 437.6 | -22% | D |
| 2 | DHULE | 411.3 | 523.5 | -21% | D |
| 3 | JALGAON | 512.2 | 641.8 | -20% | D |
| 4 | NANDURBAR | 563.7 | 828.4 | -32% | D |
| 5 | SANGLI | 354.5 | 508.1 | -30% | D |
| 6 | SOLAPUR | 279.4 | 474.2 | -41% | D |
| MARATHWADA | 534.6 | 682.9 | -22% | ||
| 7 | AURANGABAD | 408.0 | 594.2 | -31% | D |
| 8 | BID | 383.3 | 569.4 | -33% | D |
| 9 | HINGOLI | 698.6 | 849.1 | -18% | N |
| 10 | JALNA | 428.8 | 606.4 | -29% | D |
| 11 | LATUR | 529.2 | 752.5 | -30% | D |
| 12 | OSMANABAD | 478.8 | 623.4 | -23% | D |
| 13 | PARBHANI | 592.1 | 757.2 | -22% | D |
| VIDARBHA | 875.4 | 954.6 | -8% | ||
| 14 | AMARAVATI | 633.8 | 786.6 | -19% | N |
| 15 | BULDHANA | 471.9 | 646.6 | -27% | D |
| 16 | WARDHA | 725.2 | 880.3 | -18% | N |
At state level Maharashtra has received 8% below normal monsoon. But at district level 13 out of 36 districts are deficit in rains. None of the districts has received excess rains. Hingoli and Wardha districts have recorded 18% rainfall deficit but falls in normal category.
The Rainfall Recording and Analysis by Department of Agriculture Maharashtra State also measure daily and seasonal rainfall at Circle, Tehsil, District and Division level. The website also carries lots of information and maps on the rainfall activity in the state. For more details kindly see Mirage of Normal Monsoon.
SOUTH INDIA
TELANGANA

Telangana District Wise Rainfall Distribution 2018 (Source: IMD)
|
Period: 01-06-2018 To 30-09-2018 |
|||||
| SN | State | Actual (mm) | Normal
(mm) |
Dep.
(%) |
Cat. |
| TELANGANA | 741.1 | 759.2 | -2% | N | |
| 1 | ADILABAD | 1378.3 | 998.8 | 38% | E |
| 2 | B. KOTHAGUDEM | 1120.8 | 934.0 | 20% | E |
| 3 | HYDERABAD | 434.1 | 612.5 | -29% | D |
| 4 | J. BHUPALPALLY | 1271.1 | 992.0 | 28% | E |
| 5 | JANGAON | 477.7 | 590.3 | -19% | N |
| 6 | JOGULAMBA GADWAL | 286.7 | 490.5 | -42% | D |
| 7 | KAMAREDDY | 720.8 | 884.1 | -18% | N |
| 8 | KHAMMAM | 913.6 | 755.0 | 21% | E |
| 9 | M. MALKAJGIRI | 399.6 | 672.7 | -41% | D |
| 10 | MAHABUBNAGAR | 406.7 | 597.2 | -32% | D |
| 11 | MEDAK | 595.6 | 903.9 | -34% | D |
| 12 | NAGARKURNOOL | 353.0 | 536.7 | -34% | D |
| 13 | PEDDAPALLE | 1152.4 | 908.9 | 27% | E |
| 14 | RANGAREDDY | 391.8 | 543.7 | -28% | D |
| 15 | SANGAREDDY | 403.7 | 739.4 | -45% | D |
| 16 | VIKARABAD | 438.5 | 733.1 | -40% | D |
With 2% rainfall deficit, Telangana is listed under normal monsoon category. Out of 31 districts of the state 9 have recorded deficit rainfall while 5 have received excess rainfall. In addition, Kamareddy and Jangaon districts have also registered rainfall deficit of -18% and -19% respectively.
ANDHRA PRADESH

Andhra Pradesh District Wise Rainfall Distribution 2018 (Source: IMD)
|
Period: 01-06-2018 To 30-09-2018 |
|||||
| SN | State | Actual (mm) | Normal
(mm) |
Dep.
(%) |
Cat. |
| ANDHRA PRADESH | 443.1 | 504.4 | -12% | N | |
| 1 | EAST GODAVARI | 884.0 | 703.9 | 26% | E |
| 2 | NELLORE | 187.6 | 352.4 | -47% | D |
| 3 | PRAKASAM | 264.1 | 382.5 | -31% | D |
| 4 | WEST GODAVARI | 988.4 | 783.9 | 26% | E |
| RAYALASEEMA | 252.6 | 398.3 | -37% | ||
| 5 | ANANTHAPUR | 235.7 | 322.8 | -27% | D |
| 6 | CHITTOOR | 290.8 | 417.1 | -30% | D |
| 7 | CUDDAPAH | 203.3 | 404.1 | -50% | D |
| 8 | KURNOOL | 281.0 | 460.2 | -39% | D |
At state level monsoon season has been normal for Andhra Pradesh. At district level 8 districts including 4 from Rayalaseema out of 13 are in deficit category and 2 districts have recorded excess rainfall.
KARNATAKA

Karnataka District Wise Rainfall Distribution 2018 (Source: IMD)
|
Period: 01-06-2018 To 30-09-2018 |
|||||
| SN | State | Actual (mm) | Normal
(mm) |
Dep.
(%) |
Cat. |
| KARNATAKA | 781.4 | 832.2 | -6% | N | |
| 1 | BANGLORE URBAN | 386.2 | 475.7 | -19% | N |
| 2 | BELLARY | 208.3 | 376.0 | -45% | D |
| 3 | CHAMARAJANAGAR | 222.4 | 320.6 | -31% | D |
| 4 | CHIKBALLAPUR | 203.4 | 411.8 | -51% | D |
| 5 | CHITRADURGA | 199.6 | 271.0 | -26% | D |
| 6 | KODAGU | 3462.7 | 2181.9 | 59% | E |
| 7 | KOLAR | 247.0 | 382.7 | -35% | D |
| 8 | MYSORE | 480.7 | 343.6 | 40% | E |
| 9 | TUMKUR | 253.0 | 359.2 | -30% | D |
| NI Karnataka | 358.0 | 506.0 | -29% | ||
| 10 | BAGALKOT | 221.0 | 363.3 | -39% | D |
| 11 | BELGAUM | 691.4 | 574.1 | 20% | E |
| 12 | BIDAR | 442.8 | 694.9 | -36% | D |
| 13 | BIJAPUR | 242.4 | 436.0 | -44% | D |
| 14 | DHARWAD | 384.6 | 484.0 | -21% | D |
| 15 | GADAG | 235.5 | 368.3 | -36% | D |
| 16 | GULBARGA | 392.6 | 620.5 | -37% | D |
| 17 | HAVERI | 356.6 | 495.1 | -28% | D |
| 18 | KOPPAL | 219.0 | 382.6 | -43% | D |
| 19 | RAICHUR | 211.5 | 461.6 | -54% | D |
| 20 | YADGIR | 213.0 | 610.8 | -65% | LD |
With 6% deficit Karnataka state has registered normal monsoon rainfall. However at district level out of 27 districts 16 districts are significantly rainfall deficit including 10 out of 11 districts from NI Karnataka. Yadgir district has recorded large deficit of -65% whereas Kodagu district has received 59% excess rainfall. In Bangaluru urban rain shortfall has been -19%.
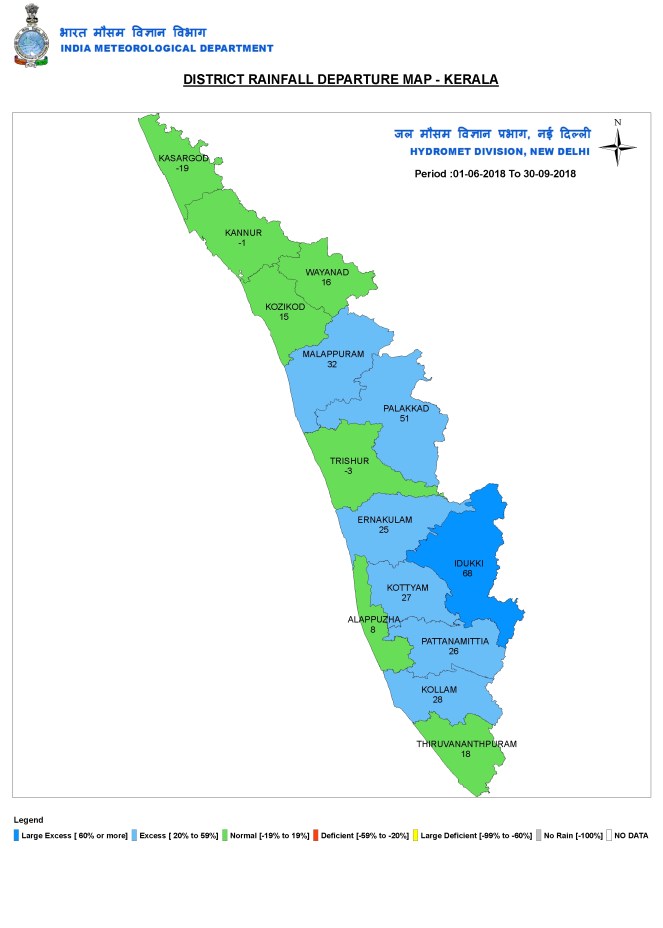
KERALA
Kerala District Wise Rainfall Distribution 2018 (Source: IMD)
|
Period: 01-06-2018 To 30-09-2018 |
|||||
| SN | State | Actual (mm) | Normal
(mm) |
Dep.
(%) |
Cat. |
| KERALA | 2517.3 | 2039.6 | 23% | ||
| 1 | ERNAKULAM | 2588.3 | 2065.0 | 25% | E |
| 2 | IDUKKI | 3819.2 | 2276.2 | 68% | LE |
| 3 | KASARGOD | 2422.2 | 3007.5 | -19% | N |
| 4 | KOLLAM | 1706.0 | 1332.3 | 28% | E |
| 5 | KOTTYAM | 2406.9 | 1897.3 | 27% | E |
| 6 | MALAPPURAM | 2722.3 | 2060.4 | 32% | E |
| 7 | PALAKKAD | 2378.1 | 1572.7 | 51% | E |
| 8 | PATTANAMITTIA | 2167.1 | 1715.7 | 26% | E |
Kerala has received 23% above normal monsoon. Out of 14 districts, excess rainfall has been recorded in 7 districts including large excess of 68% from Idukki district. The rest of the districts are in normal category including Kasargod which has registered rainfall deficit of 19%.
TAMIL NADU

Tamil Nadu District Wise Rainfall Distribution 2018 (Source: IMD)
|
Period: 01-06-2018 To 30-09-2018 |
|||||
| SN | State | Actual (mm) | Normal
(mm) |
Dep.
(%) |
Cat. |
| TAMIL NADU | 290.7 | 317.0 | -8% | ||
| 1 | ARIYALUR | 218.3 | 392.0 | -44% | D |
| 2 | COIMBATORE | 652.3 | 189.8 | 244% | LE |
| 3 | CUDDALORE | 274.6 | 383.1 | -28% | D |
| 4 | DHARAMPURI | 170.6 | 393.4 | -57% | D |
| 5 | ERODE | 282.9 | 229.8 | 23% | E |
| 6 | KANCHIPURAM | 397.0 | 490.8 | -19% | N |
| 7 | KANYAKUMARI | 579.7 | 477.4 | 21% | E |
| 8 | KARUR | 164.3 | 213.6 | -23% | D |
| 9 | KRISHNAGIRI | 222.2 | 399.0 | -44% | D |
| 0 | MADURAI | 273.7 | 335.9 | -19% | N |
| 11 | NAGAPATTINAM | 164.8 | 286.1 | -42% | D |
| 12 | NAMAKKAL | 256.6 | 339.3 | -24% | D |
| 13 | PERAMBALUR | 179.9 | 290.7 | -38% | D |
| 14 | PUDUKKOTTAI | 277.5 | 350.6 | -21% | D |
| 15 | RAMANATHAPURAM | 96.4 | 149.3 | -35% | D |
| 16 | SALEM | 330.5 | 440.6 | -25% | D |
| 17 | TENI | 474.0 | 158.4 | 199% | LE |
| 18 | THANJAVUR | 151.0 | 318.4 | -53% | D |
| 19 | THIRUVARUR | 181.7 | 296.4 | -39% | D |
| 20 | TIRUCHIRAPPALLI | 143.2 | 293.9 | -51% | D |
| 21 | TIRUNELVELI | 344.5 | 142.4 | 142% | LE |
| 22 | TIRUVALLUR | 364.3 | 451.6 | -19% | N |
| 23 | TIRUVANNAMALAI | 309.7 | 468.1 | -34% | D |
| 24 | TUTICORIN | 57.8 | 74.9 | -23% | D |
| 25 | VELLORE | 318.1 | 466.1 | -32% | D |
| 26 | VILLUPURAM | 257.0 | 408.3 | -37% | D |
At state level monsoon has been normal for Tamil Nadu, however 18 of its 32 districts are in deficit category including 6 districts registering rainfall deficit of greater than 40%. 5 districts has received excess rainfall including 3 districts of Tirunelveli, Teni and Coimbatore with large excess rainfall of 142%, 199% and 244% respectively. 3 districts namely Tiruvallur, Madurai and Kanchipuram have registered rainfall deficit of -19% (each) but they are in normal category.
LAKSHADWEEP

The union territory has also recorded rainfall deficit of -45%. It recorded 553.2 mm rains against the normal level of 998.5 mm.
The district wise cumulative rainfall departure and week by week rainfall distribution file can be seen here. DISTRICT_RAINFALL_DEPARTURE CUMULATIVE 1 June – 30 Sept., 1 June – 26 Sept. District Week by Week
Composed by Bhim Singh Rawat (bhim.sandrp@gmail.com)
Also see, River Wise Rainfall in Monsoon 2018


One thought on “Monsoon 2018 Overview: Serious Anomalies Hidden by Macro Figures”