-Prof J. Mark Baker (JMark.Baker@humboldt.edu), Humboldt State University, Arcata, CA, USA
Introduction
This post is the second of a two part summary of the results of a study on the socio-ecological impacts of privatized, small, run-of-the-river hydropower projects in Himachal Pradesh.[1] The study is based on field research conducted in 2012 on all 49 completed small hydropower projects in the state.[1] Part one, posted here on 8 June, reviews the implementation of the Himachal Pradesh power policy governing privatized small hydropower development and examines the local social and environmental effects of commissioned small (defined as 5 MW or less) hydropower projects. This part will address two of the claimed local benefits of small hydropower development, namely monetary contributions by the project developer to local community development projects through the Local Area Development Authority (LADA) and local employment generation. After a brief discussion of the relationship between small hydropower projects and carbon credits through the Clean Development Mechanism, the article reviews two promising institutional models for small hydropower development and concludes with a set of recommendations.
Local Area Development Authority– Implementation and Accountability Challenges
The 2006 Hydropower Policy includes provisions for tangible local benefits, in part to foster local support for power projects. One primary mechanism is the requirement that project developers deposit one percent of the project cost into an account with the district commissioner. These funds, known as Local Area Development Funds, are to be allocated by the Local Area Development Authority (LADA) to support local development activities, particularly related to infrastructure and services.[2]
In our survey of the 49 commissioned small hydropower projects we found that the LADA program was not working as well as intended. Inconsistent record keeping by district authorities, the lack of clearly defined project affected areas, and uneven levels of awareness among local pradhans about the program have enabled some project developers in Himachal to avoid fulfilling their obligations to local communities. The district revenue department office in Kangra was the only district office that maintained a comprehensive record of LADA obligations and tracked how much the project developer had paid and how much was still owed. Without such a record, officials in the remaining six districts found it extremely difficult to hold the project developer accountable for their LADA payment obligations. For example, in District Chamba, ten small hydropower projects together owe Rs 247 lakhs. However, as of the summer of 2012 they had paid only Rs 70 lakhs and the developers of three projects had contributed nothing at all. District administrators seem to have little authority or recourse, beyond personal persuasion, to compel the project developer to make the required contributions.
There are also challenges with defining the Project Affected Area (PAA) and Project Affected Zone (PAZ), which is important because 70% of the LADA funds are earmarked for projects in the PAA and 30% for projects in the PAZ. Very few small hydropower projects have defined PAAs and none had defined a PAZ. The lack of clearly defined affected areas raises questions about whether or not the authorized development projects actually reach those households and hamlets most affected by the hydropower project.
A related concern is the unevenness of awareness about the LADA program among village pradhans. Several village pradhans, especially in the remote areas of the state, had never heard of the LADA program, even though one or more small hydropower projects were located within their panchayat boundaries. Where the program was functional, there are sometimes disputes between the LADA committee and the district commissioner concerning which projects to fund and whether to prioritize projects oriented towards strengthening local employment generation or hard infrastructure development.
We did encounter one example of a panchayat in which the LADA program was working as intended. The pradhan of the panchayat, located in District Kangra, was a retired military officer. Well aware of the LADA obligations of the small hydropower project developers in his panchayat, he maintained close communication with the district commissioner’s office in order to ensure that the required deposits were made. The pradhan also pressured the LADA committee to identify potential projects in a timely fashion and he followed up with the district commissioner to ensure that the expenditure of the requisite funds was authorized. As a result, in this panchayat LADA funds had been used to construct a cricket playing field, veterinary dispensary, and a handsome hall for village meetings and social functions (figures 1 and 2). Furthermore, in part due to the effective implementation of the LADA program and the fact that the small hydropower project did not annex cultivated areas, local opposition to the projects was virtually nonexistent. This example suggests that the LADA can offer tangible local benefits if accurate records are kept, if the project developers are compelled to contribute the requisite amounts, if village pradhans know about the program and their entitlements under it, and if the district administration supports program implementation.


Employment Generation –Unrealized Potential for Secure Jobs
In addition to requiring project developers to contribute to the Local Area Development Authority, the 2006 Hydropower Policy seeks to generate local benefits by stipulating that 70% of the project’s workers be from Himachal Pradesh. Because the lack of local employment opportunities is one of the primary drivers of migration from hill areas, the provision of permanent jobs through small hydropower projects could be a significant benefit. In addition to a steady income, permanent regular employees participate in government-approved pension plans, receive compensation for work-related accidents and injuries, and are protected from arbitrary dismissal. The project developer is also required to register all workers with the Labour Department and the local police station on a monthly basis.
While the 49 commissioned small hydropower projects in the state generate significant employment, more than half of project developers evade complying with labor law. All told, the 49 projects employ a total of 951 people, 603 of whom come from the panchayat(s) in which the project is located. On average, a 5 MW project employs approximately 20 people. While the total employment these projects generate is substantial, only 22 project developers have registered their employees with the state Labour Department as regular employees. These workers do receive the protections and benefits of the state’s labor laws, and some of them (in three projects) are also provided subsidized lodging and meals. However, the workers in the remaining 27 small hydropower projects, while doing the same work as regular employees in other projects, are hired on a daily wage basis and are thus excluded from the benefits and security of regular employment. A further disjuncture arises from the fact that only 11 project developers have established provident fund contributions for their employees, the remaining 38 have not. For the majority of workers in small hydropower projects, one of the most important potential local benefits – secure employment – has not been realized.
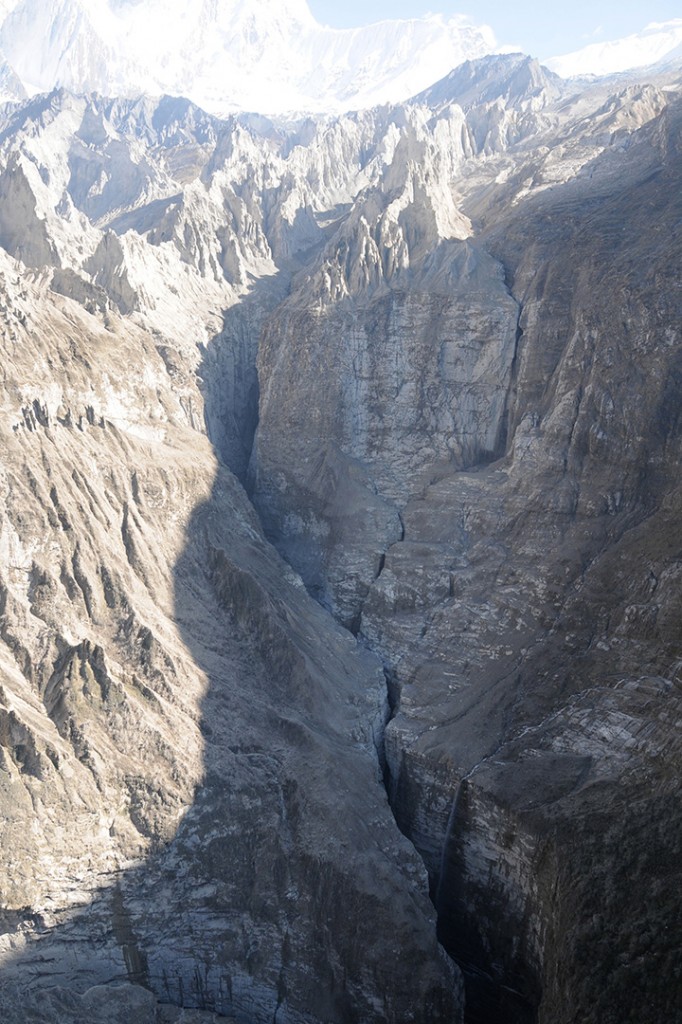
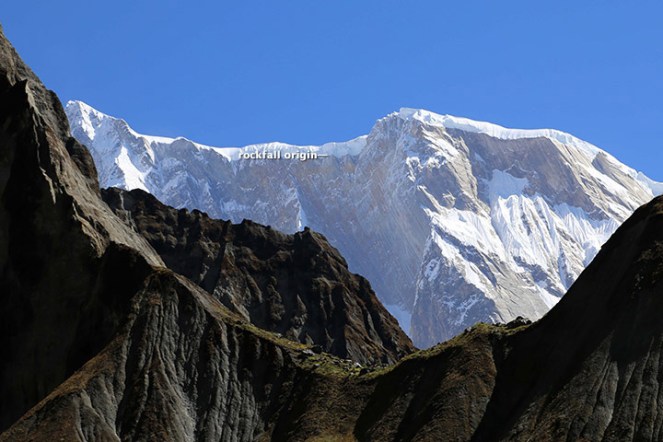
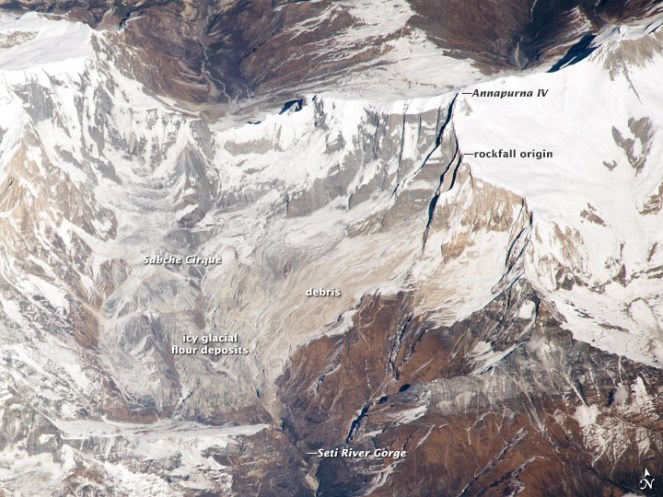
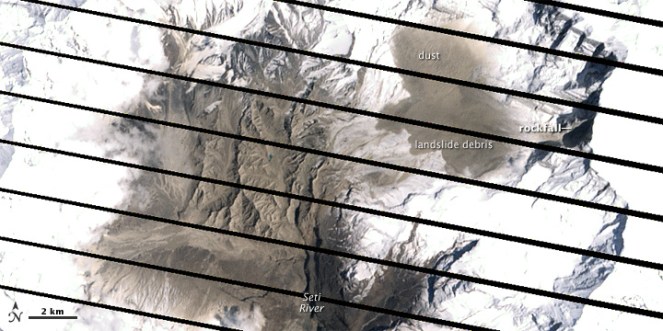
Given the significant risk of injury or death in this sector, it is of particular concern that unregistered workers are less likely than registered workers to receive compensation should an accident occur. While we did not develop comprehensive information about accidents and injuries, we did confirm worker deaths, the great majority of which occurred during the project construction phase due to tunnel collapses, falling rock, landslides, and tractor accidents. A total of 40 people died in accidents related to the construction of the commissioned small hydropower projects in the state, 18 were Himachali and 22 were from neighboring states or from Nepal. Only three of the families of the forty workers who died in fatal accidents received some form of compensation. The lack of proper registration and the general absence of compensation suggests the extent to which project developers and their contractors treat workers as a disposable labor force.
The common practice of contracting out project construction work to subcontractors who hire large numbers of employees challenges the ability of unions to advocate for project workers.[3] Questions arise concerning who is ultimately responsible for following the relevant labor laws and protections – the project developer or the developer’s subcontractors (figure 3)? Project developers can evade accountability through the use of subcontractors or by creating subsidiary companies. For example, in District Kangra in May, 2010 the local construction worker union notified a small hydropower project developer of its intent to strike due to violations of labor laws and working conditions. In a letter the developer responded that the strike was “totally illegal and off the mark” as the developer was not the owner of the plant but was “merely the contractor.” Furthermore the developer noted that the project was “generating power in the interest of the public of Himachal Pradesh,” and was “a property of the State and a national asset,” and thus the calling of the strike was “illegal from all perspectives.” While it is true that the developer to whom the labor union had sent the notice of intent to strike is not the company listed as the owner of the project in the state of Himachal Pradesh’s records, it is also true that the listed company is actually a subsidiary of the developer, whose address is the same as the developer and whose website leads directly to that of the developer. Furthermore, the power project is showcased on the developer’s website as one of four small hydropower projects they have constructed and are currently operating in District Kangra. The developer’s attempt to evade accountability for labor law violations by creating a fictitious subsidiary demonstrates the challenges unions face when they seek redress for labor law violations and demand worker rights
Payments to Developers for Renewable Energy Production
Part One of this article discussed the economics of small hydropower development. Clearly, the primary source of income developers receive is the guaranteed purchase price that the Himachal Pradesh State Electricity Board provides. A second, and much smaller, source of revenue for some projects derives from the sale of carbon credits through the Clean Development Mechanism of the Kyoto Protocol, administered under the United Nations Framework Convention on Climate Change (UNFCCC). The Clean Development Mechanism allows countries in the global south to sell carbon credits in the form of Certified Emission Reductions (CERs) to countries in the global north that need to purchase such reductions in order to meet emissions reduction limits that the Kyoto Protocol has imposed. Projects in the global south may be eligible for registration under the Clean Development Mechanism if it can be demonstrated that their implementation will prevent carbon (measured in metric tons of carbon dioxide equivalents) from entering the atmosphere. The resulting emission reductions can then be sold by the project developer to a carbon generating entity in the global north that needs to purchase such carbon credits. In the context of small scale hydropower projects, developers argue that if they did not produce electricity using hydropower, the equivalent amount of electricity would be generated primarily through the burning of fossil fuels. Thus, by producing electricity through hydropower, they are “preventing” a measureable amount of carbon from going into the atmosphere. If their projects are registered under the Clean Development Mechanisms, then project developers may sell credits to entities in the global north.
Of the 49 commissioned small hydropower projects, approximately 27 are registered under the Clean Development Mechanism.[4] According to documents relating to these 27 projects on the UNFCCC Clean Development Mechanism website, these hydropower projects are credited with generating 447651 metric tons of carbon dioxide emissions reduction equivalents per year. Project developers may sell these emissions reductions equivalents (carbon credits) to entities in the global north. There are at least three points worth noting about these carbon credits. Firstly, the value of carbon credits has dropped precipitously in the last few years, from a high of approximately rupees 760 in 2008 to its current price of less than rupees 50 per metric ton of carbon equivalent (redd-monitor.org 2013).[5] The essential collapse of the international carbon credit market has been attributed to an oversupply of credits and weak demand (Singh 2014). Secondly, there are serious concerns about the ethics of generating marketable carbon equivalents from projects that severely disrupt the livelihoods of communities as described in part one of this post. Thirdly, there are questions about the integrity of the calculations and procedures employed to calculate the carbon equivalents of such projects and to justify project inclusion in the UNFCCC registry. One of these questions centers on the requirement of additionality. Additionality, as the Kyoto Protocol specifies, is the principle that projects are eligible for international support through the Clean Development Mechanism only if they would be uneconomical without such support. Thus, a small hydropower project that is economically viable without the revenue from selling carbon credits is in principal barred from participating in the carbon credit program. On the other hand, private sector loan officers will not approve financing for projects that are not economically viable. At least some project developers resolve this contradiction by developing two sets of project documents. As one project manager told me, “we prepare two DPRs (Detailed Project Reports), one for CDM and one for the banks.”
In light of the poor remuneration developers receive from the sale of carbon equivalents, at least some project developers expressed the desire to participate in the Government of India’s Renewable Energy Certificate (REC) program, which has its roots in the 2003 Electricity Bill and is part of the country’s renewable energy policy (Carbon Credit Capital 2011). By becoming designated as “eligible entities” within the REC program, developers would receive one renewable energy certificate for every megawatt hour (MWh) that they sell to the state electricity grid. Purchasing electricity produced by an eligible entity enables state utilities to meet their Renewable Purchase Obligation, which is the proportion of electricity they purchase that must come from renewable sources. Eligible entities may trade renewable energy certificates on one of India’s two electricity exchanges. As of 2012, no small hydropower developer had become an eligible entity within the REC program. Several developers were interested in joining this program, however the fact that they already have power purchase agreements to sell electricity to the HP State Electricity Board renders them ineligible for the REC program.
Two Alternative Institutional Models for Future Small Hydropower Development
The track record of the 49 commissioned small hydropower projects in Himachal Pradesh is cause for concern. Patterns of disruption to farmer-managed irrigation systems as well as water mills (gharats), environmental and infrastructural damage from landslides in some regions (especially Chamba District), negative effects on fisheries and the livelihoods that fish farming and sport and subsistence fishing activities support, systemic problems with the Local Area Development Authority, significant uncompensated worker deaths during project construction and on-going concerns regarding labor relations, all comprise the local track record of small hydropower development in the state. Leaving aside the broader question of whether or not small hydropower projects should be developed, it is clear that if they are going to be developed, then an alternative institutional framework is called for.
Two institutional models for small hydropower development exist that have the potential to realize more sustainable, effective and equitable hydropower outcomes. These models are represented by the Sai Engineering Foundation (figure 4) and the Churah Cooperative Floriculture Society (figure 5). Inspired by the teachings of the religious leader Bhagwan Sri Sathya Sai Baba and the religious ideals of Gandhian social service, Sai Engineering Foundation is a registered charitable foundation that promotes social welfare. They have been involved with hydropower development since the first India Hilly Hydel demonstration projects in the 1990s. They both own and manage their own projects and provide consulting services for other private power developers. They invest the revenue from hydropower production in social service and welfare programs in Himachal Pradesh. These activities include medical and blood donation camps, financial assistance to low income students, community-based welfare programs, working with government programs to deliver services to low income communities, and promoting cooperative societies in the field of power generation, construction, and floriculture (Sai Engineering Foundation 2011). Because of the social service ideology that informs this organization, when the Sai Foundation develops small hydropower projects, it does so in a manner that prevents or mitigates the negative impacts on local livelihood strategies and is responsive to local concerns and issues.
The second alternative institutional arrangement is the Churah cooperative society. Although the 2006 Hydropower Policy specifically addresses the need to prioritize working with cooperative societies, and despite repeated calls by community members for more support for local cooperative society involvement in hydropower development, our research revealed only one community-based cooperative society working on small hydropower development. Since 1996 the Churah Valley Fruits, Vegetables, and Flowers Growers Marketing and Development Cooperative Society (Churah Floriculture Cooperative Society) has worked to promote the economic development of low income families in the Churah Valley, a remote area in Chamba District, not far from the border with Jammu and Kashmir. The cooperative’s initial and on-going work involves developing floriculture using greenhouses, and marketing cut flowers to cities in north India, as well as off-season vegetable production in neighboring Pangi Valley. Interestingly, they are also working to develop a small hydropower project under the framework of the 2006 Hydropower Policy. Four hundred Below Poverty Line (BPL) households, all members of the cooperative society, are involved in this effort. In order to qualify for the necessary loans, each household is putting up their house and land as collateral. The cooperative society is currently securing the necessary funding and moving ahead with efforts to secure the required No Objection Certificates. The revenue from the small hydropower project, once it is commissioned, will be shared among the participating families.

Both the Sai Engineering Foundation and the Churah Floriculture Cooperative Society represent viable alternatives to the current approach, which emphasizes corporate ownership of small hydropower facilities. Both of these organizations are accountable to local concerns and interests and prioritize local social and environmental sustainability. However, both the Sai Engineering Foundation and the Churah Floriculture Society face an uphill battle to get their projects approved and the requisite NOCs obtained. Both organizations have fewer financial resources to offer in exchange for obtaining NOCs than do private companies; they are thus at a disadvantage when competing with private corporations for bureaucrats’ attention and willingness to provide NOCs.
Concluding Recommendations
Insights from this study provide the basis for proposing concrete steps that together could help small run-of-the-river hydropower projects realize their purported, but not realized, benefits. Three broad categories of recommendations exist. Firstly, the process through which potential hydropower sites are identified must include key elements of the agrarian landscape as well as the cumulative effects of multiple projects along a common stream reach; furthermore, when negative social and environmental effects are anticipated, they should be adequately mitigated. Settlements, networks of kuhl irrigation systems, strings of gharats along streamcourses, irrigated and unirrigated cultivated areas, and proximity to adjacent projects, in addition to hydrological information, should be incorporated into the site evaluation and identification process. Using this information to avoid siting projects in densely managed landscapes, or too close to each other, would help eliminate many of the negative project impacts on local livelihoods and communities. In cases where projects do negatively affect local livelihoods, e.g. when a project renders gharats defunct, disrupts a community-managed irrigation system, or disturbs grazing or cultivated areas, then adequate compensation should be provided through a government-facilitated process. Similarly, negative environmental effects should be mitigated, for example by requiring manual cleaning of desilting tanks, installation of fish-friendly diversion weirs, adequate water (quality and quantity) to support ecosystem needs, and effective muck management approaches.
Secondly, policy implementation and enforcement need to be strengthened. While the 2006 HP Power Policy and state labour laws contain important safeguards for local communities and workers, implementation and enforcement need strengthening. For example, district authorities need to be required and empowered to collect the mandatory developer contributions to the Local Area Development Authority. LADA funds should be allocated in a manner that maximizes local benefits for project-affected households and communities. Similarly, labour laws requiring that workers doing regular work should be hired on a permanent, not a daily wage, basis should be enforced, and workers should receive the perquisites concomitant with regular employment, including compensation in the event of injury or death. Projects that disrupt local livelihoods and generate unmitigated negative environmental effects should not qualify for carbon credits under the Clean Development Mechanism. Greater policy and bureaucratic support also needs to be directed towards supporting alternative institutional models for small hydropower development, such as cooperative societies and social service foundations
Thirdly, governance measures that strengthen small hydropower projects’ accountability should be developed. The record of negative social and environmental effects and the extent of local opposition, attests to the unsustainable nature of the current approach to small hydropower development. Identifying and implementing governance measures to minimize these negative socio-ecological effects will likely provide a more informed and democratic basis for decision-making. Measures such as requiring Environmental Impact Assessments, along with the requisite public hearings, as well as obtaining environmental clearance from the state, would go a long way to improving the sustainability of small hydropower in Himachal Pradesh. If developers, after completing such assessments and hearings, and receiving clearance, were able to more easily obtain the necessary No Objection Certificates, then project delays would also be reduced.
Clearly, alternatives do exist for advancing institutional approaches to small hydropower development that are accountable to local communities and environmental concerns. Whether or not the state of Himachal Pradesh (and other states since this is likely to be equally applicable to other states where such projects are taken up) chooses to embrace these approaches remains to be seen. If the next 450 planned or under-construction small hydropower projects in the state generate a track record similar to the first fifty, then regional society and environment will be much the poorer for it. However, if civil society mobilizations and resistance are sustained, and governance measures strengthened, then power developers will be held more accountable for the local impacts of their activities. If the state government chooses to offer more support and capacity building resources for entities like cooperative societies and Sai Engineering Foundation, or at least removes some of the barriers they currently face, then these alternate institutional approaches to power development may proliferate. And if in response to electoral pressures within the state, Himachal Pradesh decides to put more teeth into its currently progressive, but not enforced, power policy, then perhaps the future will be brighter than the recent past.
Please see Part I of the piece here:https://sandrp.wordpress.com/2014/06/08/the-socio-ecological-effects-of-small-hydropower-development-in-himachal-pradesh/
References
Carbon Credit Capital (2011) “India’s Renewable Energy Certificate Market” (New York). Viewed on 9 June 2014. Website: http://carboncreditcapital.com/dev/wp-content/uploads/resources/InFocus8.pdf
Newing, Helen (2011): Conducting Research in Conservation: Social Science Methods and Practice (New York: Routledge).
Redd-Monitor.org (2013) “Clean development mechanism: zombie projects, zero emissions reductions and almost worthless carbon credits”. Viewed on 9 June 2014. Website: http://www.redd-monitor.org/2013/07/12/clean-development-mechanism-7000-projects-zero-emissions-reductions-almost-worthless-carbon-credits-and-zombie-projects-increasing
Sai Engineering Foundation (2011): “Karmayoga”, Quarterly Newsletter of Sai Engineering Foundation, 1(11) (New Shimla, Himachal Pradesh).
Singh, Namrata (2014) “Companies holding carbon credits stare at ‘real loss’”. Times of India. Viewed on 9 June 2014. Website: http://timesofindia.indiatimes.com/business/india-business/Companies-holding-carbon-credits-stare-at-real-loss/articleshow/31803387.cms
United Nations Framework Convention on Climate Change (2014). “Project Cycle Search.” Viewed on 9 June 2014. Website: http://cdm.unfccc.int/Projects/projsearch.html.
END NOTES:
1] This study is based on six months of mixed methods, qualitative and quantitative field research that I and two research assistants. After an initial exploration of the relevance of this topic in 2009, field research commenced in January, 2012. We began by meeting key state level bureaucrats in Shimla and collecting secondary documents concerning all of the 49 commissioned small hydropower projects from the Himurja (Himachal Pradesh Energy Development Agency) office in Shimla. We then turned to the district and project level research. In each district where commissioned small hydropower projects were located, we interviewed district officials and collected secondary information concerning the projects. We met with district commissioners, sub-division magistrates, tehsildars, and other concerned district officers. We informed officials of our research, garnered key insights about small hydropower development from them, and collected relevant information and project related records and documents. We then focused our research efforts on each commissioned small hydropower project. At each project location, we interviewed project representatives (generally the project manager and occasionally the project owner) and the panchayat pradhans of affected panchayats. We conducted structured and semi-structured survey interviews with project-affected households and other key informants. We checked all the information we obtained using between-subject, cross-method, and cross-researcher triangulation (Newing 2011). We ground truthed what we learned through meetings, surveys and interviews by walking transects from the diversion weir down to the tail race of every commissioned project. We also photocopied key documents such as petitions, correspondence, court documents, and judicial papers. Near the completion of the fieldwork, I met the same state level officers and bureaucrats with whom I had met at the beginning of the fieldwork in order to share preliminary research findings and conclusions.
[2] The Local Area Development Authority is a committee, comprised of the sub-district magistrate, other subdivisional officers, affected area panchayat pradhans, and a representative of the project developer. The committee identifies and prioritizes potential projects, and then submits the prioritized list of projects to the district commissioner, who is to then approve and authorize the necessary expenditure. Examples of projects include a veterinary dispensary, ayurvedic dispensary, cremation ground, village meeting hall, furniture for meeting hall, irrigation system (kuhl) repair, culverts and road repair, footbridges and playing field for youth.
[3] The labor-intensive project construction process lasts at least two years and often significantly longer. To accomplish specific tasks, subcontractors hire large numbers of workers. The majority of these workers live in temporary tin shed housing located along the banks of the stream or river from which the project diverts water. These “labor camps” often house one hundred or more workers. The fuelwood consumption for cooking and heating (notwithstanding attempts to provide LPG cylinders) associated with these camps poses a significant environmental concern, as does the fact that most of these labor camps do not have adequate provision for wastewater and sewage. Consequently the adjacent stream, which is invariably used downstream for washing, irrigation and other purposes, and stream bank, are severely contaminated. While this research focused on already constructed projects, local residents nevertheless often complained about the negative environmental, health, and social impacts of these labor camps.
[4] This is based on a comprehensive review of the Project Cycle Search webpages of the Clean Development Mechanism segment of the UNFCCC website, accessed on 9 June 2014.
RELATED SUBSEQUENT STORIES:
[5] http://www.indiawaterportal.org/articles/irrigation-systems-himachal-threatened-hydropower-projects