Bundelkhand is known as a drought prone region. It is comprised of 7 districts of Uttar Pradesh and 6 districts of Madhya Pradesh. The region is known as drought prone region in recent years. Let us see the situation of 2025 SW Monsoon rain in Bundelkhand.
Here we have included the October rainfall too in addition to the normal SW Monsoon months of June to September. This is because the monsoon did not withdraw by the end of September and October had significant surplus rainfall. All these figures are from India Meteorological Department’s (IMD) daily district rainfall bulletins during June-Oct 2025.
In the tables below, the actual monthly rainfall is given in mm along with departure from normal for each month from June to Oct 2025 for each of the 7 districts of Bundelkhand in UP and 6 districts of Bundelkhand in MP. In separate table, the cumulative figures for actual rainfall during June-Oct 2025 period is given for each of the districts, along with departure from normal rainfall.
UTTAR PRADESH
| June 2025 | July 2025 | Aug 2025 | Sept 2025 | Oct 2025 | ||||||
| District | Actual Rainfall, mm | % departure | Actual Rainfall, mm | % departure | Actual Rainfall, mm | % departure | Actual Rainfall, mm | % departure | Actual Rainfall, mm | % departure |
| Banda | 119.8 | 14 | 596.8 | 147 | 232.7 | -13 | 123.5 | -20 | 109.3 | 308 |
| Chitrakoot | 139.3 | 25 | 449.6 | 77 | 359.3 | 37 | 112 | -29 | 75.5 | 114 |
| Hamirpur | 164.6 | 96 | 497.2 | 112 | 332.3 | 35 | 175.5 | 22 | 129.6 | 344 |
| Jalaun | 89.9 | 34 | 338.5 | 52 | 159.9 | -28 | 97.7 | -25 | 168.5 | 462 |
| Jhansi | 151.6 | 70 | 353.1 | 43.4 | 112 | -54 | 46.3 | -67 | 83.5 | 200 |
| Lalitpur | 202.6 | 80 | 652.7 | 145 | 201.9 | -30 | 122.3 | -11 | 74.8 | 213 |
| Mahoba | 160.6 | 132 | 481.6 | 147 | 160.7 | -29 | 71.4 | -34 | 111.9 | 435 |
| June-Oct 2025 | ||
| District | Actual Rainfall, mm | % departure |
| Banda | 1182.1 | 49 |
| Chitrakoot | 1135.7 | 38 |
| Hamirpur | 1199.2 | 63 |
| Jalaun | 854.6 | 27 |
| Jhansi | 746.5 | -0.4 |
| Lalitpur | 1254.3 | 51 |
| Mahoba | 986.2 | 59 |
MADHYA PRADESH
| June 2025 | July 2025 | Aug 2025 | Sept 2025 | Oct 2025 | ||||||
| District | Actual Rainfall, mm | % departure | Actual Rainfall, mm | % departure | Actual Rainfall, mm | % departure | Actual Rainfall, mm | % departure | Actual Rainfall, mm | % departure |
| Datia | 101.4 | 24 | 525.7 | 107 | 125.6 | -53 | 105.3 | -25 | 76.9 | 171 |
| Chhatarpur | 236.4 | 104 | 773.8 | 164 | 183.5 | -48 | 152 | -15 | 39.2 | 12 |
| Damoh | 184.1 | 24 | 553.3 | 57 | 177.4 | -56 | 224 | 24 | 34.7 | 18 |
| Panna | 213.2 | 61 | 612.2 | 72 | 203.6 | -47.5 | 166.6 | -21 | 76 | 114 |
| Sagar | 169.7 | 7 | 619.1 | 75 | 205.7 | -46 | 163.7 | -5 | 30.7 | 18 |
| Tikamgar | 326.6 | 182 | 767.5 | 136 | 134.3 | -59 | 143.9 | -2 | 41.9 | 41 |
| June-Oct 2025 | ||
| District | Actual Rainfall, mm | % departure |
| Datia | 934.9 | 21 |
| Chhattarpur | 1384.9 | 42 |
| Damoh | 1173.6 | 5 |
| Panna | 1271.6 | 13 |
| Sagar | 1188.9 | 8.6 |
| Tikamgarh | 1414.2 | 50 |
From these figures from Indian Meteorological Department (IMD) it seems monsoon rainfall in Bundelkhand region this year was largely above normal. The IMD data shows that out of 13 districts in the region only Jhansi district (UP) had marginal below normal rainfall. Jhansi had the highest deficit % rainfall in August (-54%) and Sept (-67%) 2025.
All the 13 districts had above normal rainfall in June and July 2025. In Aug and Sept, most of the districts had below normal rainfall. In October, all the 13 districts had above normal rainfall.
In UP, the highest rainfall quantum in five months was in Lalipur at 1254.3 mm, 51% above normal. The highest surplus % among the 13 districts was in Hamirpur (UP), 63%. In MP, Tikamgarn had the highest district rainfall at 1414.2 mm rainfall, 50% above normal rainfall, also the highest among MP Bundelkhand districts.
High Rainfall Events During the SW monsoon, the Bundelkhand districts also saw some high rainfall district days (rainfall in a day in a district above 50 mm), the figures are given in table below for the number of such high rainfall district days in each of UP and MP Bundelkhand district in each of the monsoon months and in different high rainfall categories.
UTTAR PRADESH
| June | July | Aug | Sept | Oct | Total Number of events | |
| Banda | 0 | 3 (50-100 mm) 1 (150-200 mm) | 1 (50-100 mm) | 0 | 0 | 5 |
| Chitrakoot | 0 | 2 (100-150 mm) | 0 | 0 | 0 | 2 |
| Hamirpur | 0 | 2 (50-100 mm) | 0 | 0 | 0 | 2 |
| Jalaun | 0 | 0 | 0 | 0 | 1 (50-100 mm) | 1 |
| Jhansi | 0 | 1 (50-100 mm) | 0 | 0 | 0 | 1 |
| Lalitpur | 1 (50-100 mm) | 4 (50-100 mm) 1 (100-150 mm) | 0 | 0 | 0 | 6 |
| Mahoba | 0 | 2 (50-100 mm) | 0 | 0 | 0 | 2 |
| TOTAL | 1 | 16 | 1 | 0 | 1 | 19 |
MADHYA PRADESH
| June | July | Aug | Sept | Oct | Total Number of events | |
| Datia | 0 | 2 (50-100 mm) 1 (100-150 mm) | 0 | 0 | 0 | 3 |
| Chhattarpur | 0 | 2 (50-100 mm) 1 (100-150 mm) 1 (150-200 mm) | 0 | 0 | 0 | 4 |
| Damoh | 0 | 5 (50-100 mm) | 0 | 0 | 0 | 5 |
| Panna | 1 (50-100 mm) | 3 (50-100 mm) | 0 | 0 | 0 | 4 |
| Sagar | 0 | 4 (50-100 mm) | 0 | 0 | 0 | 4 |
| Tikamgarh | 1 (50-100 mm) | 3 (50-100 mm) 1 (100-150 mm) 1 (150-200 mm) | 0 | 1 (50-100 mm) | 0 | 7 |
| TOTAL | 2 | 24 | 0 | 1 | 0 | 27 |
Expectedly, maximum number of high rainfall district days have occurred in July 2025 in both states since the month saw highest rainfall in these districts.
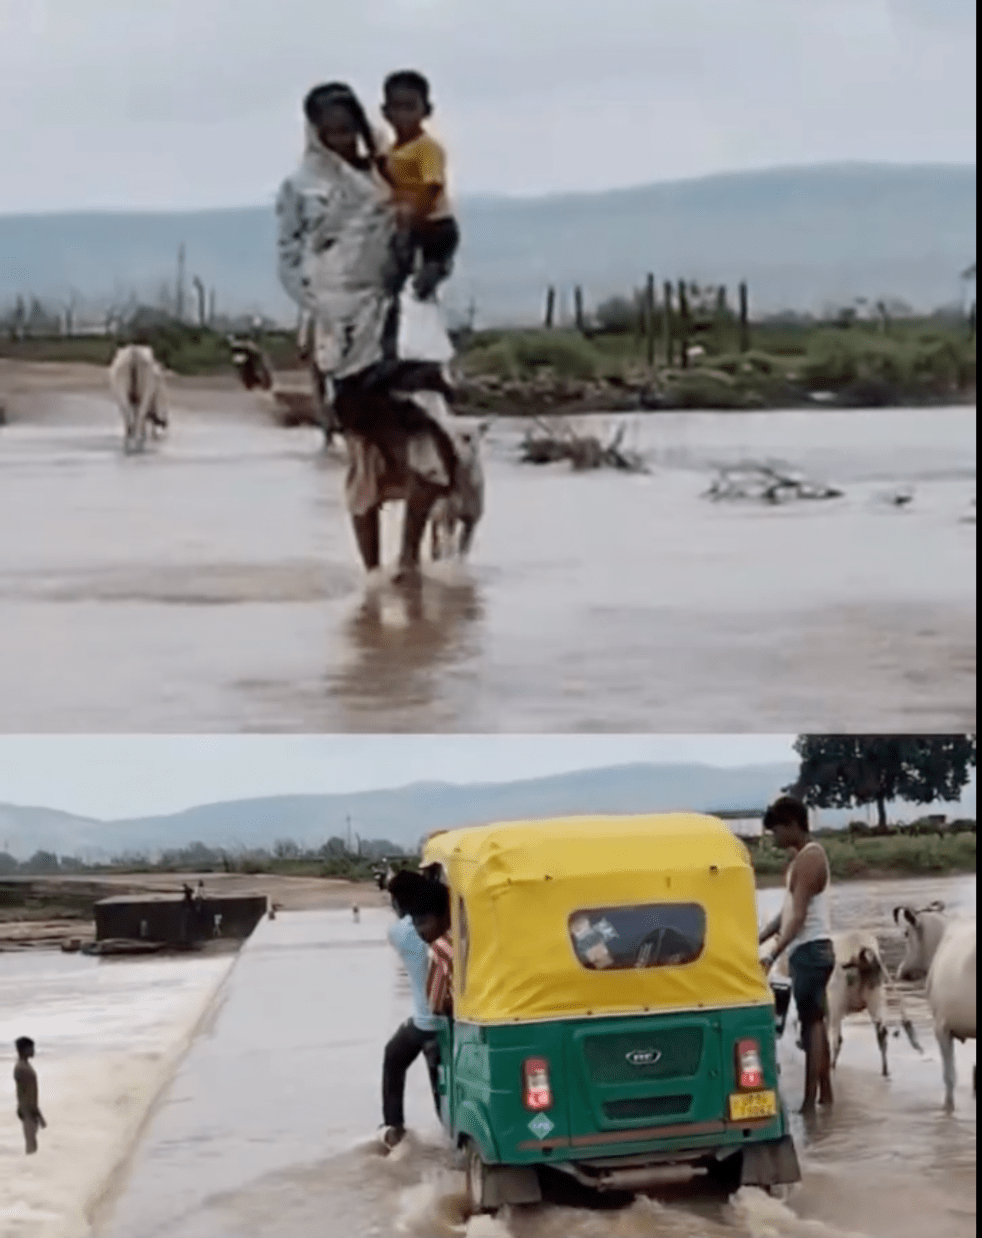
Floods in Bundelkhand in SW Monsoon 2025
In mid-July, there was news of crops getting destroyed in heavy rains in Bundelkhand. There was news of floods in Betwa, Chambal and Yamuna. In July end, Yamuna and Betwa rivers flooded in Hamirpur. The floods also led to submergence of crops in about 25 villages in Hamirpur district. In early August, about 20 villages faced floods in Chitrakoot district of UP. There was allegation by UP minister of simultaneous water release from MP dams water, increasing the flood intensity in all seven UP districts of Bundelkhand. However, no dam name was mentioned in the report, the allegation lacked basic supporting facts. Here, Mandakini river was in floods, leading to four wave of floods, over a hundred shops faced submergence.
Information about some of the rivers in these Bundelkhand districts crossing or coming close to the Highest Flood Levels is given in tables below.
Rivers crossing HFL in 2025
| SN | Site/ River | District/ State | Old HFL/ Date | New HFL/ Date | Rise/ Duration/ Year |
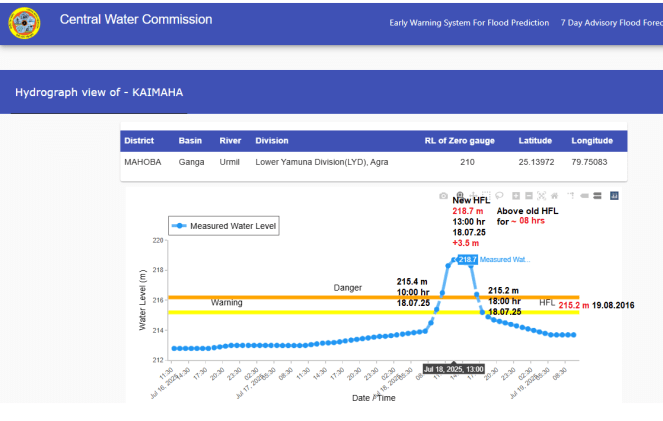
| 1 | Kaimaha/ Urmil | Mahoba/ Uttar Pradesh | 215.2 m/ 19.08.2016 | 218.7 m/ 13:00 hr/ 18.07.2025 | 3.5 m/ ~08 hrs/ 9 yrs |
| 215.2 m/ 16.08.2008 | |||||
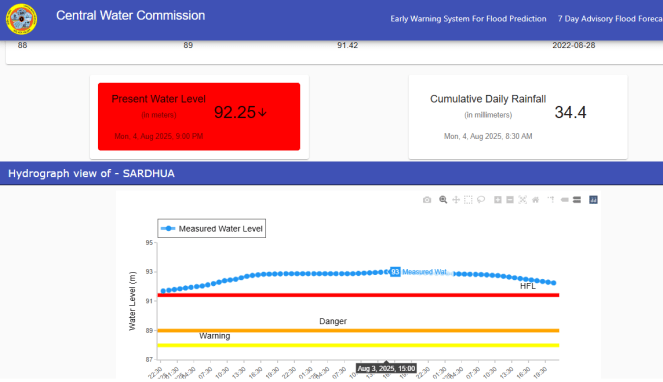
| 2 | Sardhua/ Paisuni | Chitrakoot/ Uttar Pradesh | 91.42 m/ 28.08.2022 | 93 m/ 15:00 hr/ 03.08.2025 | +1.58 m/ ~85 hrs/ 03 yrs |
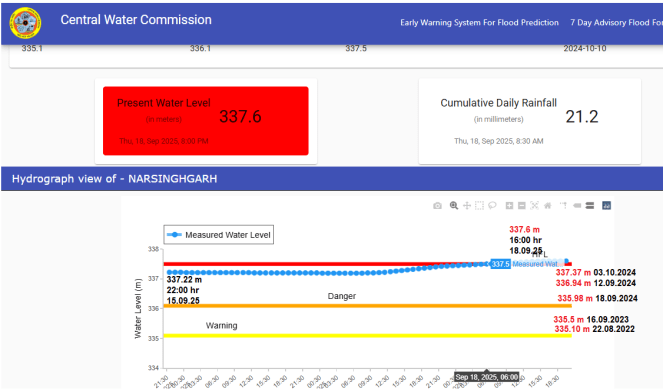
| 3 | Narsinghgarh/ Sonar | Damoh/ Madhya Pradesh | 337.5 m/ 10.10.2024 | 338.01 m/ 12:00/ 28.09.2025 | + 0.51 m/ 18.09.2025 onwards/ 01 yr |
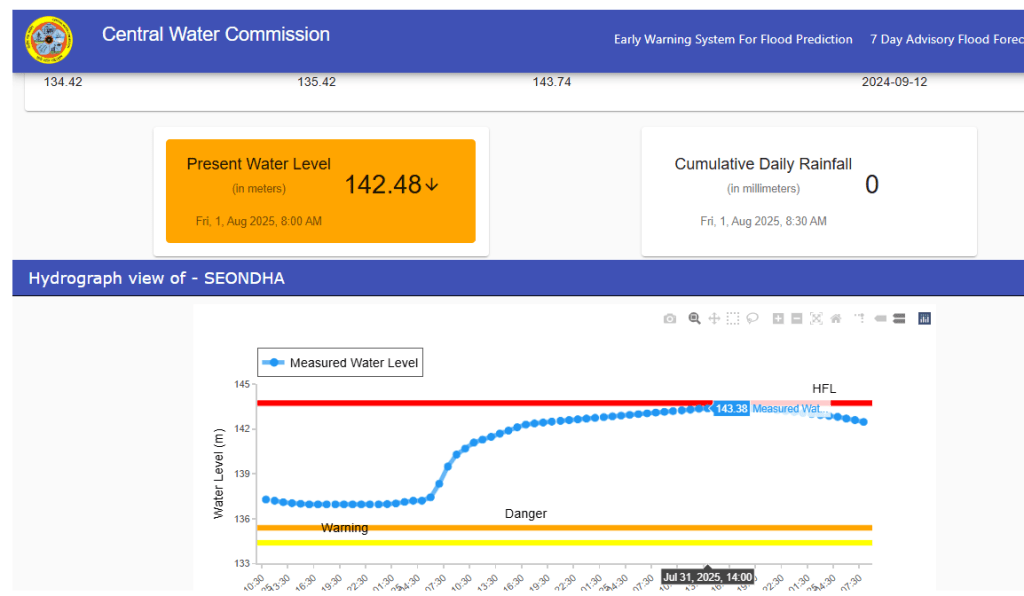
Rivers reaching close to HFL in 2025
| SN | River/ Site | District/ State | HFL/ Date | Peak Level/ Date | Gap |
| 1 | Seondha/ Sind | Datia/ Madhya Pradesh | 143.74 m/ 12.09.2024 | 143.38 m/ 14:00 hr/ 31.07.2025 | -0.36 m |
In Conclusion It is clear that the rainfall in Bundelkhand this year was significantly above normal, this is the best rainfall since 2018, it seems. However, this excess rainfall is unlikely to be useful for Bundelkhand considering the degraded catchments, with silted or destroyed local water bodies, wetlands, forests and adversely affected groundwater recharge systems.a What is urgently required is local water harvesting structures so that the rain is harvested and maximum amount is stored in soil moisture, local surface water bodies and recharged into groundwater. Unfortunately, the governments of Madhya Pradesh, Uttar Pradesh and the Government of India is pushing dubious and destructive projects like the Ken Betwa River Link, rather than quickly ensuring works that would help harvest the rain that falls here.
SANDRP
