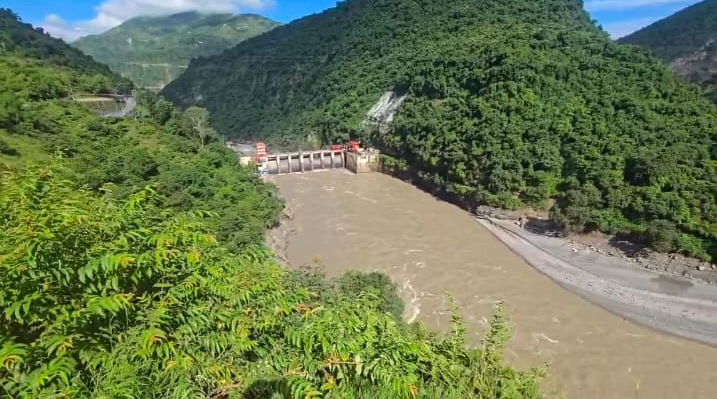
(Feature Image: Ichari (Koti) Dam on Tons river in Dehradun in empty condition in first week of Sept. 25)
In the South West Monsoon 2025, the Yamuna river witnessed 3 flood spells in a span of two weeks between Aug. 17 and Sep 1. In the first and medium scale flood spell, hourly discharges crossed 1 lakh cusecs for 12 hours on Aug 17 and 1,78,996 cusecs flood was recorded at 16 hour at Hathnikund Barrage (HKB), in Yamuna Nagar, Haryana.
In the second and low scale flood spell, river received above 50,000 cusecs discharges for 21 hours on Aug. 29 with the peak volume of 83,774 cusecs at 16 hour. In the final and first high scale flood spell, hourly water volume in the river crossed 1 lakh cusecs for about 129 hours beginning at 4.00 hour on Sep 1 till 12:00 hour on Sep 5, and 3,29,313 lakh cusecs was recorded as peak flood volume at 9:00 hour on Sep 1.
There are two big dams Ichari on Tons and Vyasi on Yamuna and three barrages – Dakpathar on Yamuna, Asan on Asan river and Jateon barrage on Giri river in Yamuna basin in Himalayan segment which have potential to influence the natural flooding pattern of the river.
With the help of available data of these dams during above mentioned flood spells, we try to understand whether these dams controlled or aggravated flood situation in the river in this monsoon season. The hourly discharges for the three barrages are not in public domain hence their specific role in managing Yamuna floods cannot be reviewed.
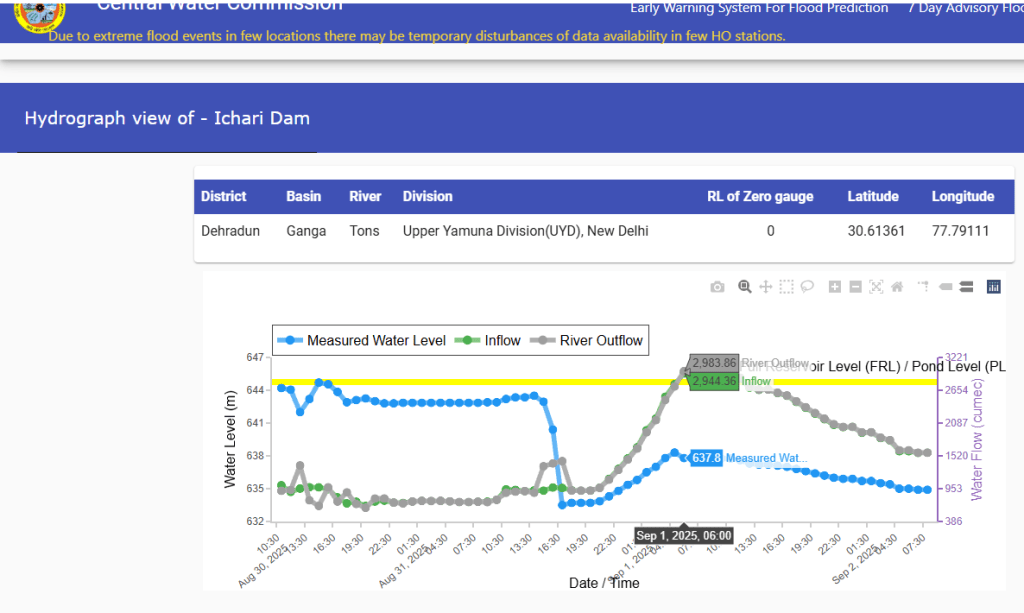
Ichari Dam: The 59.4 meter high and 155 long concrete gravity dam is built in 1972 on Tons river about 32 km upstream of its confluence with Yamuna in Dehradun, Uttarakhand. The dam also known as Koti dam has 3.159 MCM live storage and 4.681 MCM gross storage capacity. The water is first diverted into 6.2 km long tunnel for 240 Mw (4X60) Chibro hydroelectric power (HEP) project and then into 5.6 km long tunnel for 120 Mw (4X30) Khodri HEP.
The catchment area of dam is 4890 sq km. The maximum and full reservoir level (FRL) is 644.75 meter and minimum draw down level is 639.00 meter. The reservoir spread area at FRL 8 sq km. The original design peak flood capacity of the dam is 13,500 cumecs and the revised design peak flood capacity is 16,000 cumecs. The maximum observed flood peak at the dam is 5,683 cumec on Aug. 18, 2019. The basic feature of the dam can be seen in here.
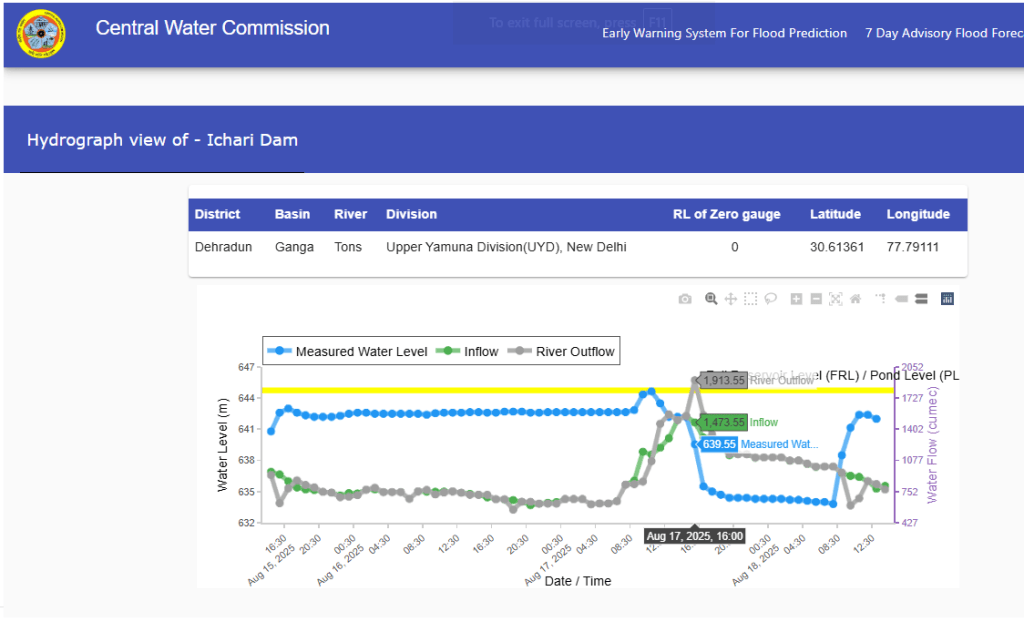
During the first medium scale flood in Yamuna on Aug. 17; the Ichari dam released 1145.51 cumces (40,453 cusecs) more water than inflows in the dam lowering the reservoir level by 10.25 meters in 10 hours. This suggests that the releases of impounded water from Ichari dam to some extent contributed in first flood spell in the river.
Then, before the second and low scale flood event in the river on Aug. 29, the dam authority namely the Uttarakhand Jal Vidyut Nigam Limited (UJVNL) twice – first on Aug. 24 and the on Aug. 26 – emptied the reservoir creating artificial floods in the river.
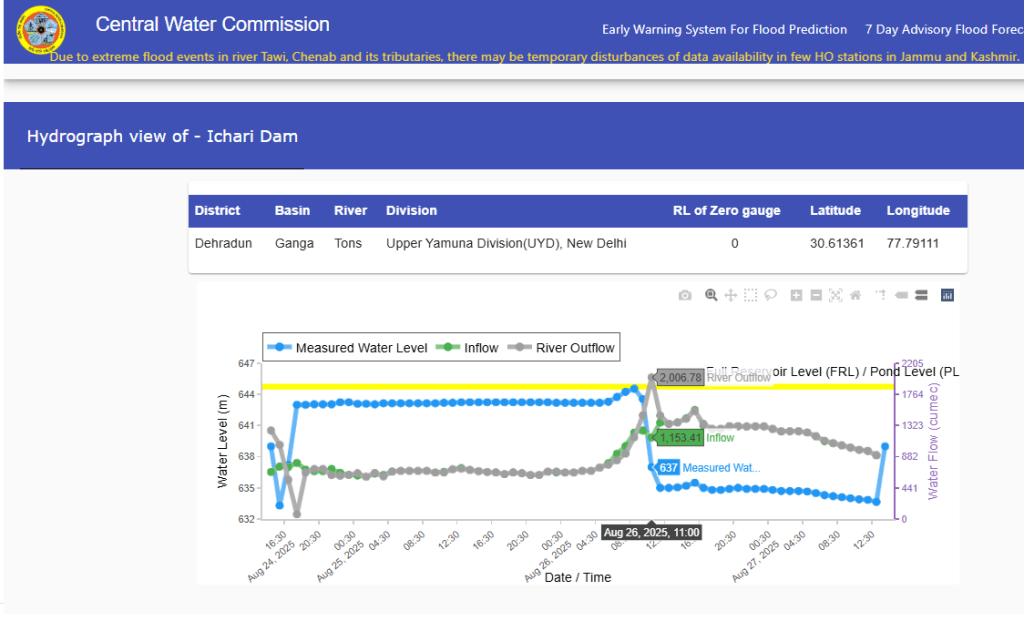
On Aug. 24, the dam released 894.97 cumecs (31,606 cusecs) more flood than inflows and lowered the pondage by 5.7 meters in just 2 hours and then within next 2 hours increased the reservoir level by 5.8 meters and released 908.98 cumces (~32,100 cusecs) less water in the river against the available flows. Then on Aug. 26, the dam authority released 1169.6 cumces (41,304 cusecs) more water than the inflows, reducing the reservoir level by 8.55 m in 3 hrs.
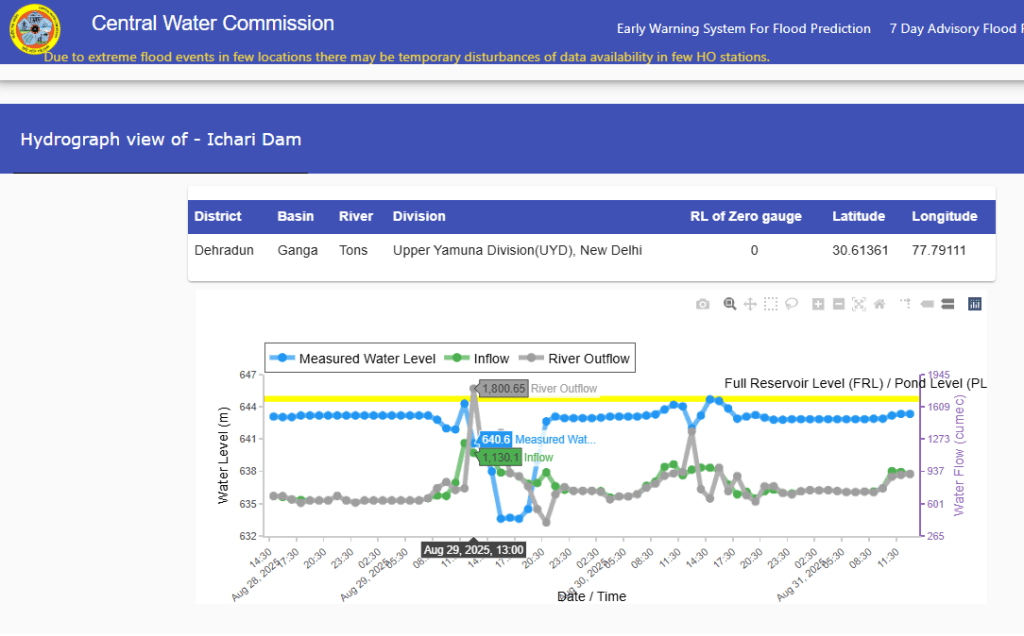
The dam released 2300.85 cumces (81,254 cusecs) more water than the inflows lowering reservoir level by 9.45 meters just in 3 hours on Aug. 31. This shows the dam contributed in increasing the flood volume in the river before the high scale flood spell on Sep 1. The table below shares the water discharge data from Ichari dam before the flood spells in Yamuna. The data is taken from Central Water Commission (CWC) Flood Forecast website. (WL means Measured Water Level; In/Out Flows in Cumecs).
Yamuna Flood 2025: Ichari (Koti) Dam Discharge Details
| 17.08.25 | Time | WL | Inflow | Outflow |
| 11:00 Hr | 644.65 | 1137.83 | 1069.83 | |
| 12:00 Hr | 643.50 | 1210.35 | 1459.35 | |
| 13:00 Hr | 642.20 | 1308.62 | 1557.52 | |
| 14:00 Hr | 642.20 | 1497.84 | 1497.84 | |
| 15:00 Hr | 642.20 | 1540.32 | 1540.32 | |
| 16:00 Hr | 639.55 | 1473.55 | 1913.55 | |
| 17:00 Hr | 635.50 | 1315.63 | 1548.63 | |
| 18:00 Hr | 635.00 | 1326.01 | 1347.80 | |
| 19:00 Hr | 634.70 | 1232.59 | 1243.00 | |
| 20:00 Hr | 634.40 | 1131.34 | 1141.75 | |
| 24.08.25 | 15:00 Hr | 639.00 | 666.04 | 1253.29 |
| 16:00 Hr | 633.30 | 743.24 | 1050.96 | |
| 17:00 Hr | 637.20 | 737.19 | 555.94 | |
| 18:00 Hr | 643.00 | 794.33 | 66.6 | |
| 26.08.25 | 10:00 Hr | 643.55 | 1252.88 | 1468.87 |
| 11:00 Hr | 637.00 | 1153.41 | 2006.78 | |
| 12:00 Hr | 635.00 | 1365.87 | 1466.11 | |
| 31.08.25 | 15:00 Hr | 642.95 | 918.97 | 2339.37 |
| 16:00 Hr | 640.40 | 972.70 | 1389.48 | |
| 17:00 Hr | 633.50 | 965.28 | 1428.95 |
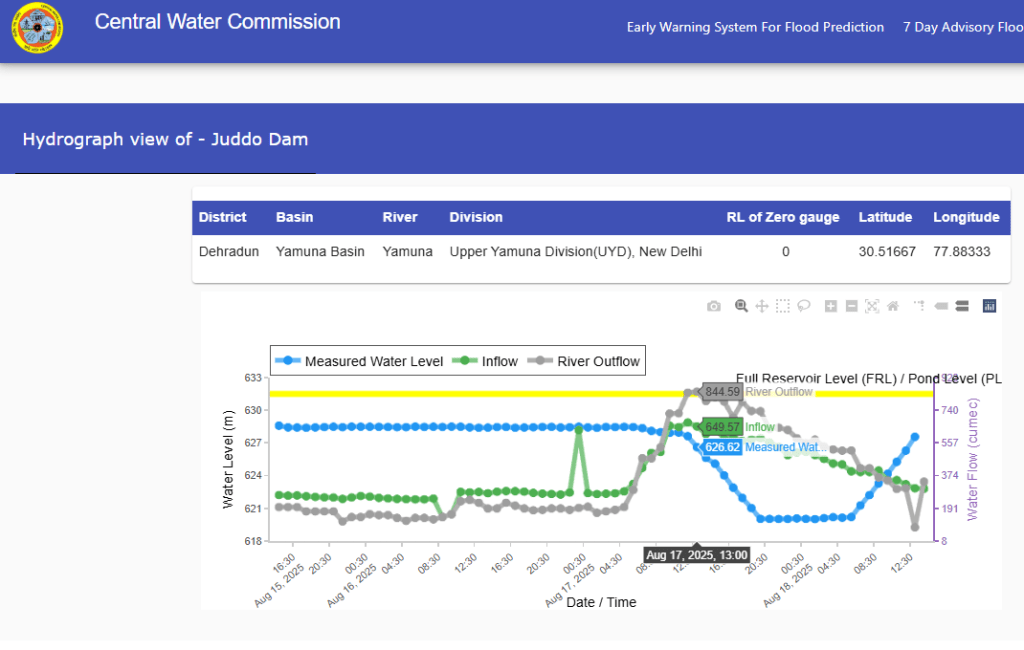
Vyasi Dam: The 86 meters high concrete gravity dam is built and managed by UJVNL as part of 120 Mw (2X60) Vyasi HEP in Vikas Nagar tehsil of Dehradun. Since, the dam site of the project is near Juddo village, the CWC has mentioned it as Juddo dam. The Vyasi HEP project costing ₹1916.79 cr became operational in May 2022. The dam is designed to divert 119.78 cumecs of water into 2.7 km long tunnel to produce power. It has 631.5 meters FRL and 59.89 cumces rated discharge capacity. Though the official figure on its design discharge, gross and live storage capacity is unavailable, the dam has 13.69 MCM gross storage capacity. The salient feature of the project can be seen here.
The water release pattern of Vyasi dam was found to be different than Ichari dam. During first medium scale flood on Aug. 17, it released 2145.37 cumecs (~75,763 cusecs) more water than available inflows and lowered the reservoir level by 7.92 meters in 16 hours. Thus it appears, the discharges added into the flood volume during first medium scale flood in the river.
Next day Aug. 18, the authority discharged 518.86 cumces (~18,323 cusecs) more water in first 8 hours while increasing the reservoir levels by 2.15 meters. But for next 5 hours on Aug. 18, the dam released 371.58 cumces (~13,122 cusecs) less water than available inflows and further increased the reservoir level by 4.28 meters.
In the next 7 hours same day the dam released 160.77 cumces (~5,578 cusecs) less water than available inflows while slightly lowering the pondage level. This suggests the discharges of stored water from the dam increased the flood level in the river.
On Aug. 24, the dam released 850.3 cumecs (~30,028 cusecs) less water than available inflows while increasing the reservoir levels by 2.81 meters in 10 hours. From Aug. 25 to 31 there were significantly lower discharges from the dam than the available inflows. This indicates moderate inflows in the Vyasi dam during second flood spell in Yamuna and the dam stored more water than it released in the river compromising the natural flooding pattern of the river.
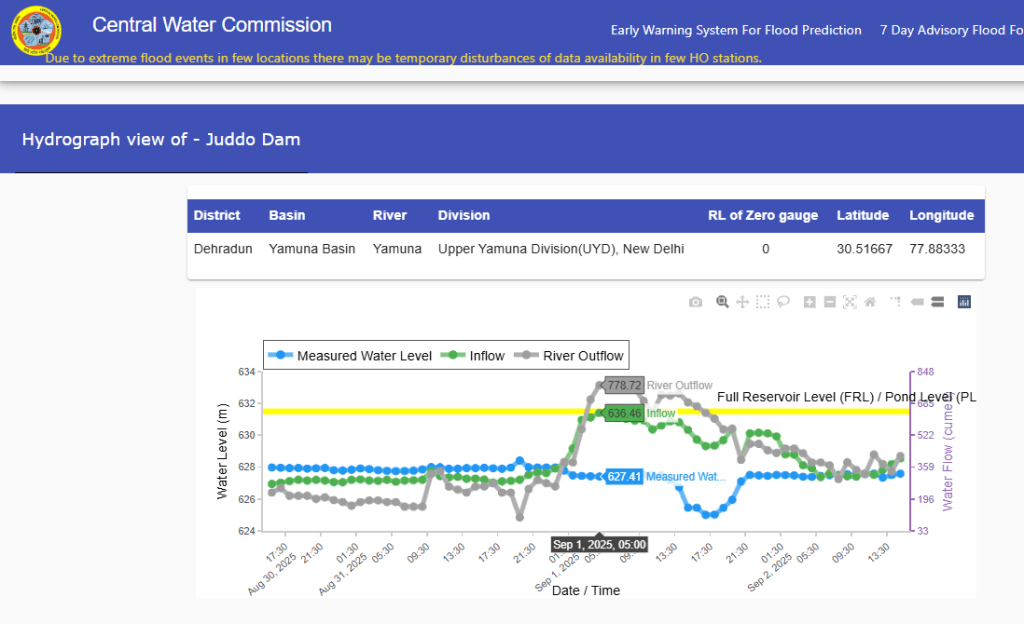
On Sept. 01, the dam released 2153.13 cumces (~76,037 cusecs) more water than inflows in while lowering the reservoir level by 1.48 meters in 21 hours. Then on Sept. 02, the dam released 482.05 cumecs (~17,023 cusecs) more water against the inflows and lowered the pondage level by just 0.16 meter in 12 hours.
This shows the releases of stored water from Vyasi dam added into flood volume of Yamuna river during high flood spell in the river in first week of Sept. 2025. The details of water discharge and holding by the dam during flood spells in Yamuna can be seen below.
Yamuna Flood 2025: Vyasi (Juddon) Dam Discharge Details
| Time | WL | Inflow | Outflow | |
| 17.08.25 | 09:00 Hr | 627.99 | 506.54 | 532.37 |
| 10:00 Hr | 627.92 | 653.86 | 721.46 | |
| 11:00 Hr | 627.95 | 645.57 | 722.83 | |
| 12:00 Hr | 627.62 | 671.38 | 838.53 | |
| 13:00 Hr | 626.62 | 649.57 | 844.59 | |
| 14:00 Hr | 625.62 | 606.49 | 791.64 | |
| 15:00 Hr | 625.09 | 633.13 | 811.10 | |
| 16:00 Hr | 624.02 | 581.34 | 789.01 | |
| 17:00 Hr | 622.90 | 590.33 | 699.85 | |
| 18:00 Hr | 621.96 | 568.61 | 787.20 | |
| 19:00 Hr | 621.02 | 576.73 | 736.12 | |
| 20:00 Hr | 620.03 | 584.22 | 734.35 | |
| 21:00 Hr | 620.03 | 559.82 | 635.58 | |
| 22:00 Hr | 620.02 | 535.21 | 642.40 | |
| 23:00 Hr | 620.02 | 488.63 | 629.90 | |
| 24:00 Hr | 620.07 | 503.65 | 583.52 | |
| 18.08.25 | 01:00 Hr | 620.03 | 507.39 | 555.54 |
| 02:00 Hr | 620.01 | 489.29 | 575.26 | |
| 03:00 Hr | 620.01 | 467.26 | 536.66 | |
| 04:00 Hr | 620.19 | 441.84 | 520.13 | |
| 05:00 Hr | 620.14 | 436.81 | 513.97 | |
| 06:00 Hr | 620.20 | 398.03 | 514.76 | |
| 07:00 Hr | 621.27 | 394.32 | 415.9 | |
| 08:00 Hr | 622.22 | 394.32 | 415.9 | |
| 09:00 Hr | 623.28 | 402.60 | 364.77 | |
| 10:00 Hr | 624.17 | 348.62 | 299.60 | |
| 11:00 Hr | 625.27 | 348.89 | 304.15 | |
| 12:00 Hr | 626.30 | 325.47 | 304.15 | |
| 13:00 Hr | 627.56 | 303.22 | 084.55 | |
| 14:00 Hr | 628.08 | 301.14 | 339.99 | |
| 15:00 Hr | 627.97 | 310.11 | 347.17 | |
| 16:00 Hr | 627.99 | 287.48 | 301.71 | |
| 17:00 Hr | 627.99 | 290.89 | 323.63 | |
| 18:00 Hr | 627.95 | 300.26 | 323.32 | |
| 19:00 Hr | 627.95 | 300.92 | 307.72 | |
| 20:00 Hr | 627.98 | 299.74 | 307.77 | |
| 24.08.25 | 15:00 Hr | 625.18 | 285.47 | 389.57 |
| 16:00 Hr | 625.69 | 285.47 | 186.54 | |
| 17:00 Hr | 627.49 | 285.47 | 36.13 | |
| 18:00 Hr | 627.95 | 285.47 | 164.96 | |
| 19:00 Hr | 627.90 | 285.47 | 196.74 | |
| 20:00 Hr | 627.93 | 289.04 | 196.74 | |
| 21:00 Hr | 627.98 | 271.65 | 228.64 | |
| 22:00 Hr | 627.90 | 281.70 | 196.64 | |
| 23:00 Hr | 627.93 | 278.82 | 172.95 | |
| 24:00 Hr | 627.99 | 275.65 | 205.00 | |
| 01.09.25 | 04:00 Hr | 627.43 | 613.02 | 705.17 |
| 05:00 Hr | 627.41 | 636.46 | 778.72 | |
| 06:00 Hr | 627.48 | 623.56 | 778.72 | |
| 07:00 Hr | 627.39 | 610.61 | 758.92 | |
| 08:00 Hr | 627.51 | 606.24 | 758.94 | |
| 09:00 Hr | 627.59 | 596.83 | 758.94 | |
| 10:00 Hr | 627.53 | 596.83 | 698.10 | |
| 11:00 Hr | 627.49 | 552.02 | 637.15 | |
| 12:00 Hr | 627.48 | 571.91 | 728.82 | |
| 13:00 Hr | 627.20 | 592.84 | 725.27 | |
| 14:00 Hr | 626.75 | 588.89 | 735.90 | |
| 15:00 Hr | 625.45 | 549.81 | 690.26 | |
| 16:00 Hr | 625.45 | 500.07 | 670.57 | |
| 17:00 Hr | 625.00 | 466.98 | 636.62 | |
| 18:00 Hr | 625.02 | 469.29 | 607.26 | |
| 19:00 Hr | 625.44 | 497.21 | 552.11 | |
| 20:00 Hr | 625.95 | 552.11 | 556.34 | |
| 02.09.25 | 02:00 Hr | 627.50 | 424.67 | 454.52 |
| 03:00 Hr | 627.48 | 423.42 | 454.52 | |
| 04:00 Hr | 627.40 | 368.84 | 430.29 | |
| 05:00 Hr | 627.39 | 353.37 | 383.00 | |
| 06:00 Hr | 627.45 | 308.42 | 383.00 | |
| 07:00 Hr | 627.49 | 327.71 | 367.71 | |
| 08:00 Hr | 627.51 | 318.60 | 298.12 | |
| 09:00 Hr | 627.56 | 312.25 | 384.08 | |
| 10:00 Hr | 627.49 | 310.15 | 344.82 | |
| 11:00 Hr | 627.60 | 326.50 | 321.84 | |
| 12:00 Hr | 627.59 | 319.55 | 423.60 | |
| 13:00 Hr | 627.34 | 345.07 | 375.10 |
The analysis suggests that sudden discharges (possibly for silt flushing) from Ichari & Vyasi dams in Yamuna led to increased flow in the river downstream during some periods. The filling of dams then resulted in reducing the natural flow of the river.
It is not clear how many times these dams are undertaking flushing exercise. But the sudden releases by these dams adversely impacts river aquatic systems, destabilises riverbanks, damage and endanger lives and livelihoods of riverine people. However, these facts remain unaddressed in Environment Impact Assessment (EIA) and totally overlooked in periodic compliance reports.
The Ichari dam is about 75 km and Vyasi dam is about 80 km road distance from the HKB. We don’t know the exact time the releases from these dams are taking to reach the HKB. Roughly, it could be around 10-15 hours. Moreover, the discharges from both Ichari and Vyasi dams are controlled at Dakpathar barrage.
Secondly, the discharge data of the three existing barrages Dakpathar, Asan and Jateon is not in public domain, it is difficult to figure out to what extent these structures are aggravating the flood situation in the river.
Since, these dams, barrages have potential to turn a natural flood into disasters, their discharge data and operational procedures need to be in public domain in order to ensure their transparent and accountable operations during monsoon season.
SANDRP
Note: The full hourly discharge data from Ichari and Vyasi dams which we were able to document can be seen here.

Dams’ discharges likely worsened Yamuna Floods during 2025 monsoon: SANDRP https://www.counterview.net/2025/10/dams-discharges-likely-worsened-yamuna.html
LikeLike