
In the just concluded month of Aug 2024, India received just 295.2 mm (162.7 mm or 36.2% below normal in Aug 2023[i], 263.8 mm in Aug 2022, 3.5% above the normal[ii]) or 15.8% above normal rainfall of 254.9 mm as per India Meteorological department (IMD). In Aug 2021, the rainfall was 195.9 mm[iii], about 24.13% below normal and in Aug 2020, the rainfall was 327 mm[iv], or about 26.6% above normal.
June July Aug 2024 SW Monsoon rainfall across India was 749 mm, 7% above normal rainfall of 700.7 mm. June July 2024 SW Monsoon rainfall[v] across India was 453.8 mm, 1.8% above normal rainfall for this period of 445.8 mm. The month wise distribution of rainfall in SW Monsoon 2024 has been as follows.
| Actual Rainfall, mm | Normal Rainfall, mm | % difference | |
| June 2024 | 147.2 | 165.3 | -11.1 |
| July 2024 | 306.6 | 280.5 | +9.3 |
| Aug 2024 | 295.2 | 254.9 | +15.8 |
| June-Aug 2024 | 749 | 700.7 | 7 |
| July-Aug 2024 | 601.8 | 535.4 | 12.4 |
Wettest July Aug since 1994 The July Aug 2024 rainfall (TOI reports this as 599.7 mm, whereas as per IMD figures this should be 601.8 mm) is the highest since 1994, when 645.9 mm rainfall was recorded in these two months. Between 1901 and 1994, the 600 mark was breached in 28 years, that is once every 3.4 years, but since 1994, it has happened just once. TOI reports that a worrying long term trend shows rainfall in July-Aug has been decreasing.
Monsoon rainfall in July-Aug has averaged 530.2 mm in last thirty years during 1995-2024, which is much lower than the averages in previous 30 yr periods: 543 mm during 1965-1994; 587.1 mm in 1935-1964 and 559.3 mm in 1905-1934. One explanation is that the monsoon behaves in cyclical manner over epochs lasing around 30-40 years. We are currently moving into an epoch of higher rainfall. This hypothesis, however, may not work in era of climate change.
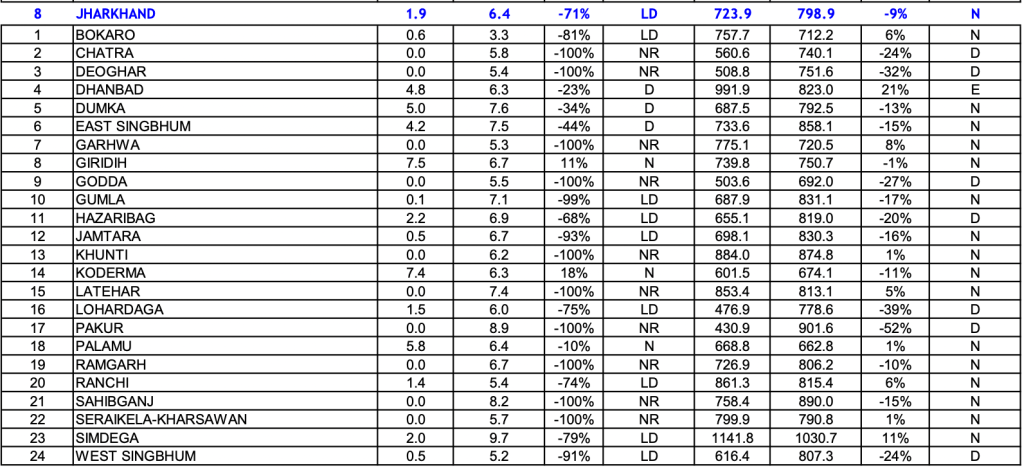
Roxy Matthew Koll, climate scientist at the Indian Institute of Tropical Meteorology says there are regions in India like UP-Jharkhand belt and Kerala for instance, which are showing a stark decline in rainfall in recent decades and this could be linked to climate change.
Power consumption falls in Aug 2024! In an interesting connected development, India’s power consumption declined by 4.7% to 144.2 BU in Aug compared to a year ago period. This, TOI says, is due to above normal rainfall across the country, leading to less power for cooling. The peak power demand met in Aug 2024 also contracted to 216.7 GW against 236.3 GW a year ago.
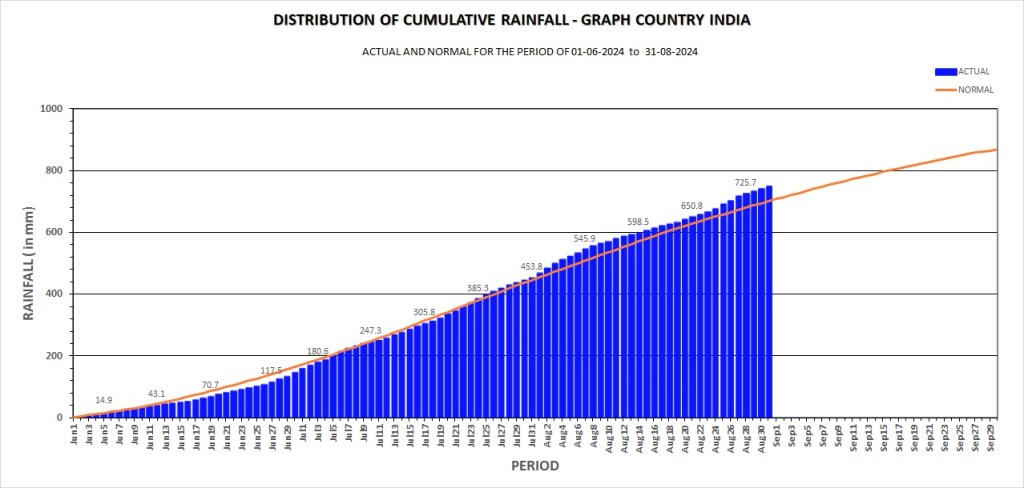
Region wise rainfall graphs The bar chart below is for the National Rainfall figure till Aug 31 2024.
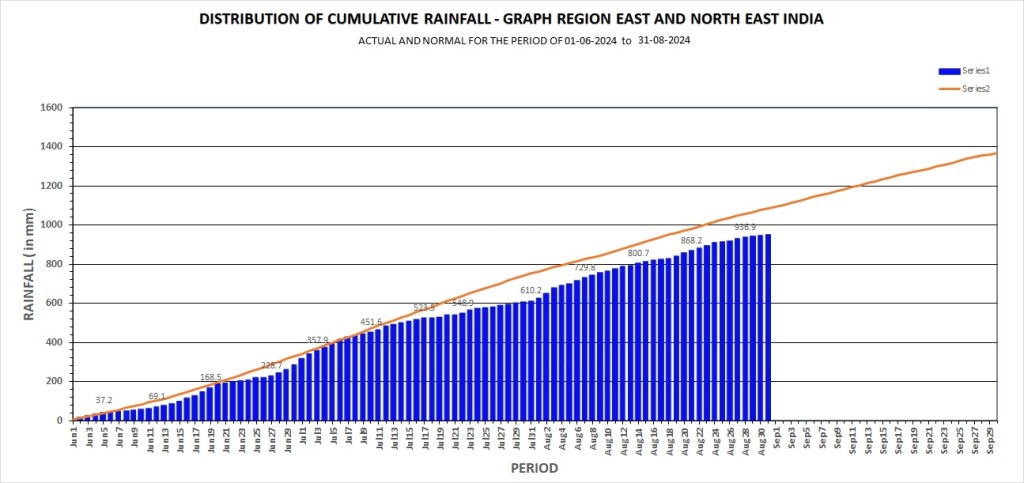
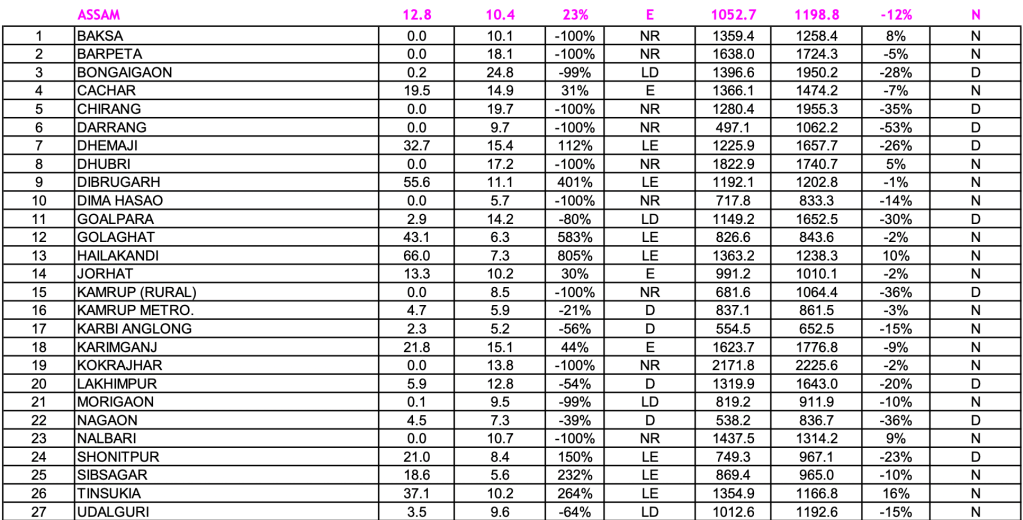
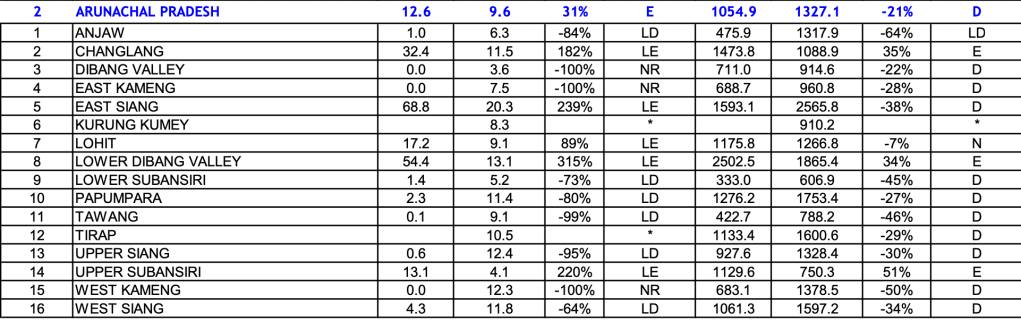
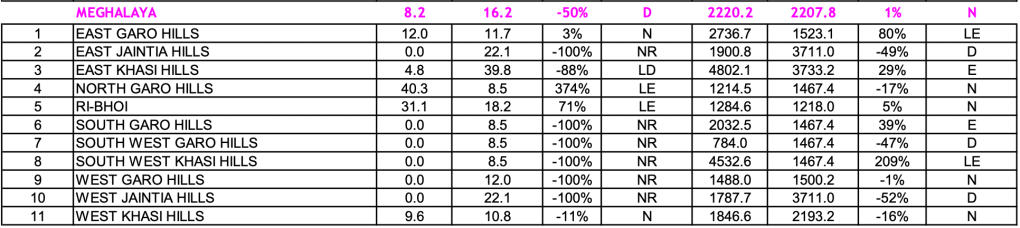
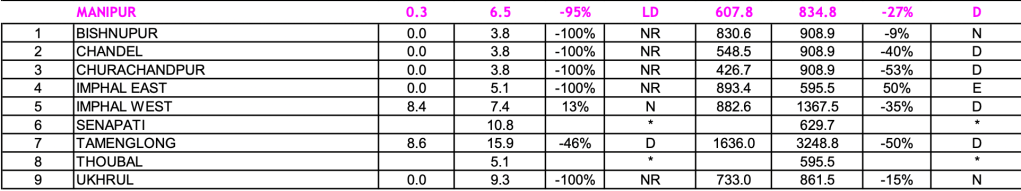
The IMD divides the country into four regions. As can be seen from the following graph, the East and North East India had below normal for June-Aug 2024, as was the case in 2023.
The North West India ended the three months period of June Aug 2024 with minor surplus, similar to the situation in 2023.

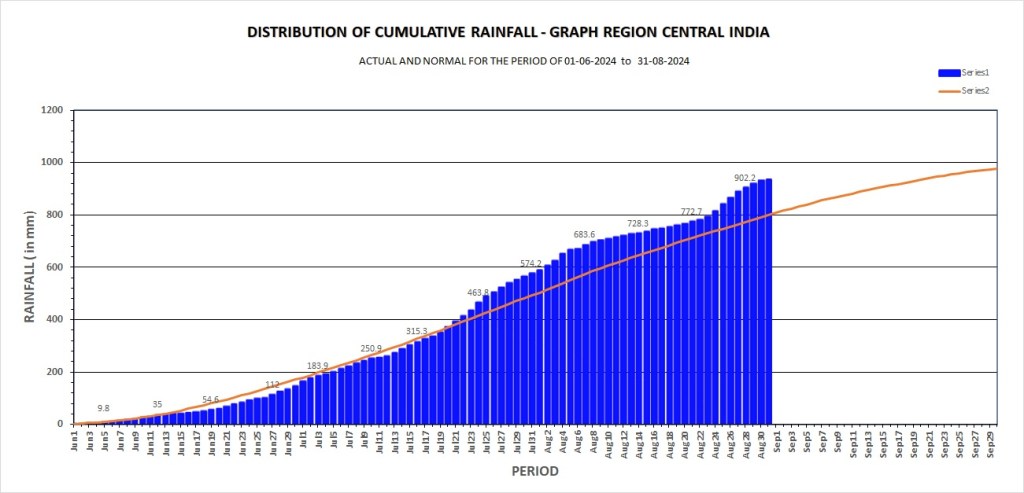
The Central India ended the June Aug 2024 period with significant surplus rainfall.
The South Peninsular India also ended the June Aug 2024 period with significant surplus rainfall, which was the case throughout the three months.

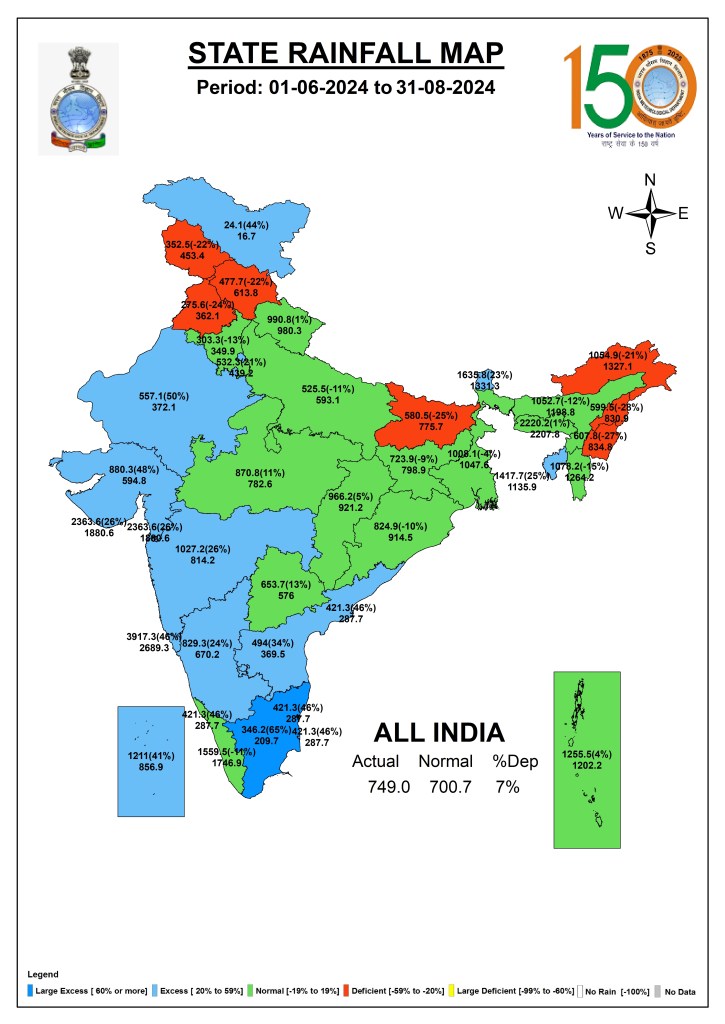
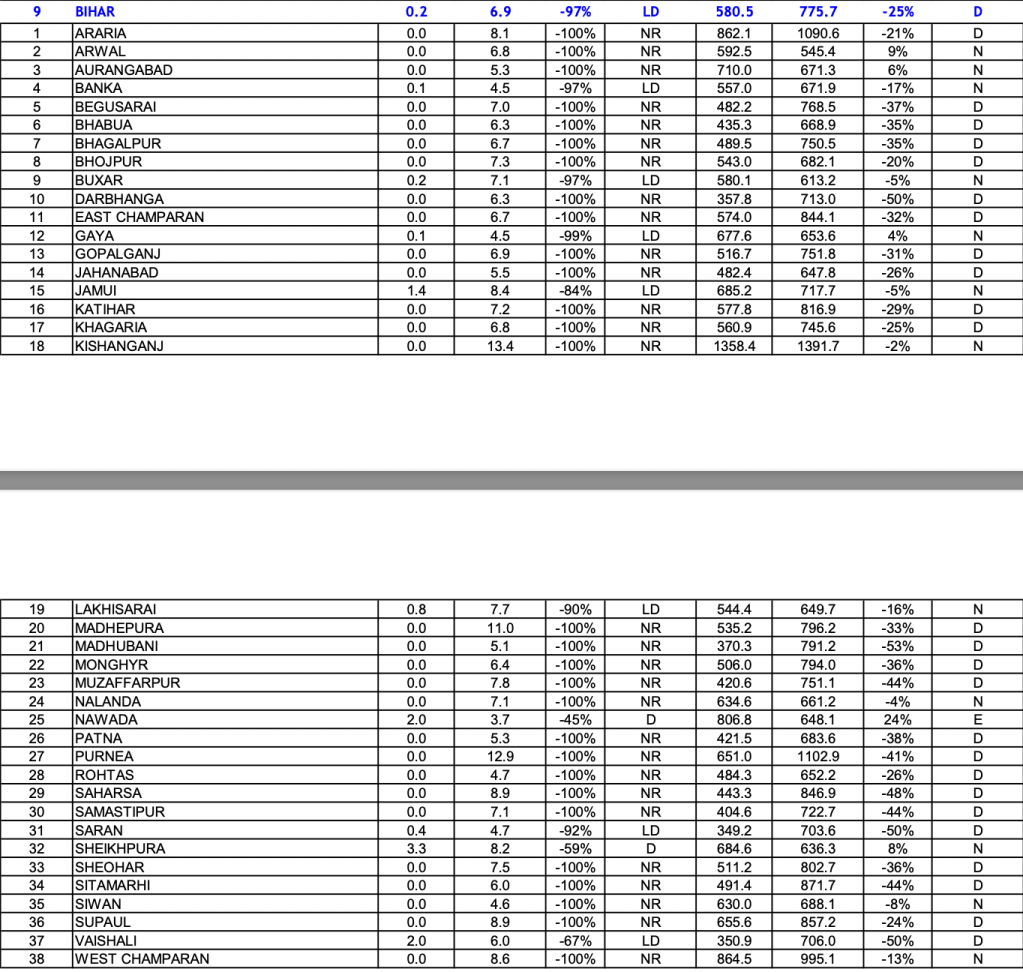
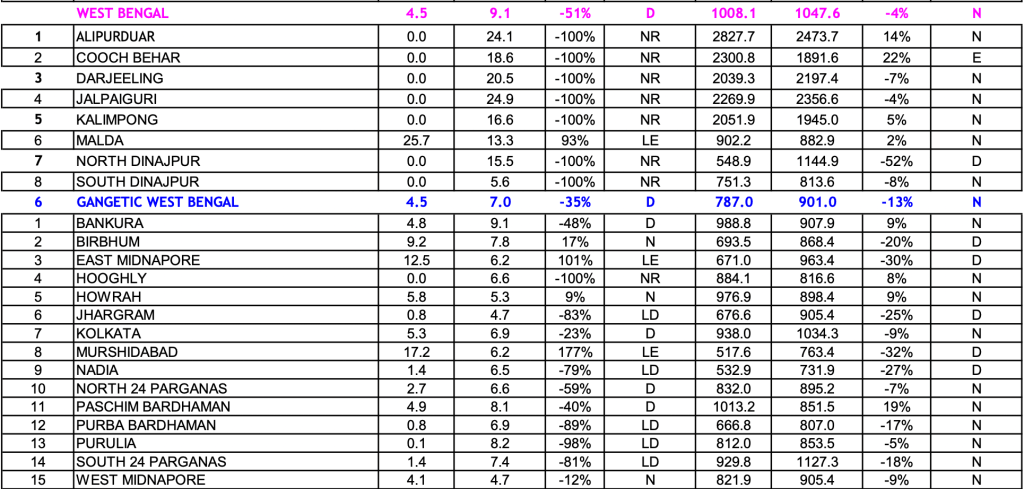
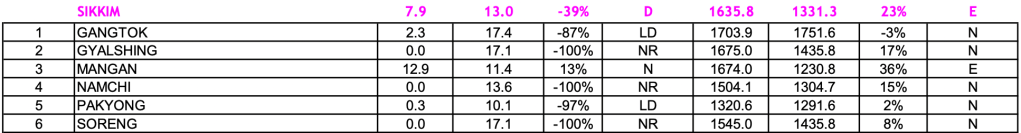
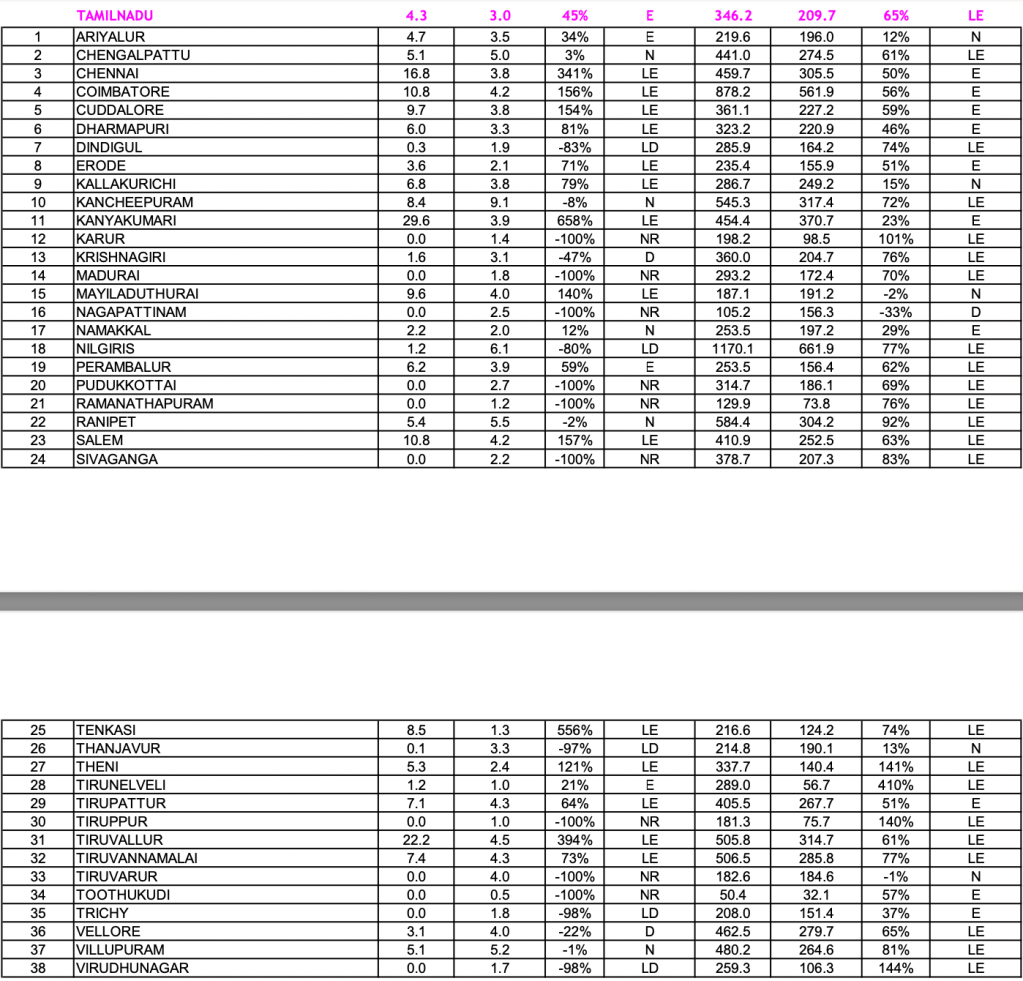
State wise rainfall As can be seen from IMD rainfall map for June-Aug 2024, only Tamil Nadu (65% excess) had large excess rainfall (above 60% surplus) in this period. Thirteen states and Union Territories (UTs) had Excess (rainfall 20-59% above normal) in this three month period. 14 states had normal rainfall with rainfall between 19% deficit and 19% surplus, while eight states (Bihar, Jammu and Kashmir, Punjab, Haryana, Chandigarh, Manipur, Arunachal Pradesh and Nagaland) had deficit rainfall with rainfall 20-59% below normal in these three months. Nagaland had the highest deficit at 28%. Goa had the highest rainfall at 3917.4 mm.
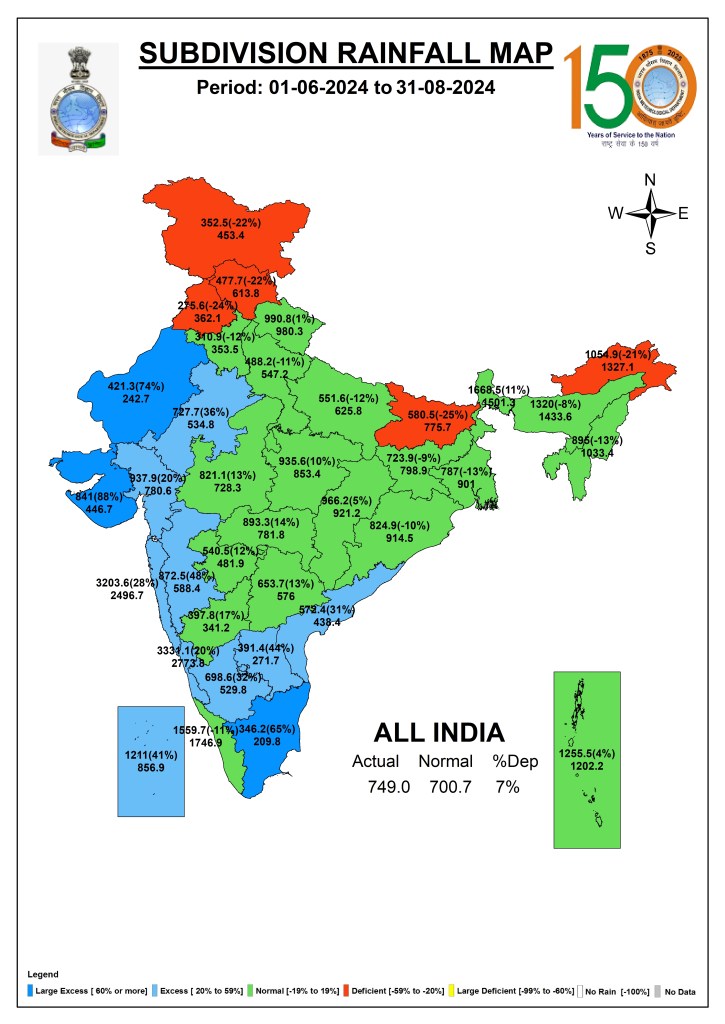
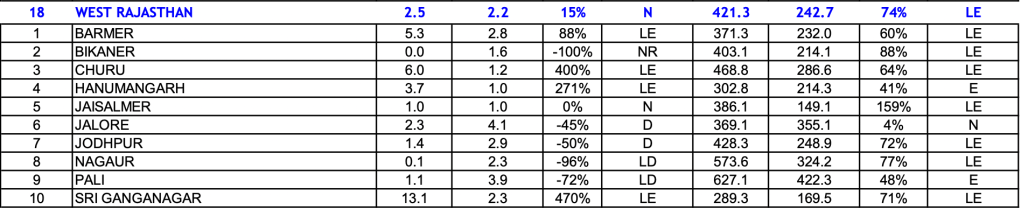
Sub-Division wise rainfall IMD rainfall map for sub-division wise rainfall, out of IMD’s 36 subdivisions, three (W Rajasthan, Saurashtra-Kutch, Tamil Nadu-Puducherry-Karaikal) had Large Excess rainfall during June Aug 2024. It is interesting to note that all three sub divisions having large excess rainfall are low rainfall regions, out of them the drought prone W Rajasthan and Saurasthra-Kutch also had excess rainfall in the same period in 2023. Nine subdivisions had Excess rainfall during June Aug 2024. 19 sub divisions had normal rain, while five sub divisions (Jammu-Kashmir-Ladakh), Punjab, Himachal Pradesh, Bihar and Arunachal Pradesh) had Deficit rainfall. The Highest deficit was 25% for Bihar. Highest surplus was 88% in Saurashtra-Kutch, the same region also had the highest surplus in the same period last year. The Highest rainfall was 3331.1 mm in Coastal Karnataka.
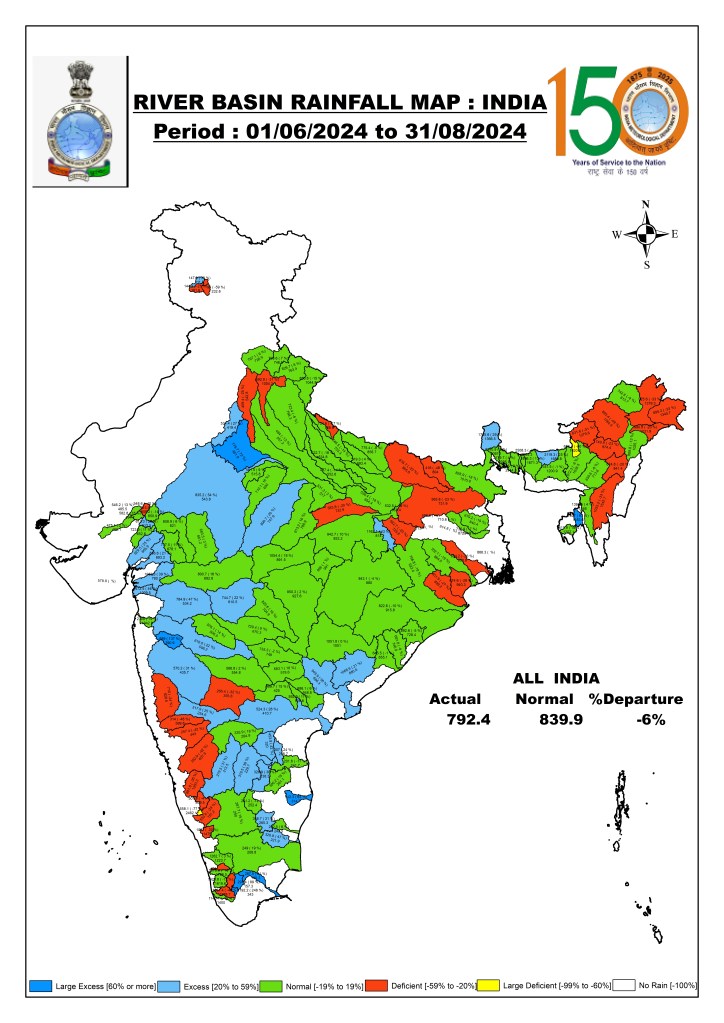
River Basin wise rainfall IMD also provides river basin wise rainfall map. As can be seen from the map, IMD reports no rainfall even bigger area this year than what it reported till last year. This is clearly an impossibility. It is this kind of anomalies that raise questions about seriousness and accuracy of IMD’s river basin wise rainfall figures, which are actually most important for forecasting floods and reservoir inflows.
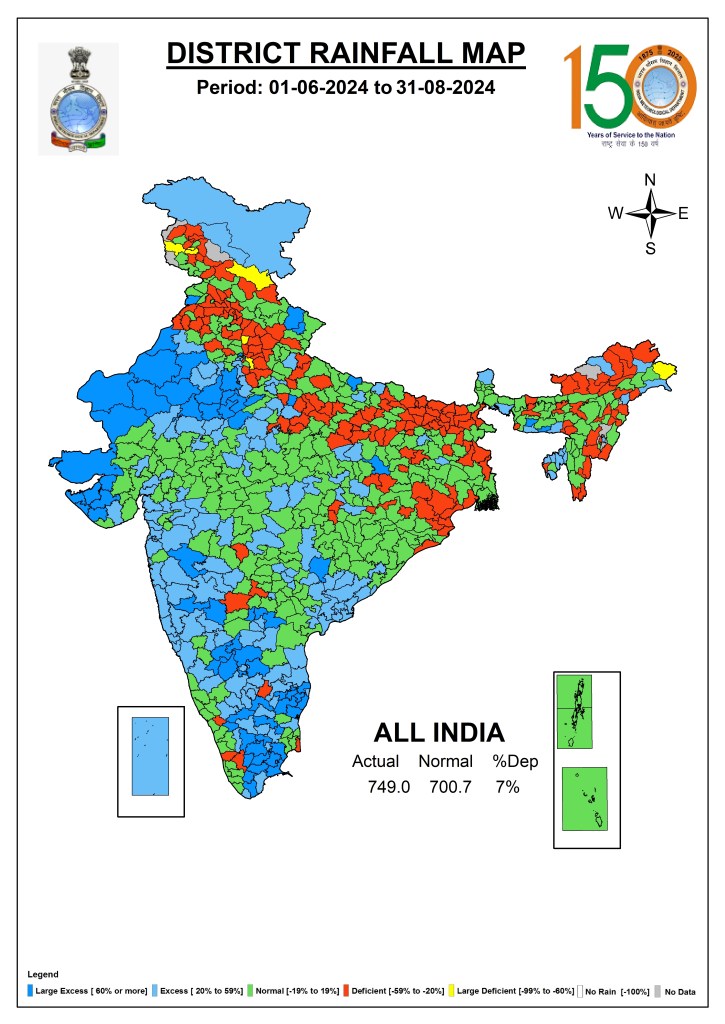
DISTRICT WISE STATE WISE RAINFALL IMD also provides a map with all the district boundaries and rainfall category as we can see above.
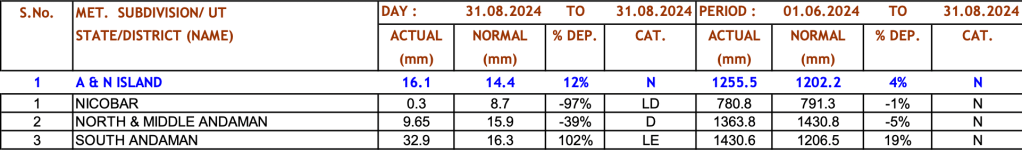
ISLANDS: Andaman & Nicobar
Lakshadweep

NORTH INDIA: Jammu & Kashmiar

Ladakh

Himachal Pradesh

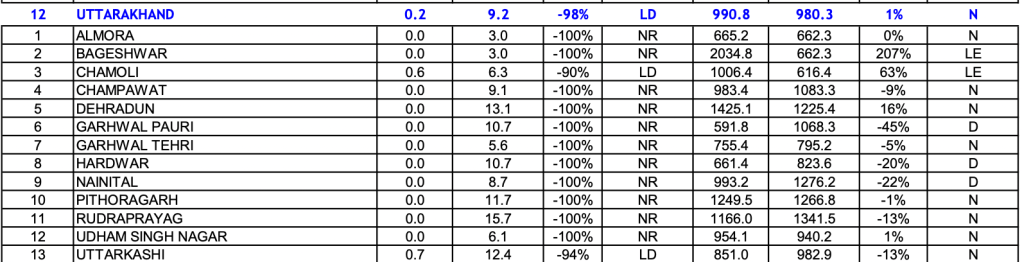
Uttarakhand
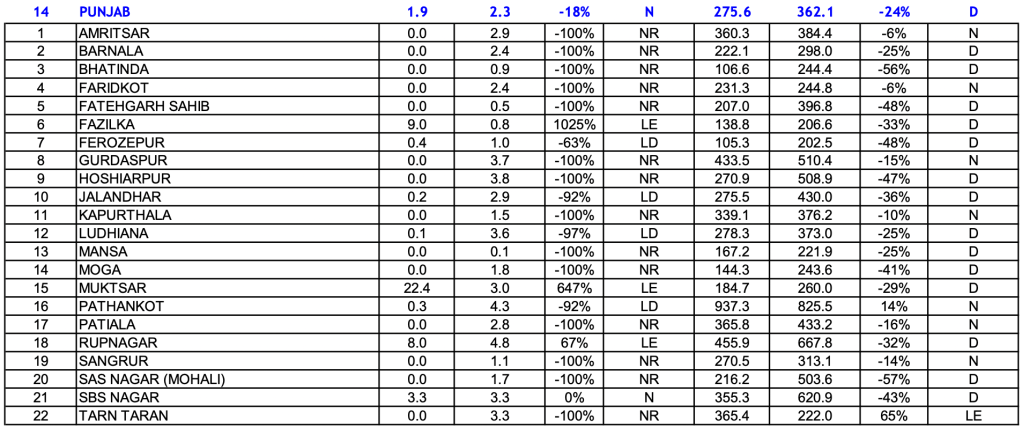
Punjab
Chandigarh

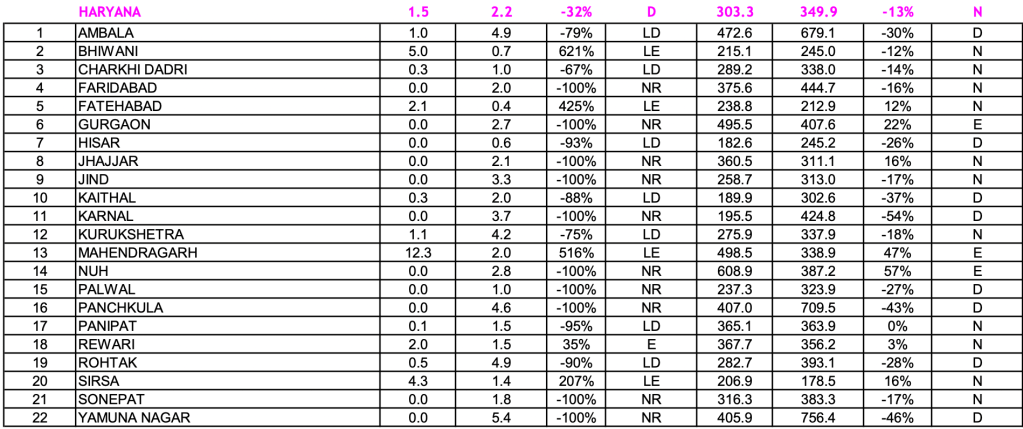
Haryana
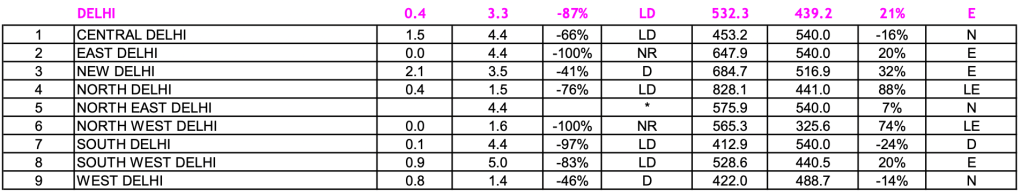
Delhi
EAST INDIA: Uttar Pradesh


Bihar
W Bengal
Jharkhand
Odisha

NORTH EAST INDIA: Sikkim
Assam
Arunachal Pradesh
Meghalaya
Manipur
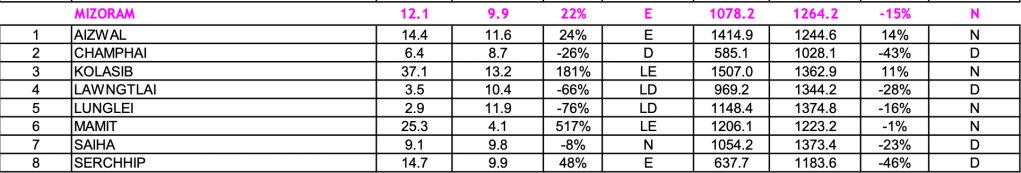
Mizoram
Nagaland

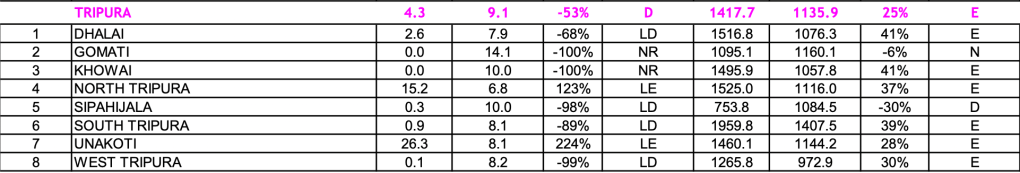
Tripura
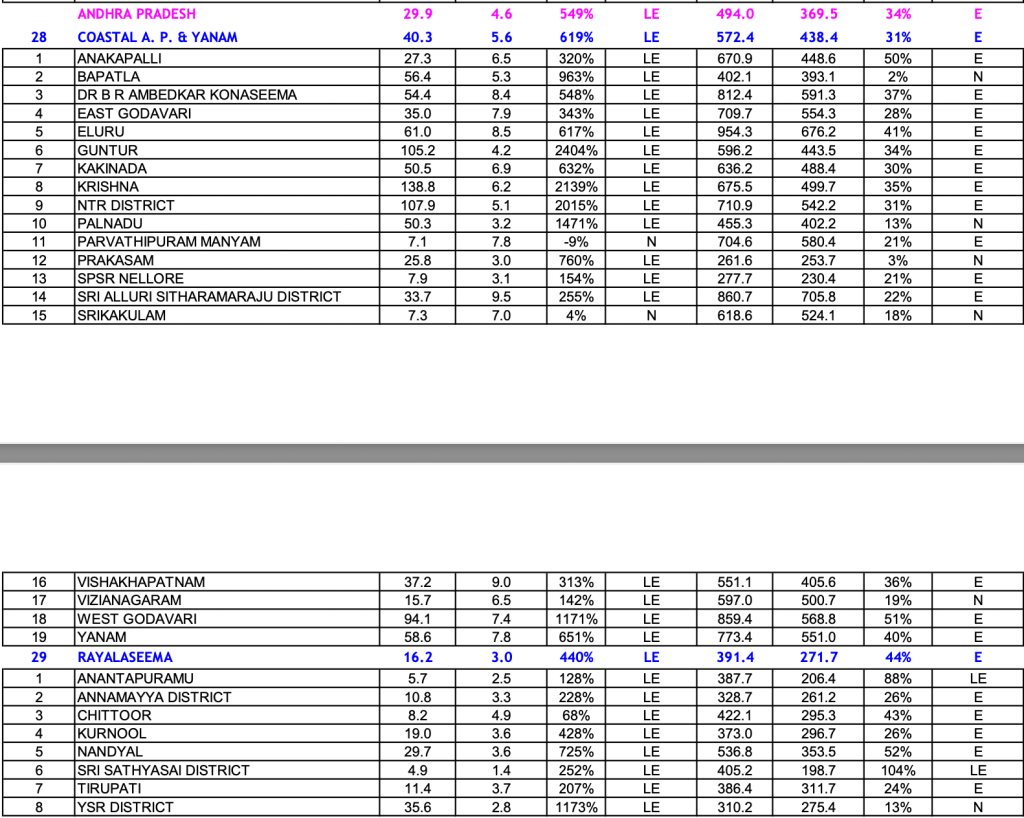
SOUTH INDIA: Andhra Pradesh
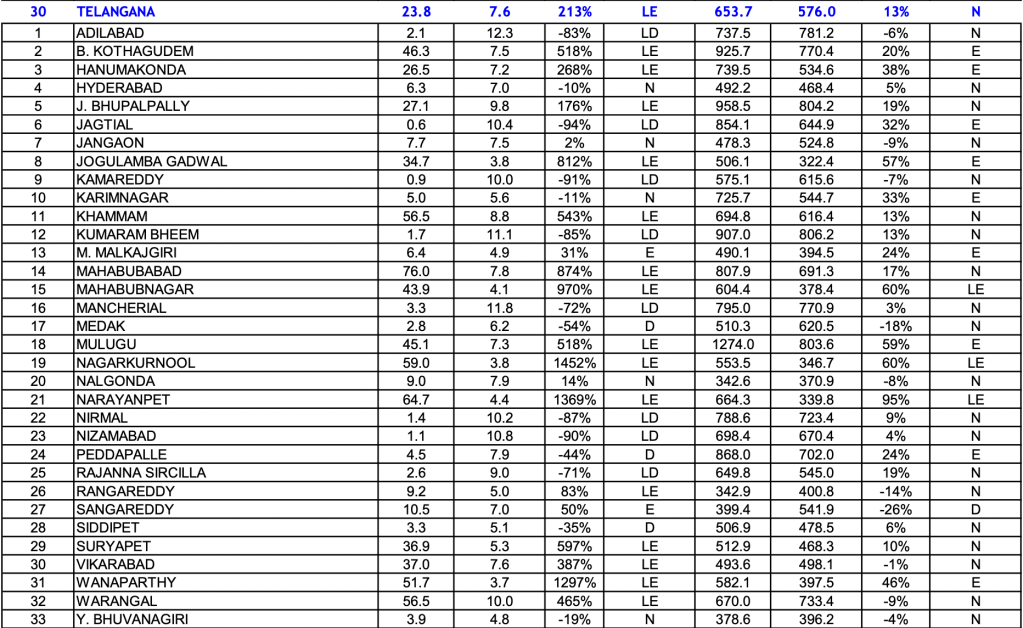
Telangana
Karnataka
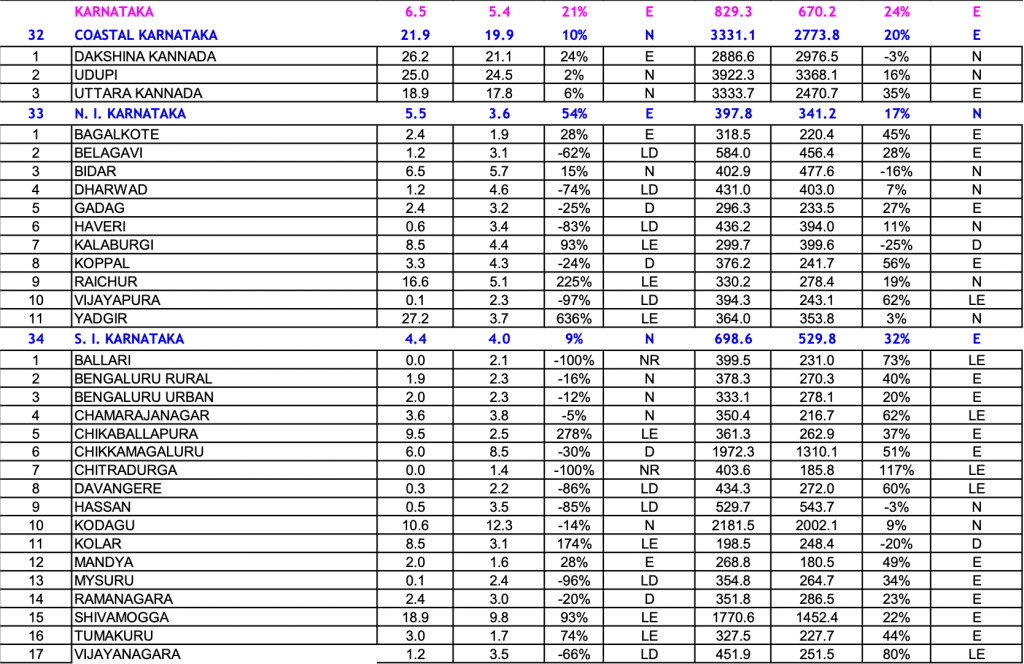
According to Karnataka State Natural Disaster Monitoring Centre data, in June, the state had recorded +2% excess rainfall, while in July it was +51% excess rainfall. In August, the state recorded +7% excess rainfall. However, the Malnad and coastal regions recorded deficit rainfall during August 2024. As per KSNDMC data the rainfall surplus and deficits in four regions of Karnataka during SW Monsoon during June, July, Aug 2024 were as given in table below. The Normal SW Monsoon rainfall in the state is 852 mm, while state has already received 836 mm by Sept 4, so the state is likely to end up with surplus rainfall by the end of the monsoon on Sept 30, as against 23% deficit rainfall in SW Monsoon 2023.
| June 2024 | July 2024 | Aug 2024 | |
| Coastal Karnataka | -16 | +59 | -4 |
| Malnad | -29 | +67 | -21 |
| North Karnataka | +41 | +22 | +23 |
| South Karnataka | +60 | +26 | +72 |
| STATE | +2 | +51 | +7 |
The Malnad region includes four districts: Kodagu, Chikkamagaluru, Shivamogga and Hassan. Also two districts. that IMD includes in S Karnataka, namely Ballari and VIjayanagar, are included by KSNDMC in North Karnataka. The reason for this different classification of districts by IMD and KSNDMC are not known.
Tamil Nadu
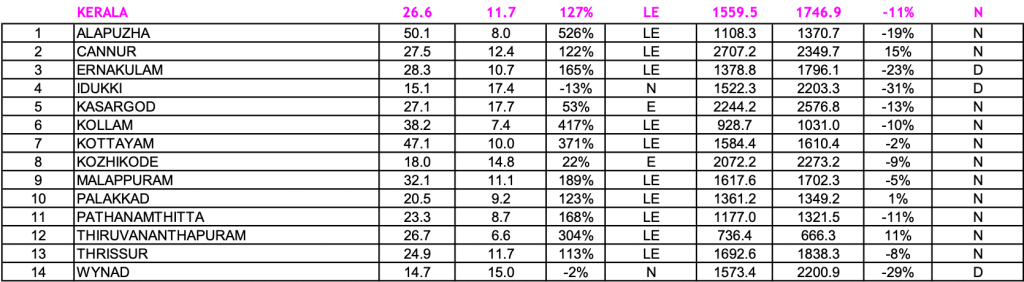
Kerala
Pondicherry

WEST INDIA: Goa

Maharashtra

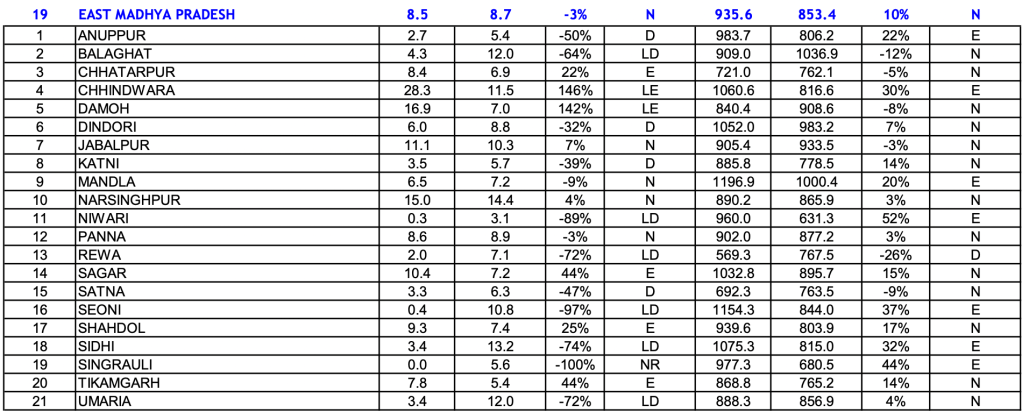
Madhya Pradesh

Gujarat
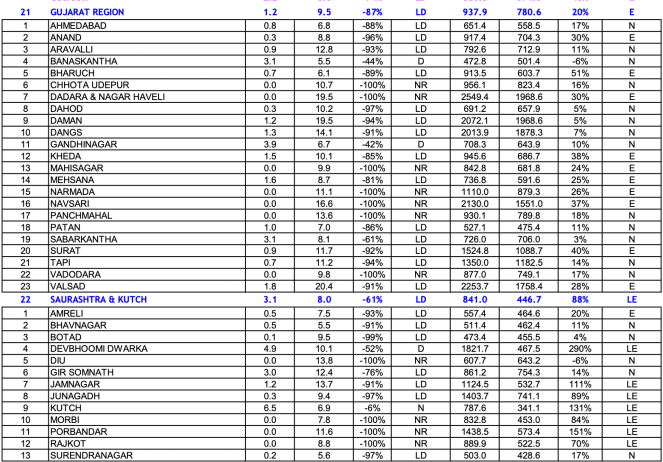
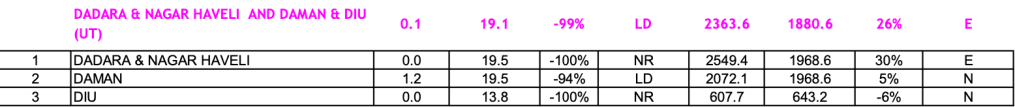
Diu, Daman, Dadar-Nagarhaveli
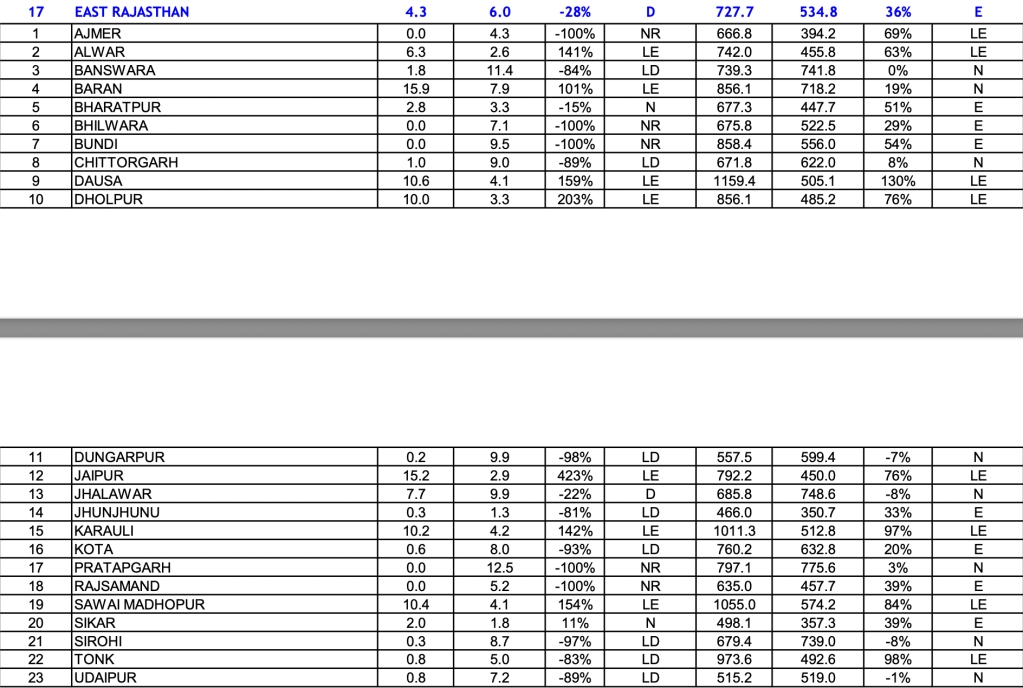
Rajasthan
SANDRP (ht.sandrp@gmail.com)
[i] https://sandrp.in/2023/09/01/june-aug-2023-district-wise-rainfall-in-in-indias-sw-monsoon/
[ii] https://sandrp.in/2022/09/01/june-aug-2022-district-wise-rainfall-in-in-indias-sw-monsoon/
[iii] https://sandrp.in/2021/09/01/june-aug-2021-district-wise-rainfall-in-indias-sw-monsoon/
[iv] https://sandrp.in/2020/08/31/district-wise-rainfall-in-june-aug-2020-in-india/
[v] https://sandrp.in/2024/08/07/june-july-2024-district-wise-rainfall-in-indias-sw-monsoon/

One thought on “June Aug 2024: District wise rainfall in India’s SW Monsoon”