In the just concluded South West Monsoon 2023, India received 820 mm (925 mm in SW Monsoon 2022[i]) rainfall, about 94.45 % (106.5% in 2022) of the Normal SW Monsoon rainfall of 868.6 mm or 5.55% (6.5% above normal in 2022) below normal SW Monsoon rainfall as per India Meteorological Department (IMD). This rainfall will now be categorised as below normal rainfall though the distribution has been unprecedented, both temporally and spatially.
IMD had forecast Normal monsoon rainfall for SW Monsoon 2023 (rainfall between 96% and 104% of Long Period Average Rainfall), IMD has been proved wrong. IMD however, says that 73% of the area in the country received normal rainfall and 9% got above normal, only 18% got below normal rainfall. The monsoon withdrawal[ii], is yet to happen from most of India, except a small part in North West India including parts of Rajasthan and Haryana.
In SW Monsoon 2021, the rainfall was 874.6 mm, 0.68% below normal rainfall. In SW Monsoon 2020, the rainfall was 956.7 mm, or about 8.74% above normal and in SW Monsoon 2019 it was 10.4% above normal. Thus 2023 is the first year of below normal rainfall after four straight years (2019, 2020, 2021 and 2022) when rainfall has been normal or above normal. The district wise, state wise rainfall figures for June 2023[iii] (June 2022), June-July 2023[iv] (June-July 2022) and June-Aug 2023[v] (June-Aug 2022) are given in separate articles with maps. Similarly figures for High Rainfall events in June 2023, July 2023, Aug 2023 are given in separate articles.
All the rainfall from now on (i.e. after 0830 hours on Sept 30 2023) will be counted in Post Monsoon season in IMD accounts.
The month-wise distribution of rainfall during the SW Monsoon 2023 was as follows.
| June 2023 | July 2023 | Aug 2023 | Sept 2023 | SW Monsoon 2023 | |
| Actual | 148.6 | 318.4 | 162.7 | 190.3 | 820 |
| Normal | 165.3 | 280.5 | 254.9 | 167.9 | 868.6 |
| % departure | -10.1% | +13.5% | -36.2% | +13.34% | -5.55% |
Source: IMD; rainfall figures in mm.
The same figures for SW Monsoon 2022 are given in the table below.
| June 2022 | July 2022 | Aug 2022 | Sept 2022 | SW Monsoon 2022 | |
| Actual | 152.3 | 327.7 | 263.8 | 181.2 | 925 |
| Normal | 165.3 | 280.5 | 254.9 | 167.9 | 868.6 |
| % departure | -8% | +16.8% | +3.5% | 7.9% | +6.5% |
Source: IMD; rainfall figures in mm.
It is clear from the above table that the rainfall in June, July and Sept 2023 is not far from the figures in respective months in 2022, but it is the massive difference of about 40% in rainfall in Aug between 2023 and 2022 that has made the difference. This is possibly the impact of active El Nino phenomena in 2023, which was absent in 2022. However, IMD suggested[vi] that the effect of other meteorological factors reduced the impact of El Nino.
As we can see from the table above, the rainfall varied widely across the four monsoon months ranging from over 36% below normal in Aug to 13.5% above normal in July and Sept. The range of fluctuation in 2023 is the highest after several decades. There has been similar wild variation spatially and within the monsoon months, but we do not have an index of rainfall distribution that captures these variations. What we need is a more detailed, nuanced index of rainfall that will not only capture the quantum of rainfall as it does today, but also the temporal and spatial distribution of rainfall across the monsoon and across the nation. This will give a better picture of the monsoon rainfall and would also help us understand how this index is changing.
The Times of India wrote in its edit on Oct 2, 2023[vii] that the message of this erratic monsoon is that we need to change the cropping pattern towards less water intensive crops like millets from water intensive paddy, wheat, sugarcane, among others. This is today even more imperative considering the footprint of climate change we see on the rainfall. The edit suggests that the government needs to work to ensure through right procurement practices that farmers are convinced that cultivating millets and other less water intensive crops is less risky and more profitable than cultivating water intensive crops like paddy and sugarcane. The edit may have also highlighted the huge water saving potential of rice cultivation methods like System of Rice Intensification.
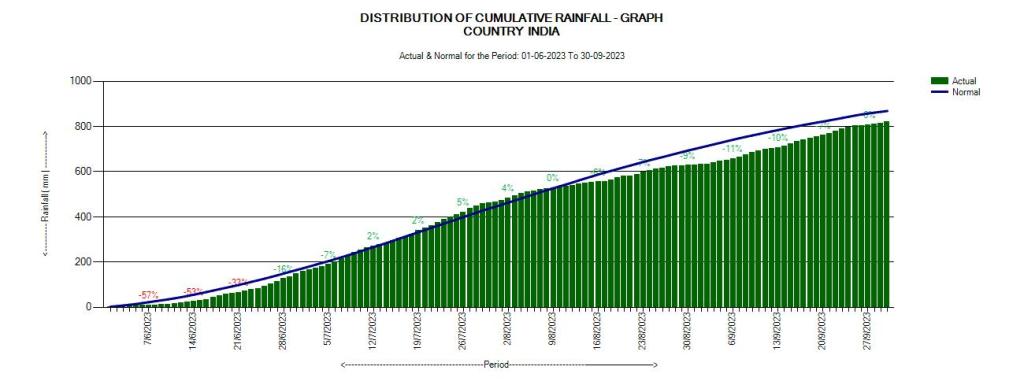
Region wise rainfall graphs The first bar chart below is for the National Rainfall figure till Sep 30 2023.
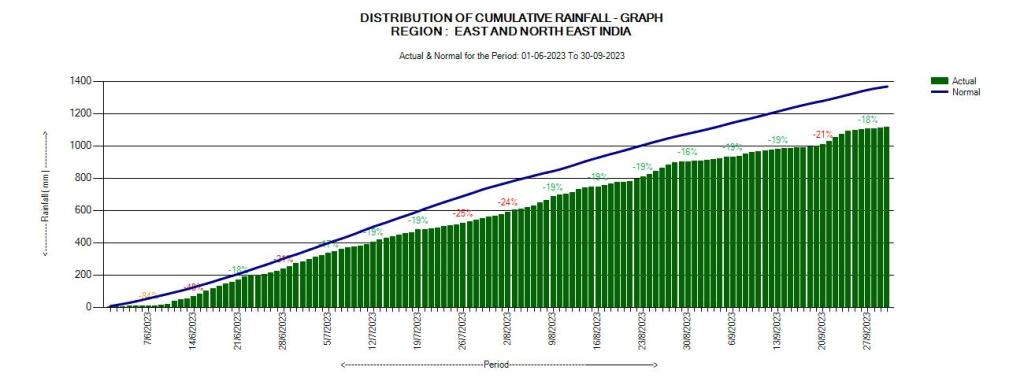
The IMD divides the country into four regions. As can be seen from the following graph, the East and North East India had 18% below normal for SW Monsoon 2023.
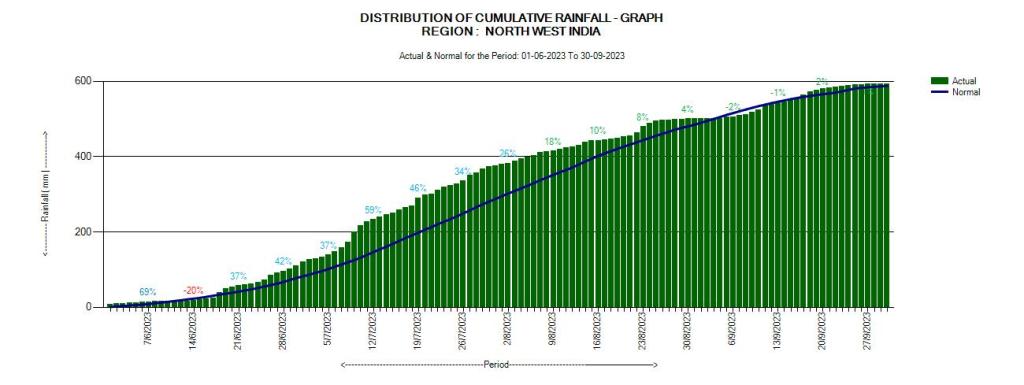
The North West India ended the SW Monsoon 2023 with just 1% surplus. The cumulative seasonal rainfall in NW India has remained above normal throughout the season.
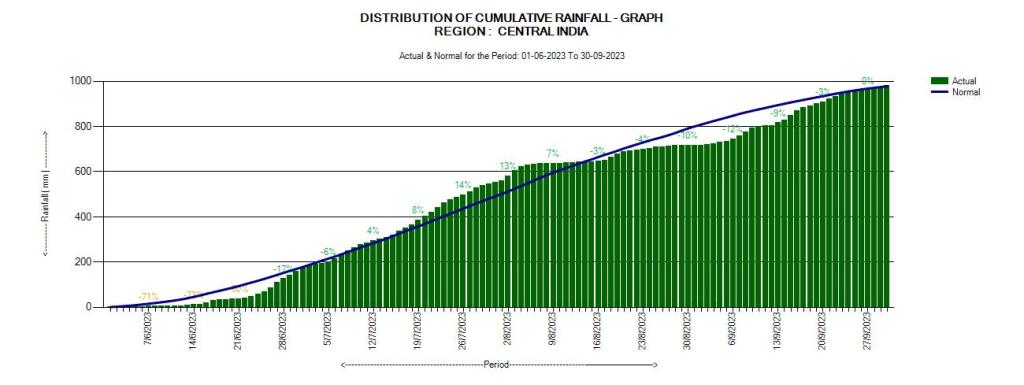
The Central India ended the SW Monsoon 2023 with 0% deficit rainfall, the deficit of 10% till end of Aug was wiped out by the surplus rainfall in Sept 2023.
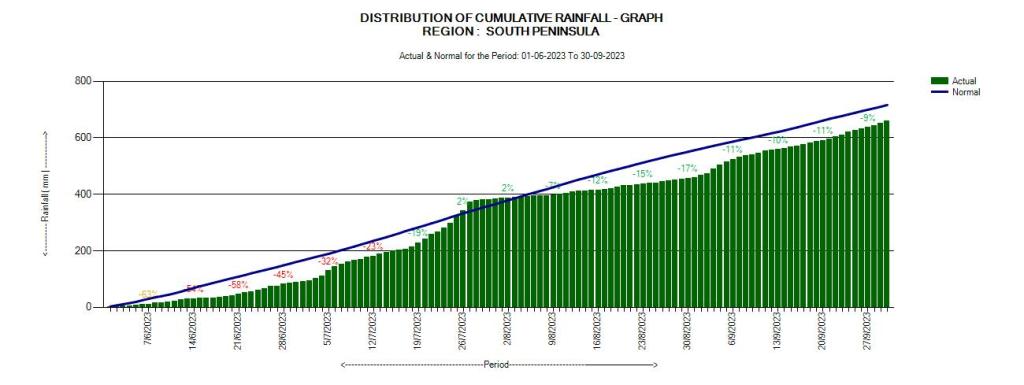
The South Peninsular India had deficit rainfall at 8% at the end of SW Monsoon 2023, down from 17% deficit at the end of Aug 2023.

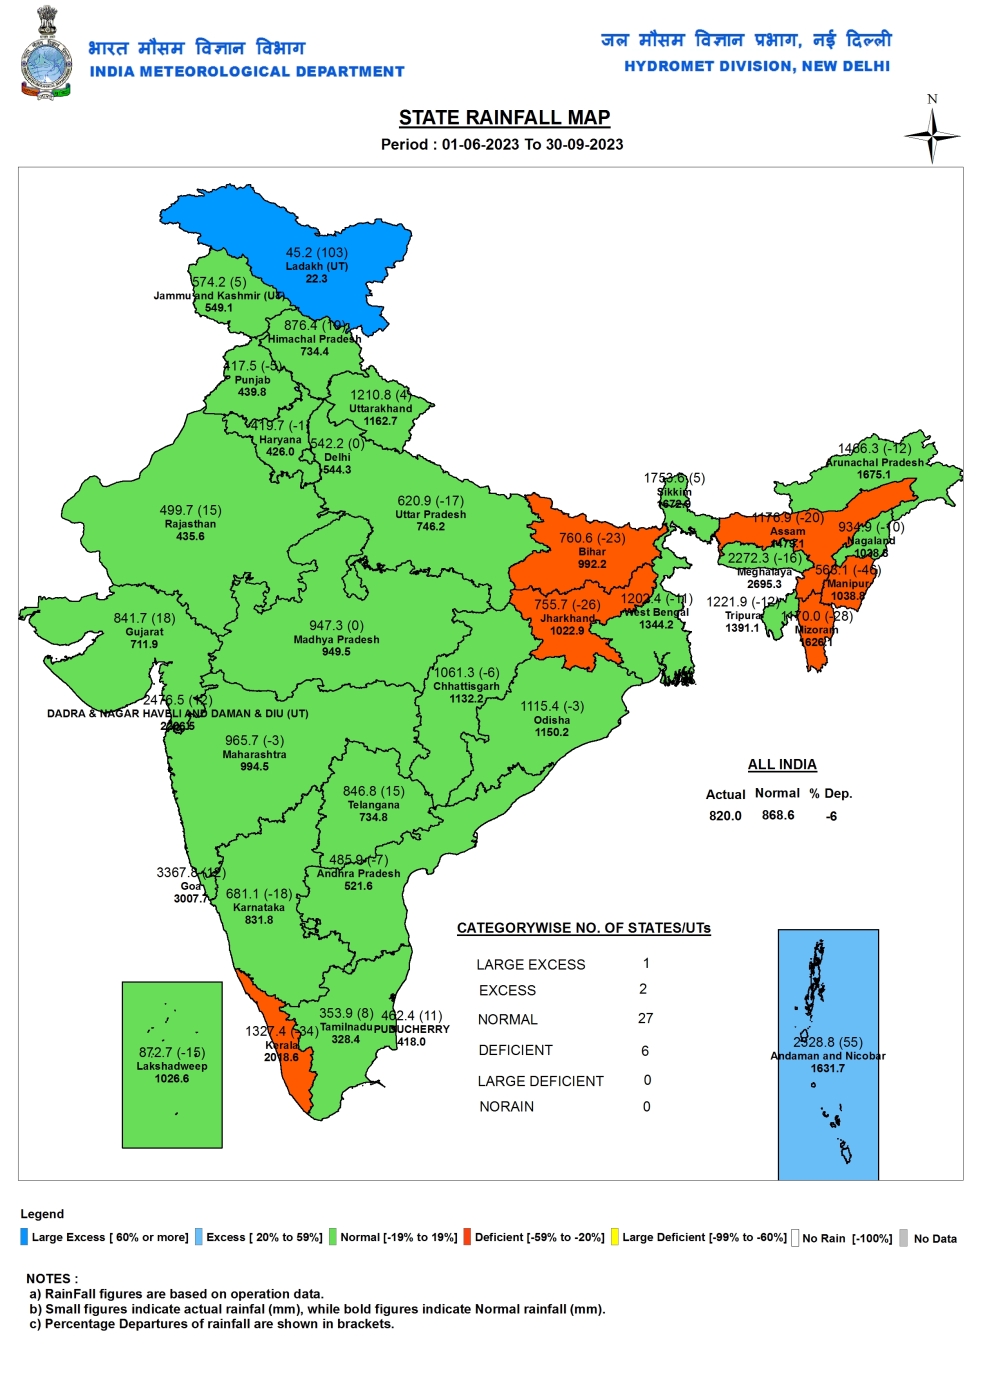
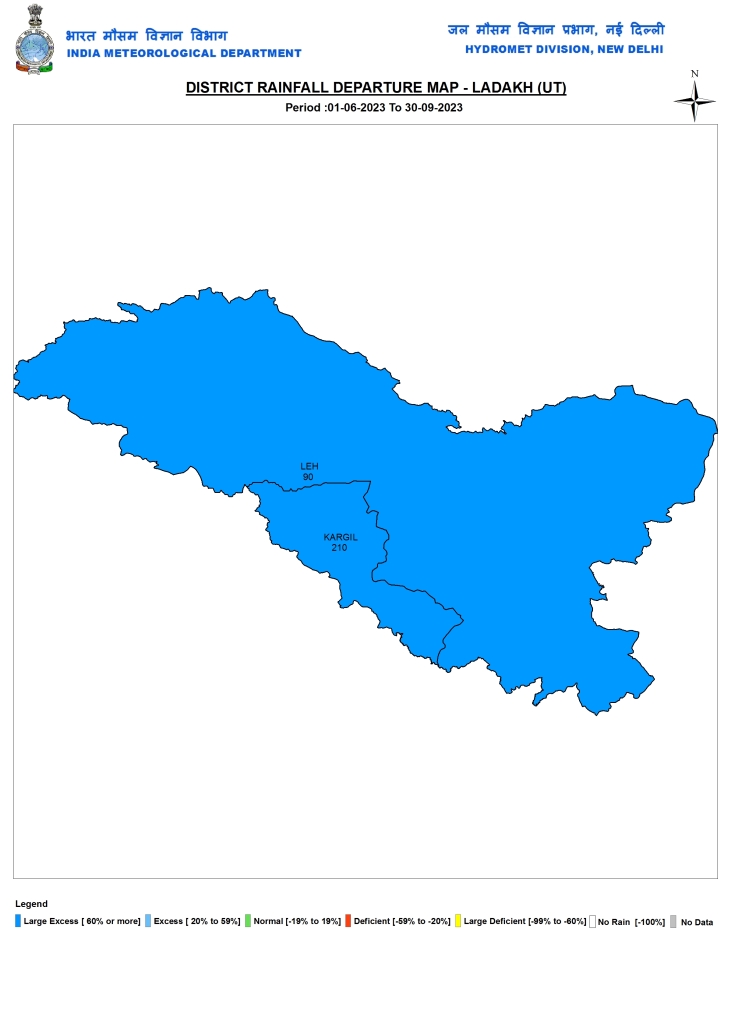
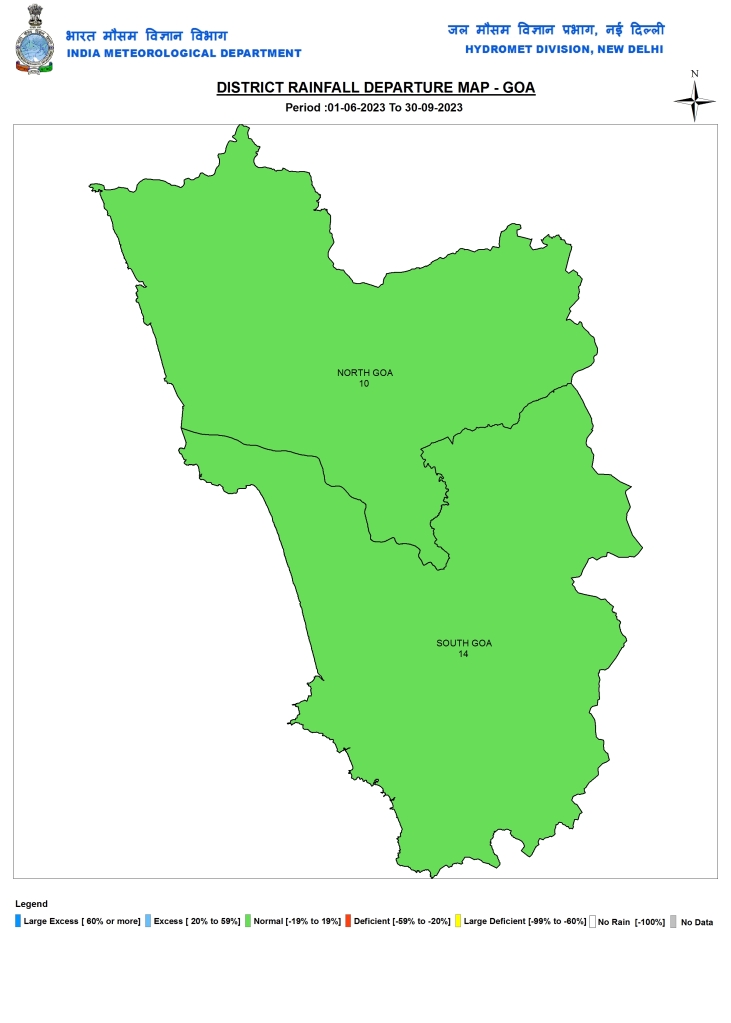
State wise Rainfall As we can see from the IMD map above, in the four month long South West Monsoon 2023 concluding on Sept 30, 2023, out of 36 States and Union Territories (UTs), One (Ladakh) had Large Excess (same as in SW Monsoon 2022), Two (Andaman & Nicobar, Chandigarh) had Excess (Actual rainfall 20-59% above normal), 27 had normal (Actual rainfall 19% below normal to 19% above normal), Six had deficit (Actual rainfall 20-59% below normal rainfall) and none had Large Deficit (Actual rainfall over 60% below normal) in rainfall. Ladakh had the lowest rainfall (like in 2022) at 45.2 mm, even as it had the highest surplus % at 103%. Goa had the highest rainfall (like in 2022) at 3367.8 mm.
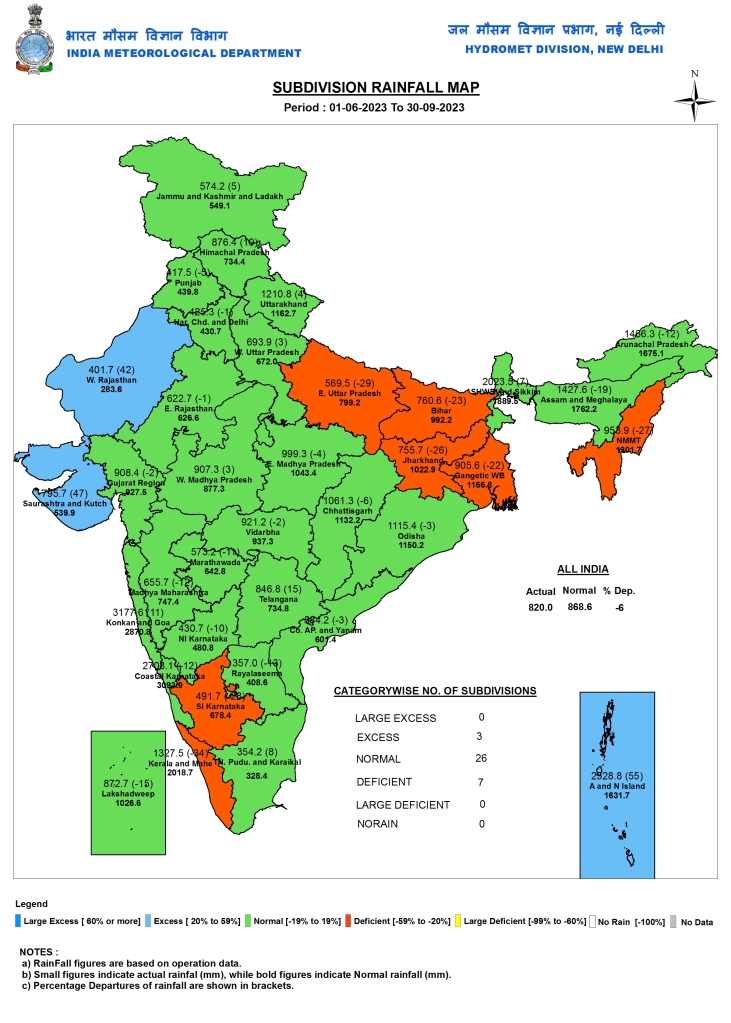
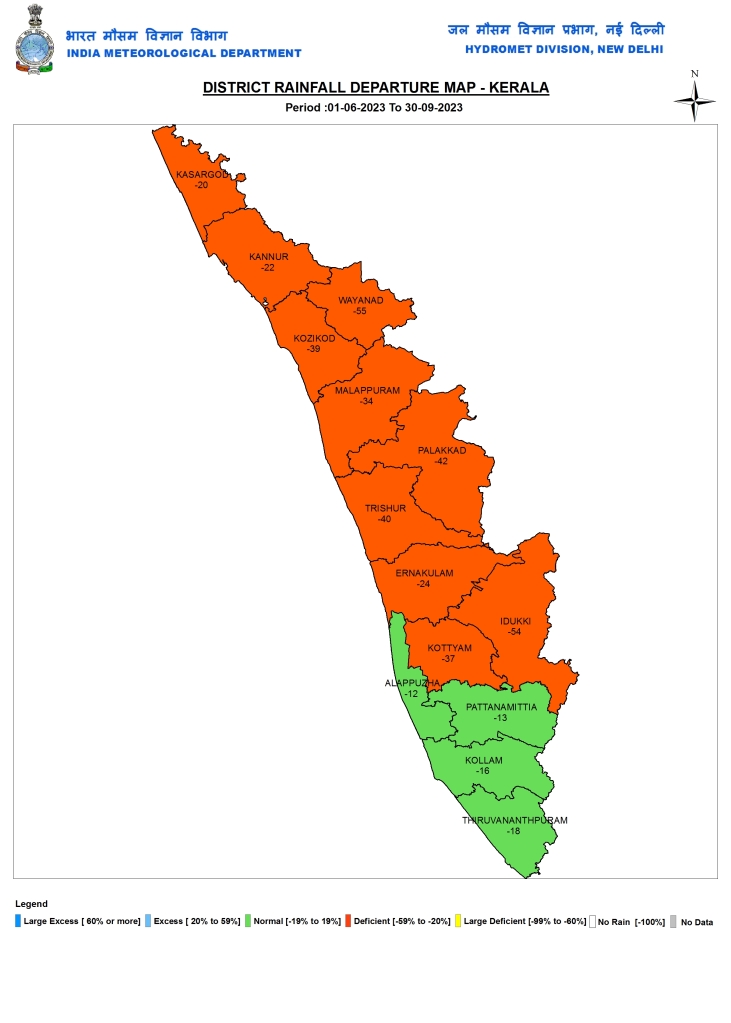
Sub Division wise rainfall IMD divides India into 36 meteorological divisions (the logic of many of them is questionable). As we can see from the IMD map of Sub Division wise rainfall above of SW Monsoon 2023, 3 sub divisions (Saurashtra-Kutch, W Rajasthan and Andaman-Nocobar) had Excess rainfall, 26 had Normal rainfall and 7 had deficit rainfall. Konkan-Goa had the highest rainfall at 3177.6 mm and TN-Puducherry-Karaikal had the lowest at 354.2 mm rainfall. Andaman-Nicobar had the highest surplus rainfall % at 55%. Kerala had the highest deficit rainfall % at 34%.
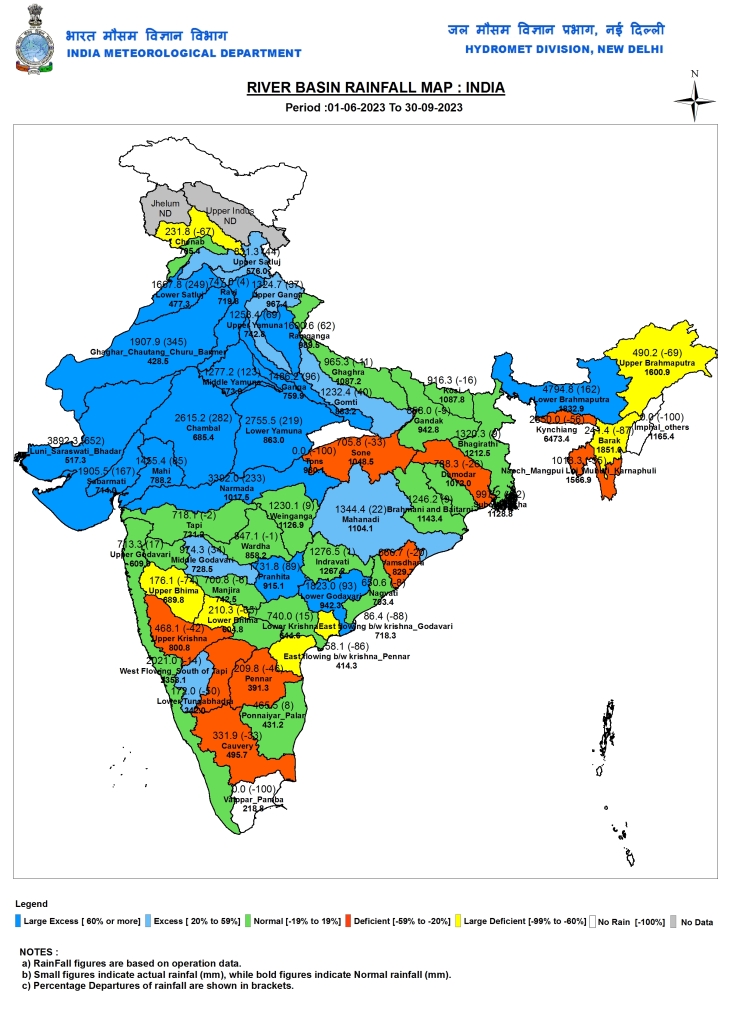
River Basin wise Rainfall As we can see from the IMD’s river basin wise rainfall map above, IMD also reports river basin wise rainfall. However, as we have been noting in the past, this reporting remains rather callous and inadequate, unfortunately, though IMD would know that it is much more important to provide accurate figures of river basin wise and sub basin wise rainfall figures.
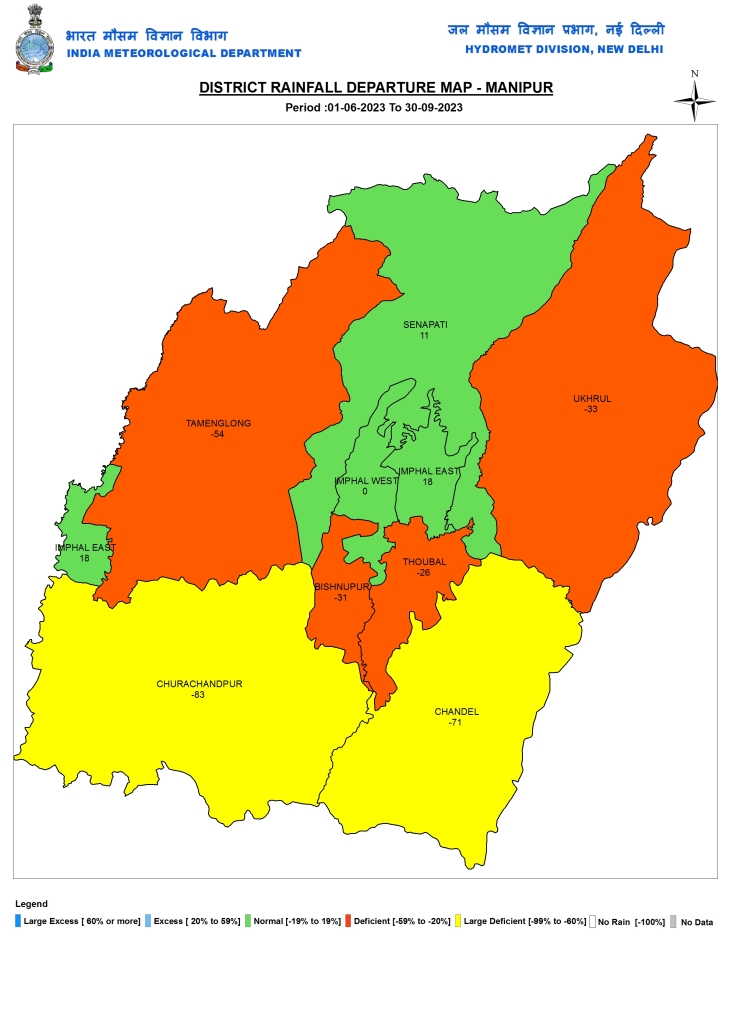
This is clear from the map, where was can see that IMD reports NO RAIN in whole of the four month long monsoon 2023 in Vaippar Pamba river basin in TN-Kerala, Tons River Basin and also Imphal and others riverbasin in Manipur. THIS IS AN IMPOSSIBILITY, looking at the district wise rainfall in these areas in the maps below, among others. This kind of situation keeps repeating year after year, number of basins where this happened this year is higher at 3 this year compared to 1 in last year. IMD also reports NO DATA in several basins including: Jhelum, Upper Indus.
All India District wise rainfall departure map The map below provides district wise picture of rainfall at all India level.
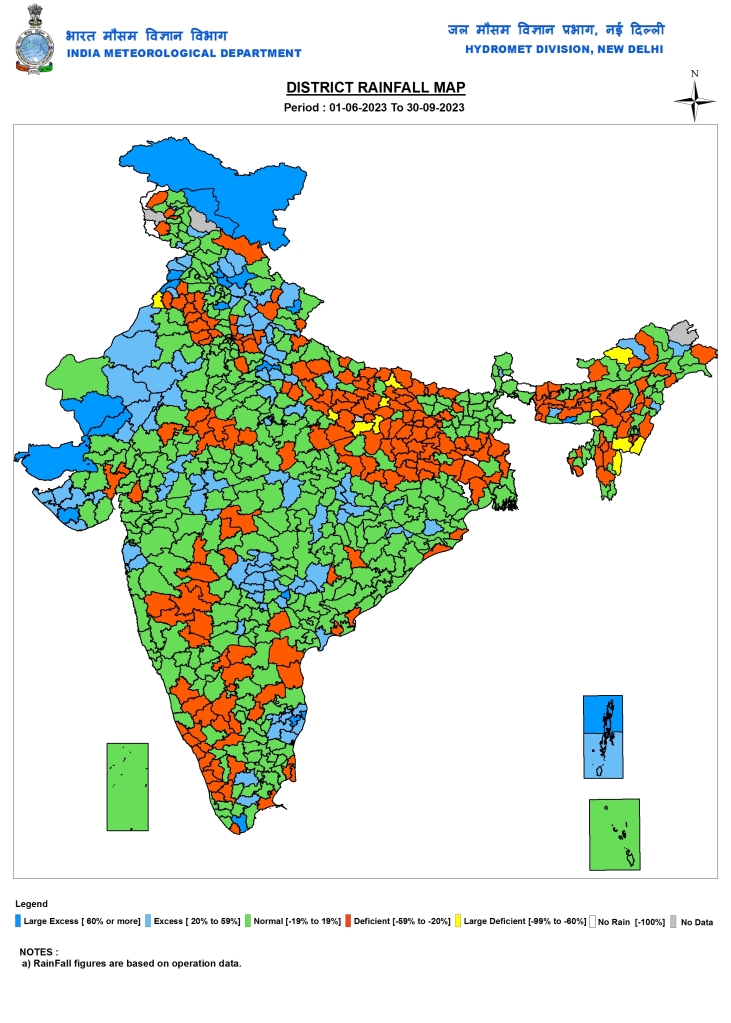
DISTRICT WISE STATE WISE RAINFALL
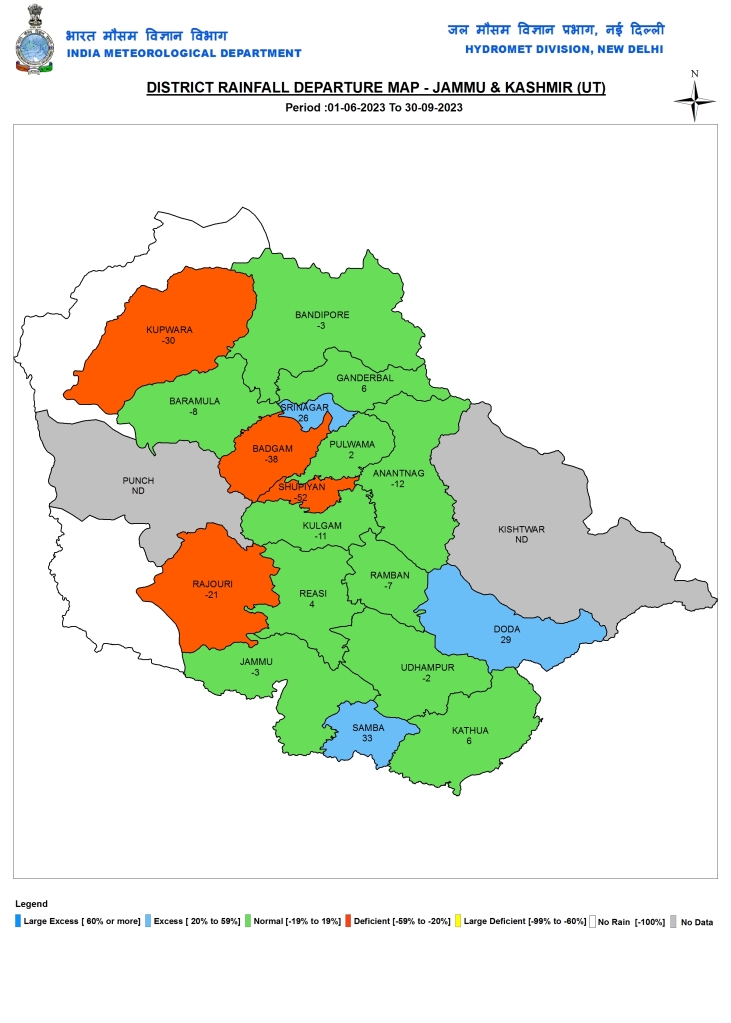
NORTH INDIA: Jammu & Kashmiar
Ladakh
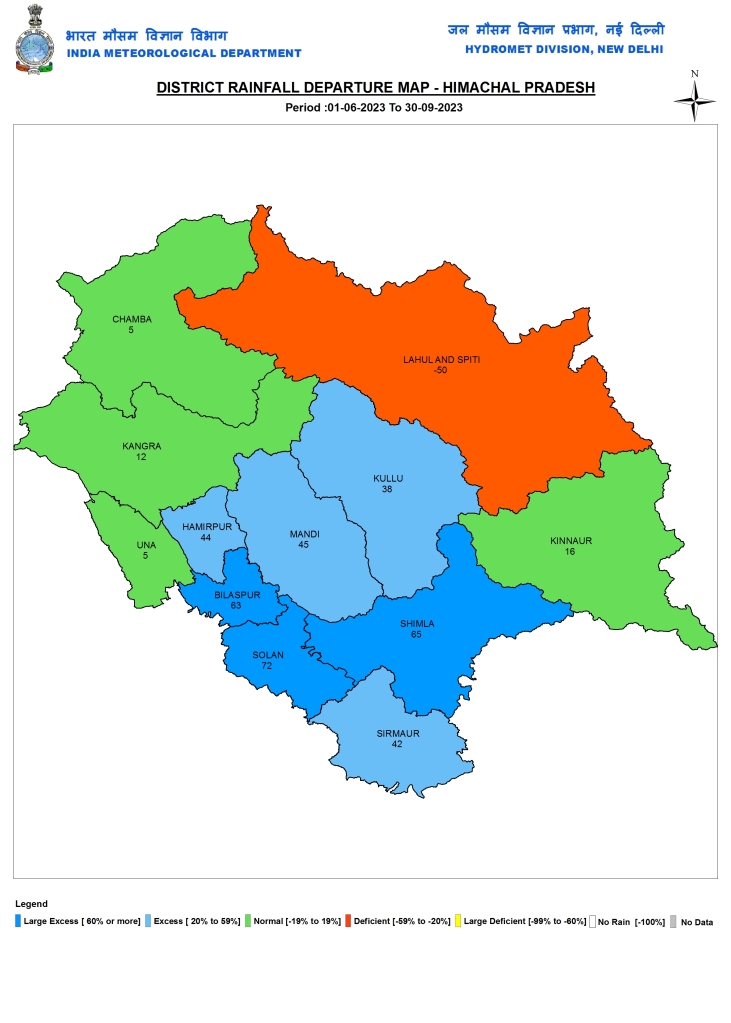
Himachal Pradesh
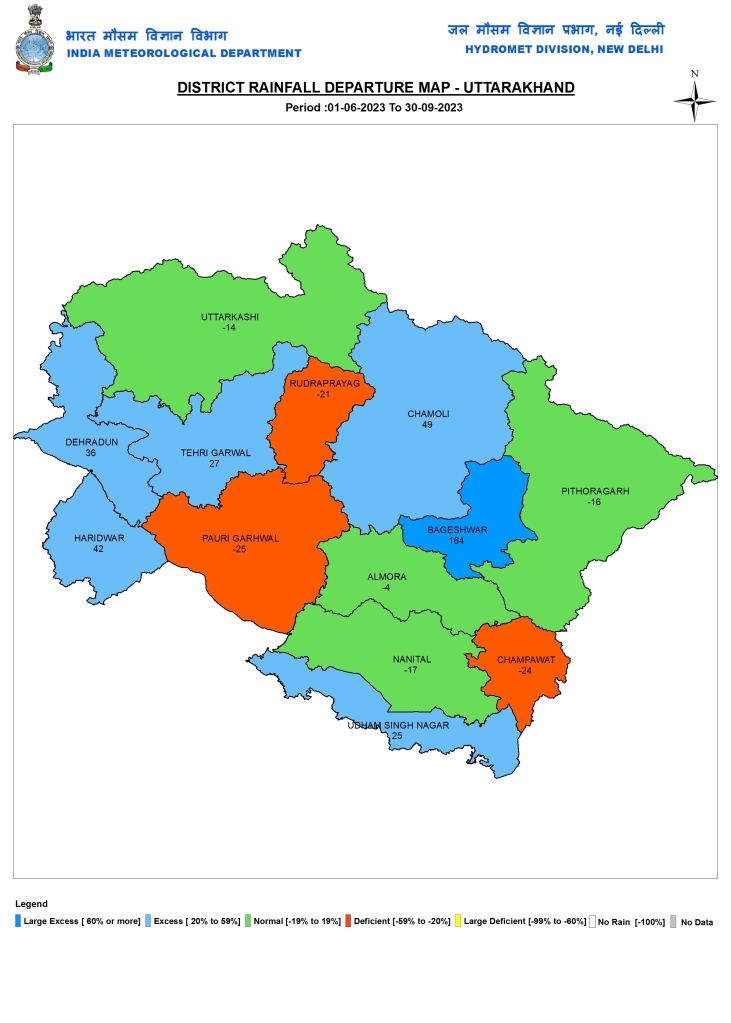
Uttarakhand
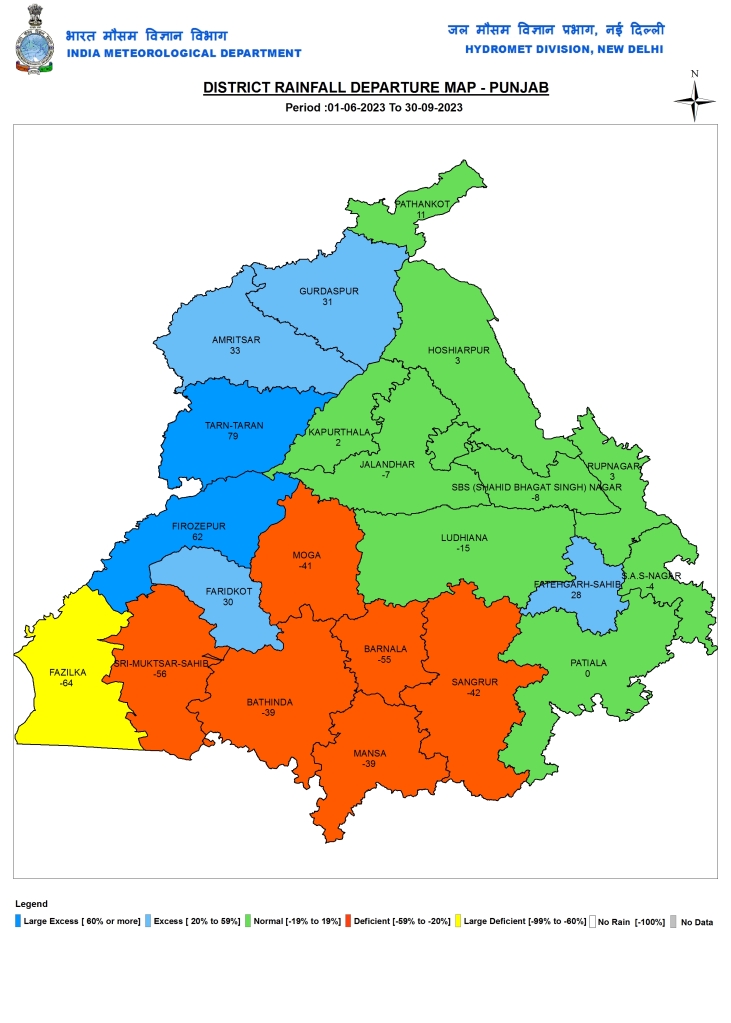
Punjab
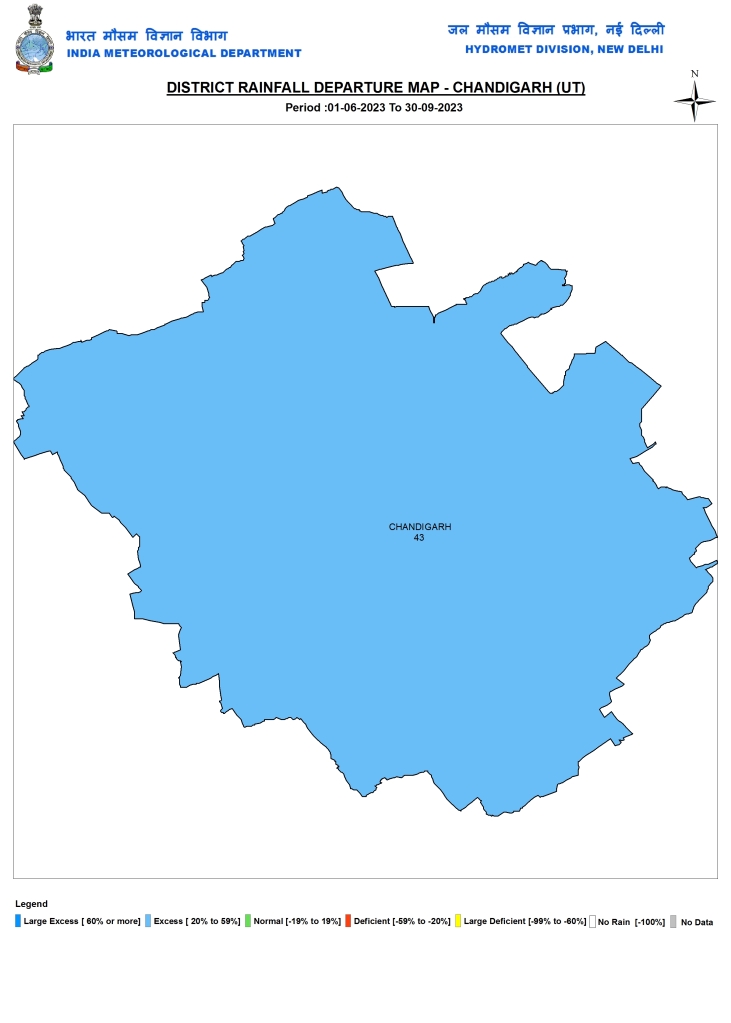
Chandigarh
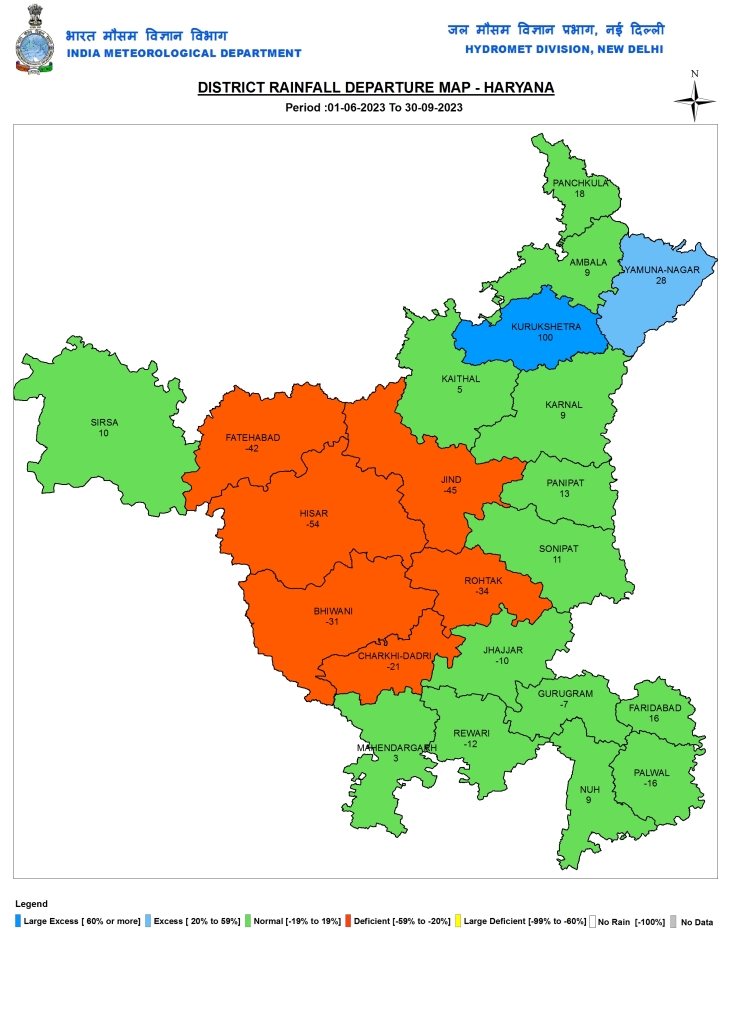
Haryana
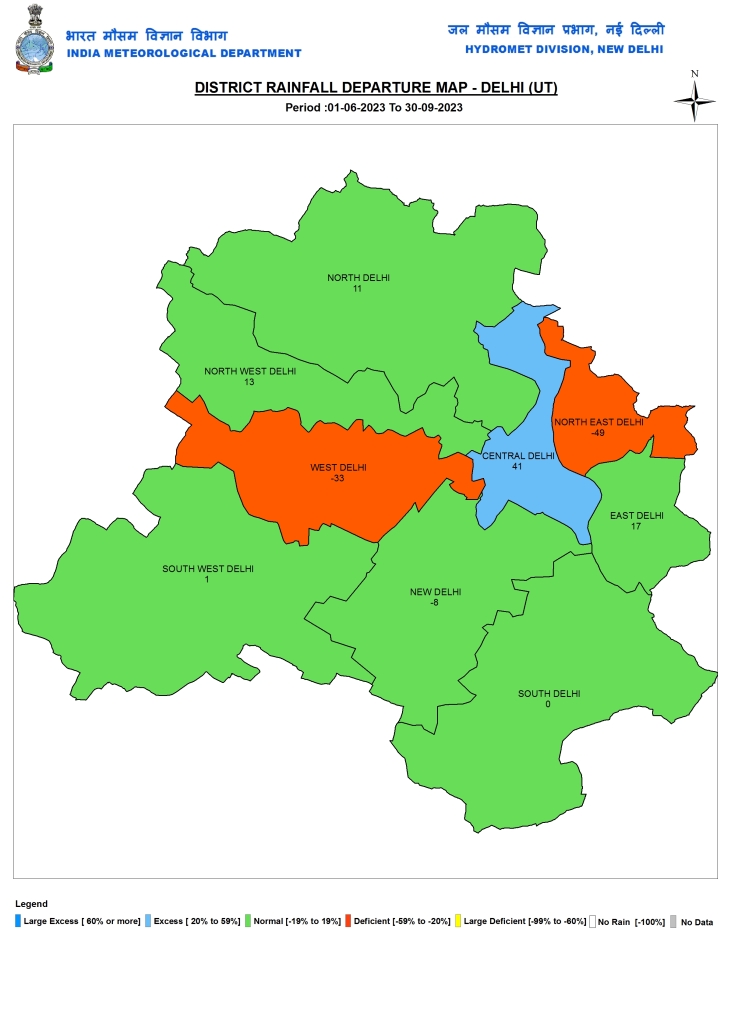
Delhi
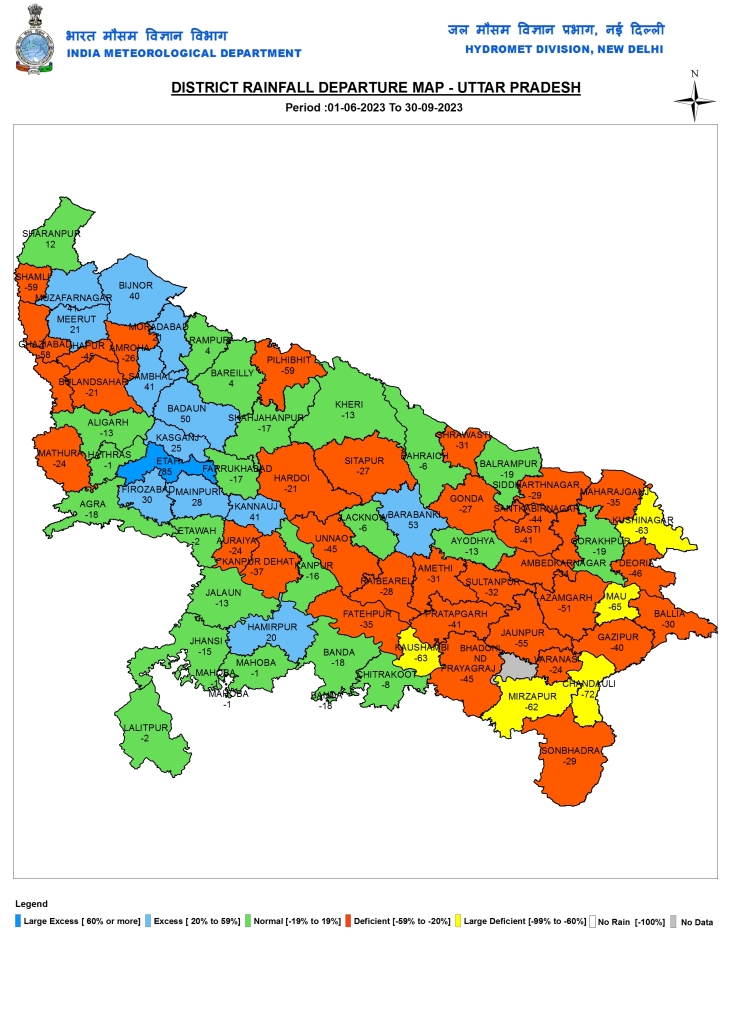
EAST INDIA: Uttar Pradesh
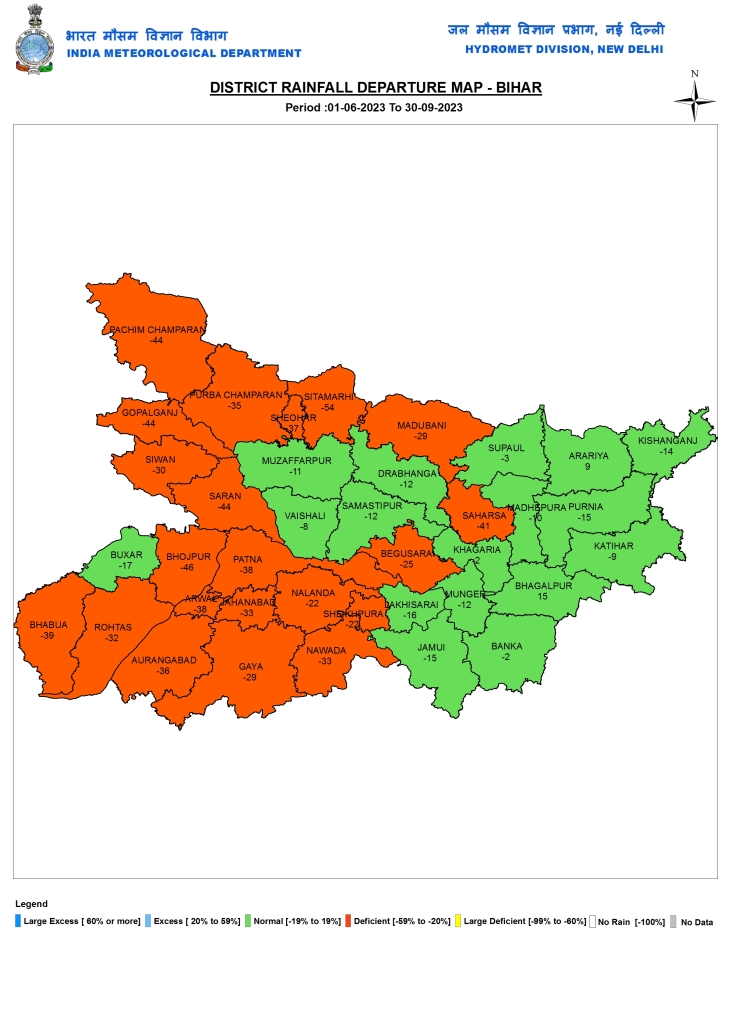
Bihar
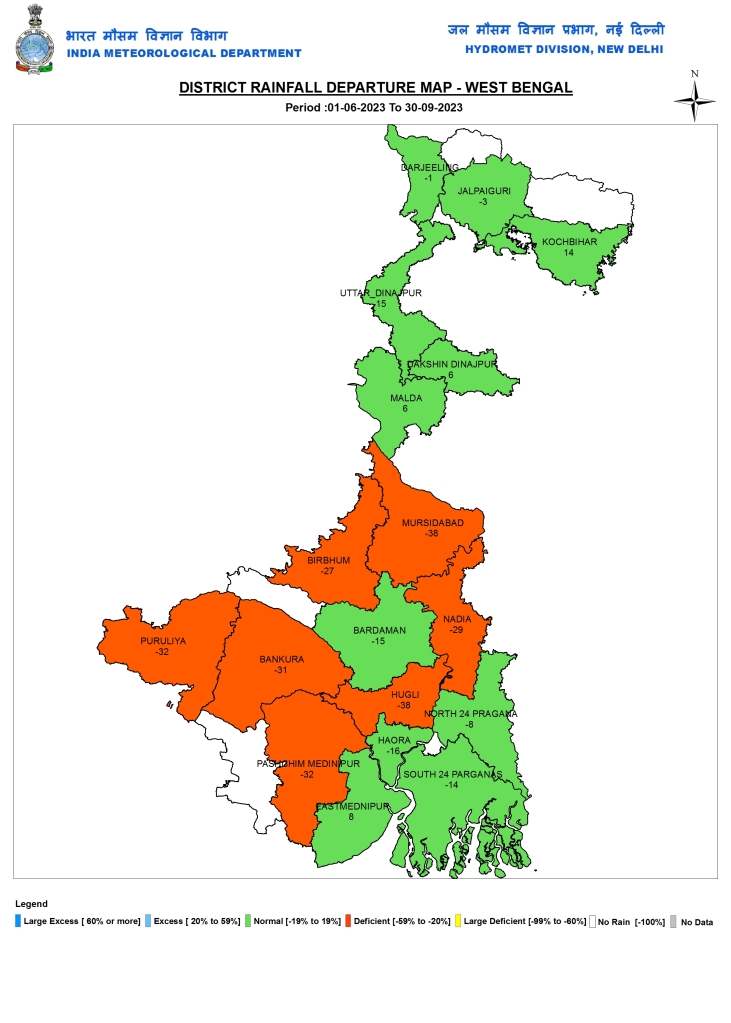
W Bengal
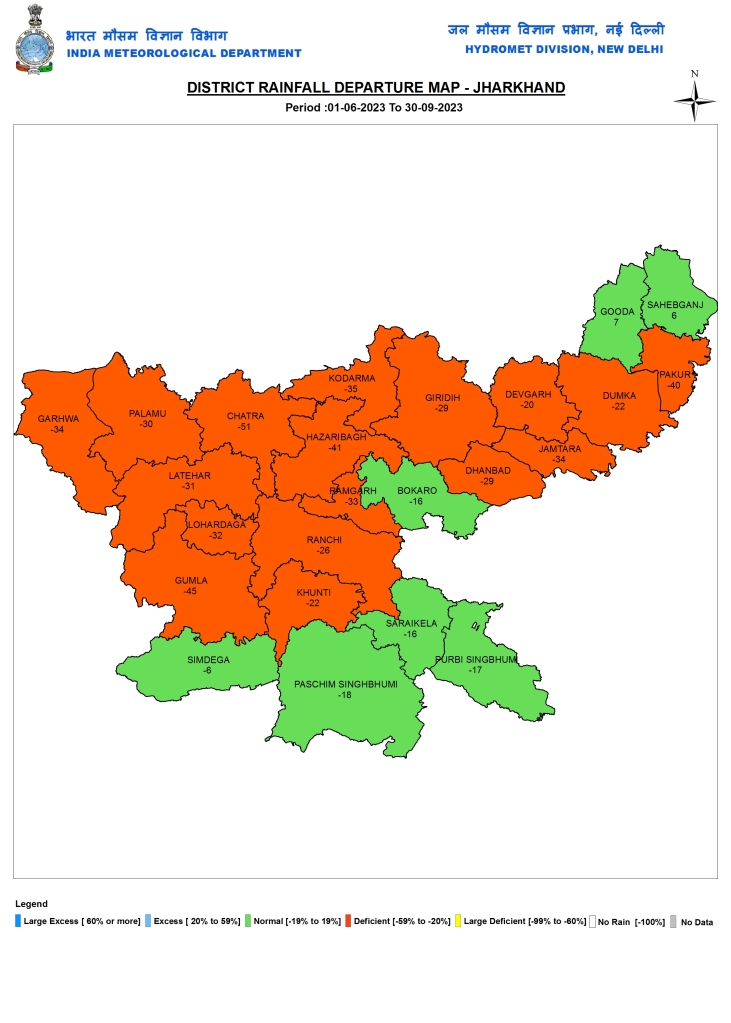
Jharkhand
Odisha

Chhattisgarh

NORTH EAST INDIA: Sikkim

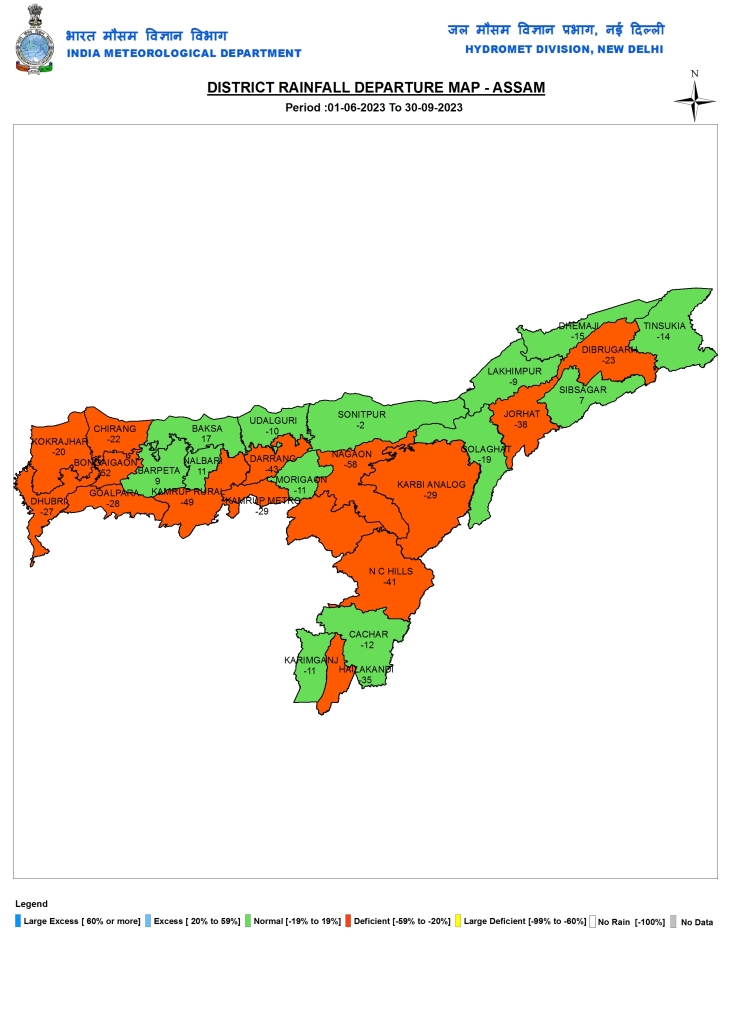
Assam
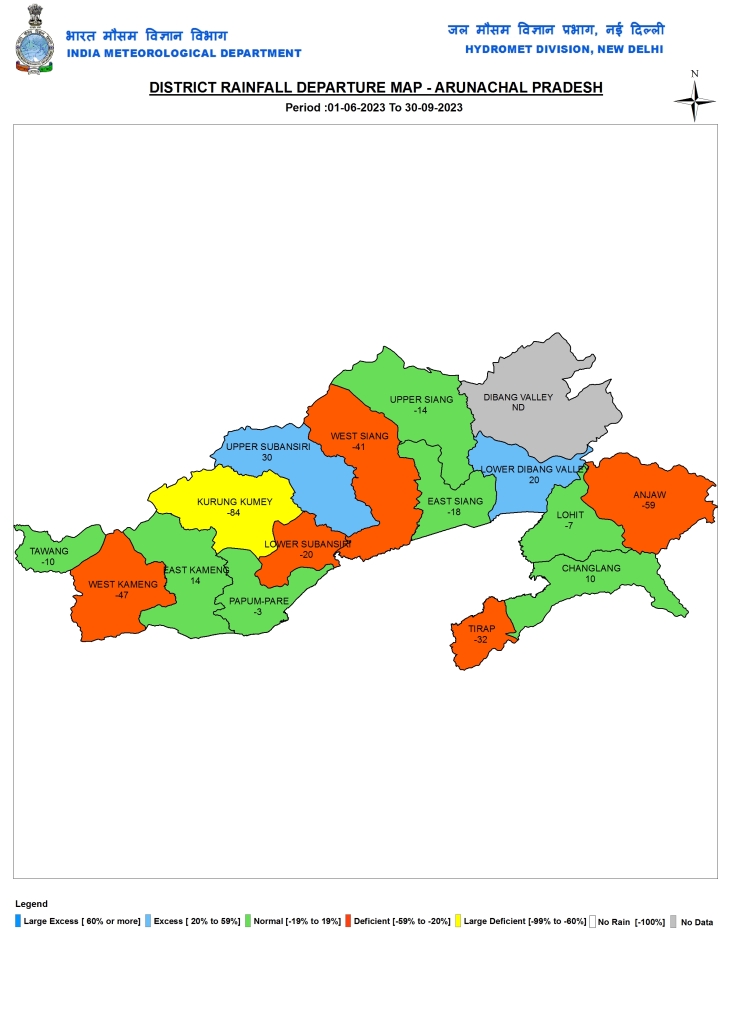
Arunachal Pradesh
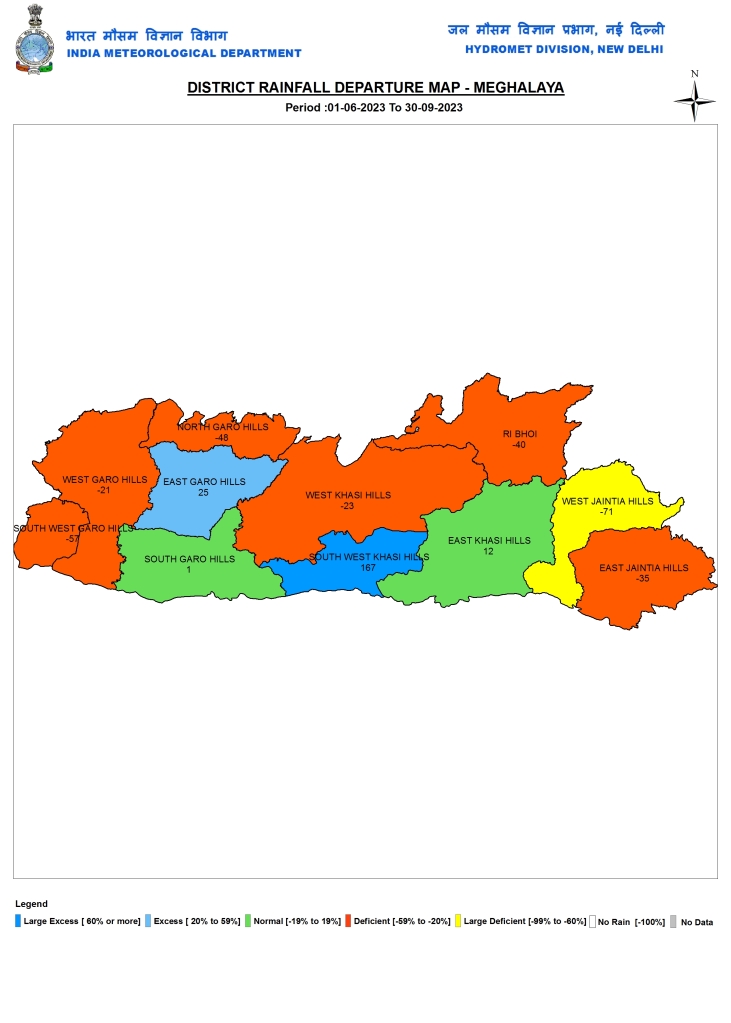
Meghalaya
Manipur
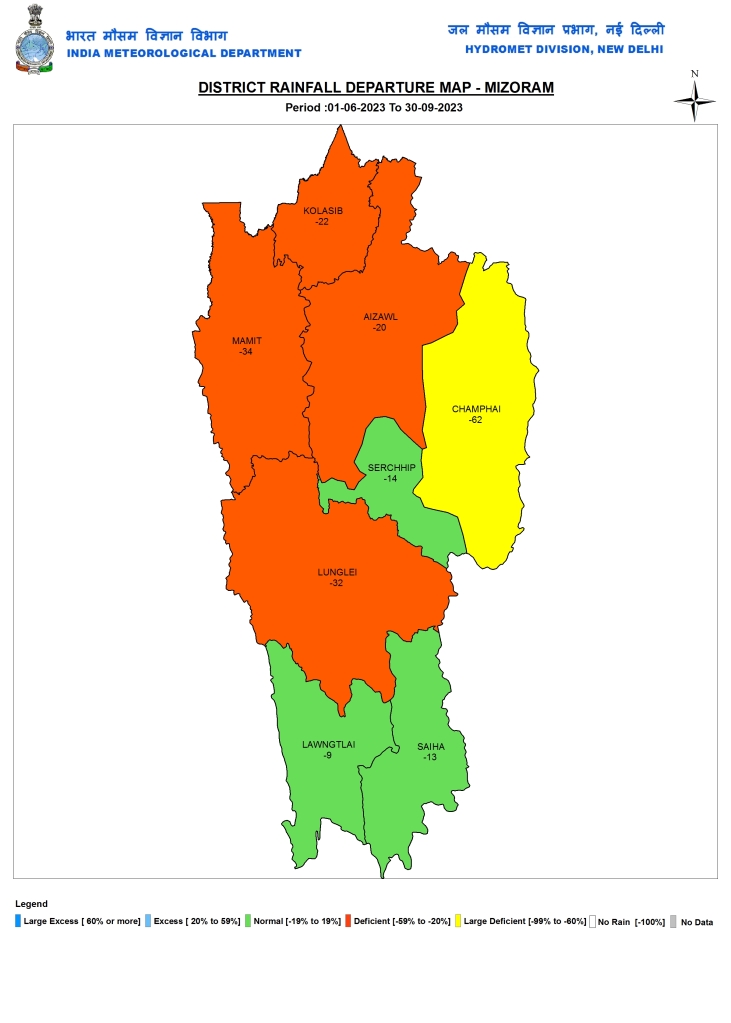
Mizoram
Nagaland

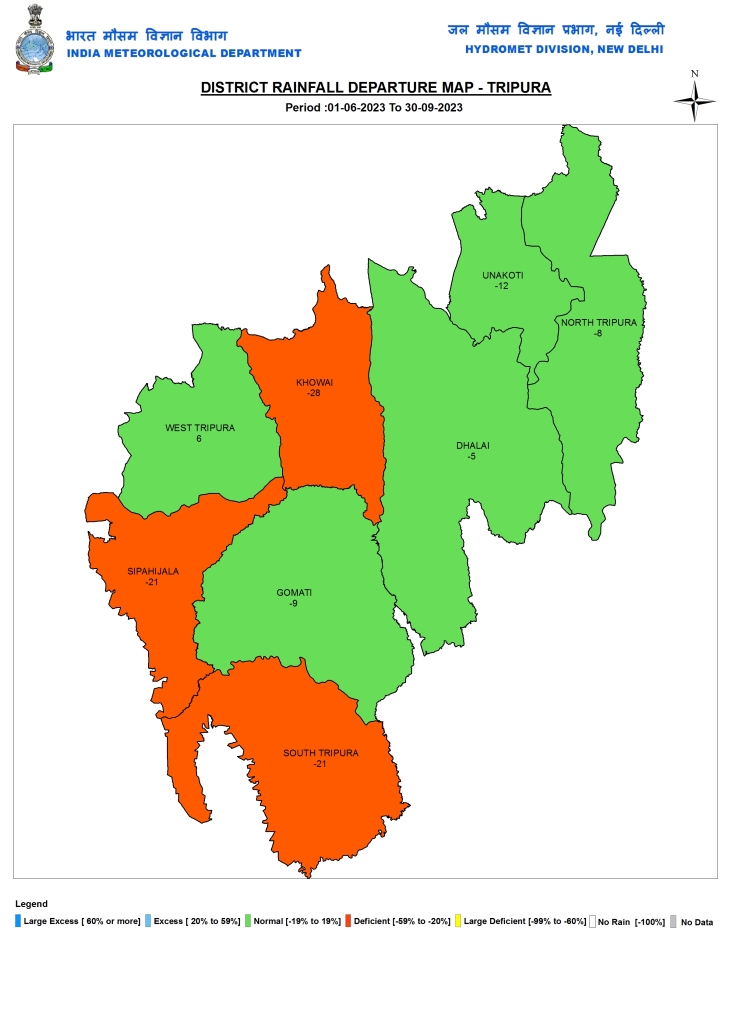
Tripura
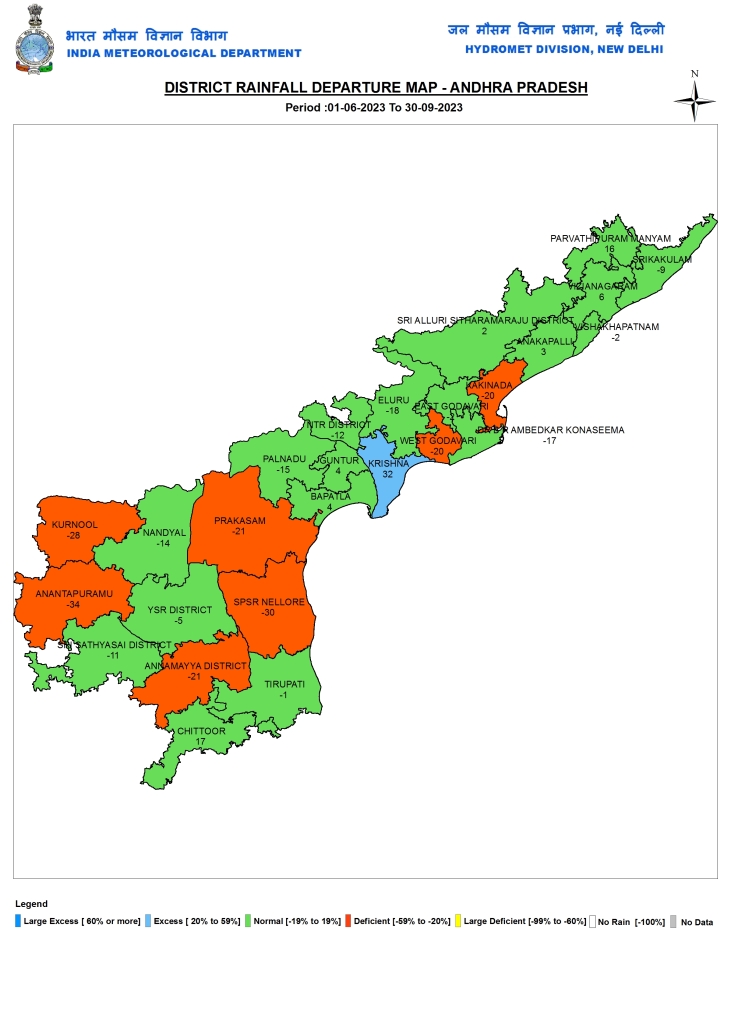
SOUTH INDIA: Andhra Pradesh
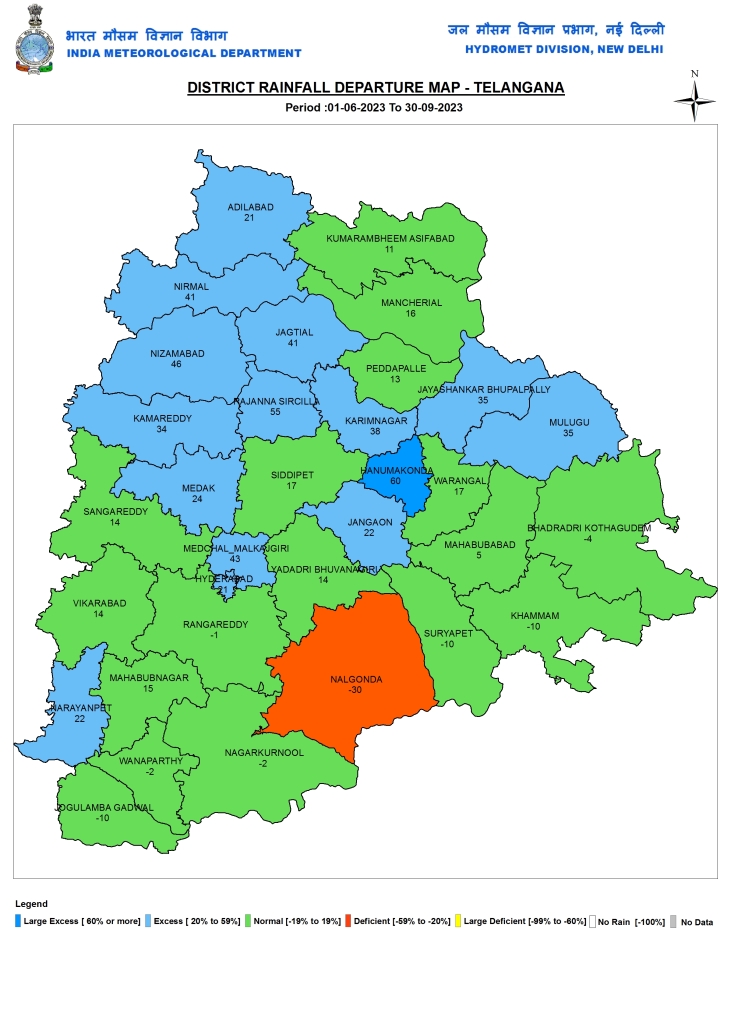
Telangana
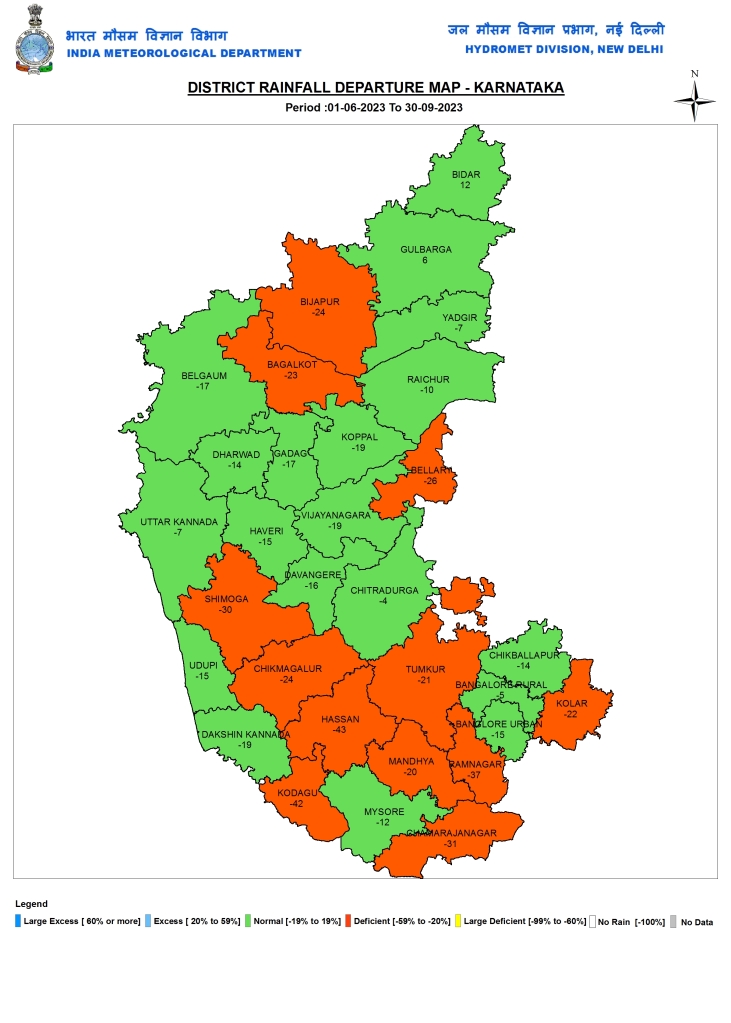
Karnataka
Tamil Nadu

Kerala
WEST INDIA: Goa
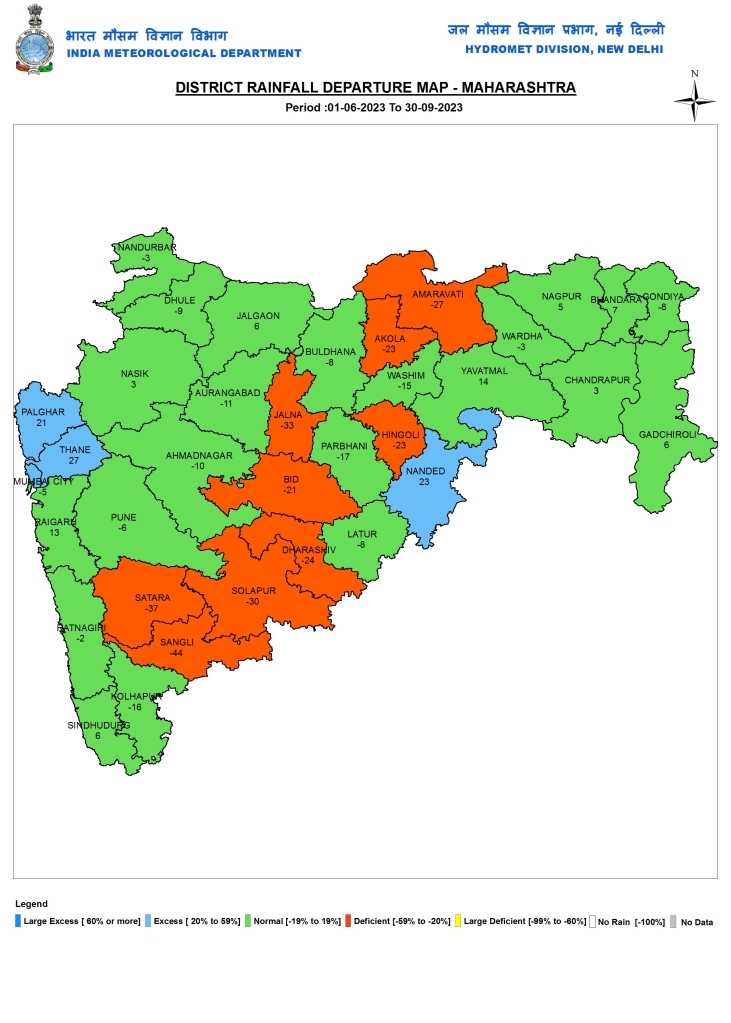
Maharashtra
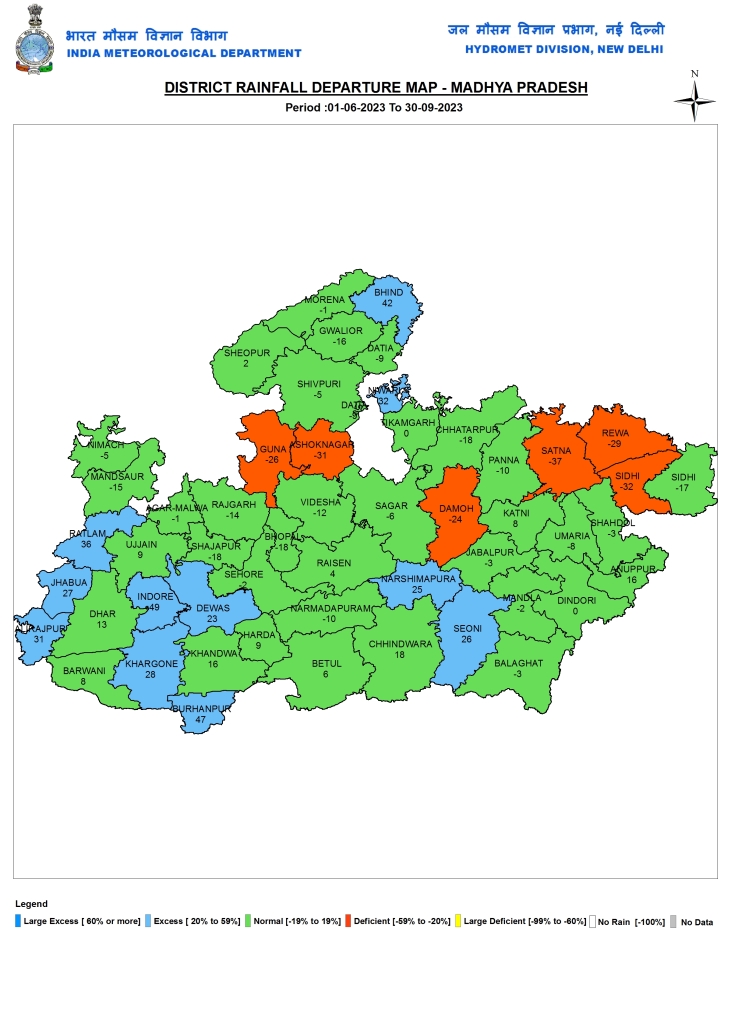
Madhya Pradesh
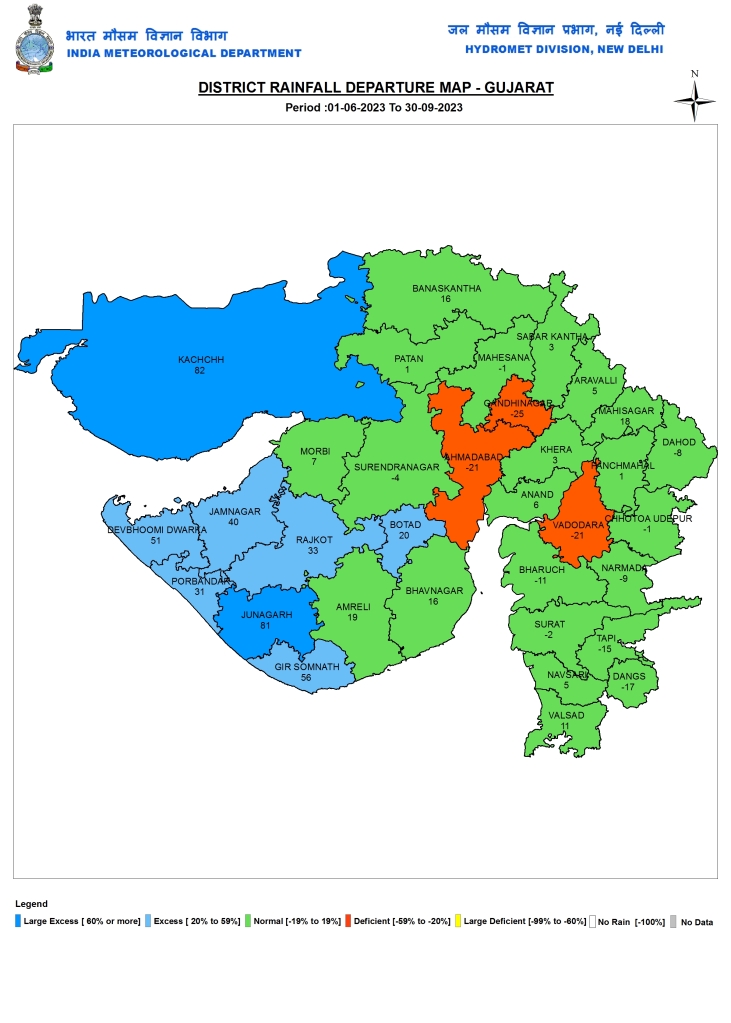
Gujarat
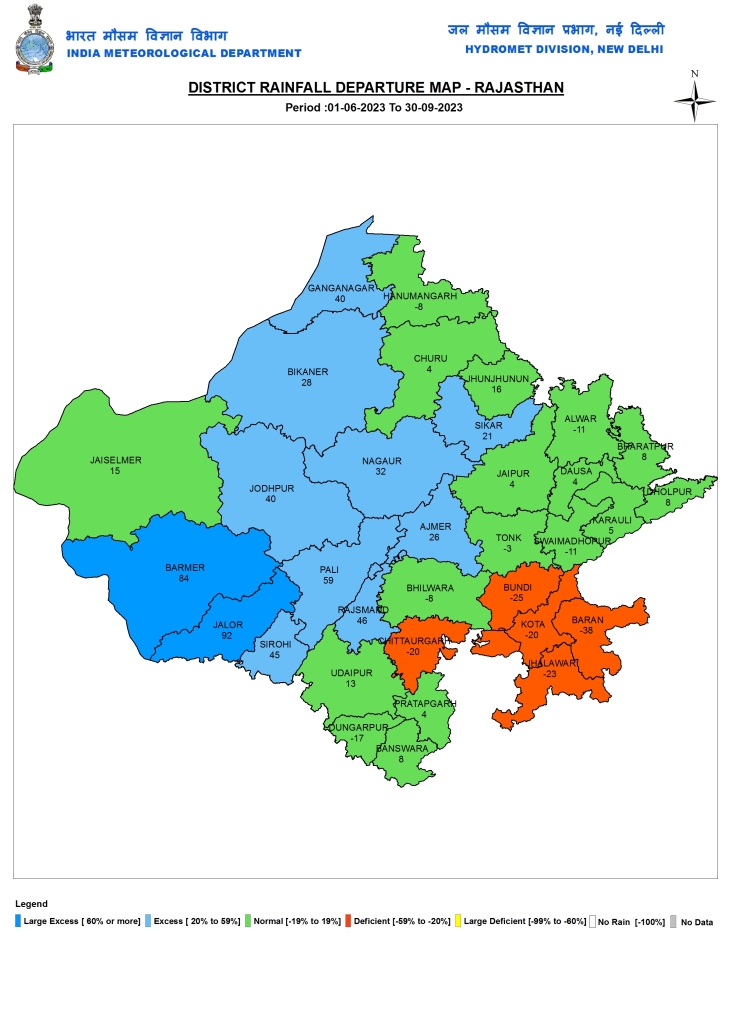
Rajasthan
SANDRP (ht.sandrp@gmail.com)
Relevant Links:
[i] https://sandrp.in/2022/10/01/sw-monsoon-2022-district-wise-rainfall-in-india/
[ii] https://mausam.imd.gov.in/imd_latest/contents/monsoon_withdrawal.php
[iii] https://sandrp.in/2023/07/07/june-2023-district-wise-rainfall-in-indias-sw-monsoon/
[iv] https://sandrp.in/2023/08/04/june-july-2023-district-wise-rainfall-in-in-indias-sw-monsoon/
[v] https://sandrp.in/2023/09/01/june-aug-2023-district-wise-rainfall-in-in-indias-sw-monsoon/
[vi] https://timesofindia.indiatimes.com/india/breaking-4-year-trend-monsoon-ends-with-below-normal-rainfall/articleshow/104077297.cms?from=mdr
[vii] https://timesofindia.indiatimes.com/blogs/toi-editorials/monsoon-message-rainfall-pattern-swung-sharply-every-month-indias-farm-policy-has-to-adapt/
