Maharashtra

El Nino and Maharashtra: Lets dig the Well before we are thirsty

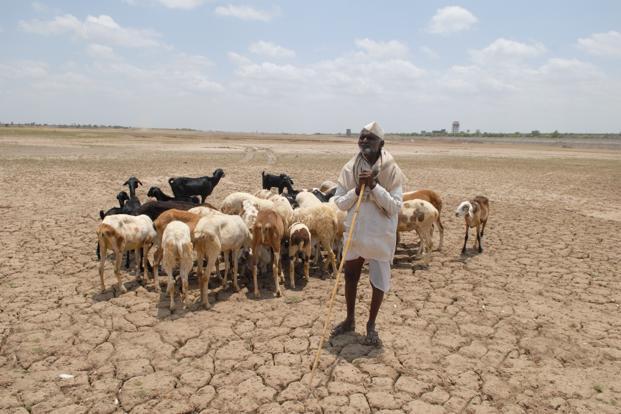
2012-13 was described by the Maharashtra government as the worst drought in the state since 1972. Weather scientists are predicting that conditions are fast developing that seems like a repeat of 2012. The Reserve Bank of India has already warned the states about the possibility of El Nino and be ready for the worse. Maharashtra could take several steps to be ready for this developing situation, including using its available water storage in reservoirs around the state prudently.

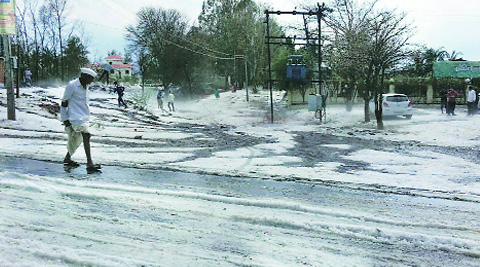
Yes, it’s that time of the year again when we need to be alert to weather predictions and reservoir storages. Especially for Maharashtra. At this time last year, following poor 2012 monsoon, many of the bigger reservoirs were at 0% live storage for months (Ujani, Jayakwadi, several projects in Marathwada, etc). A satisfactory monsoon 2013 and some small contribution from the ill-fated hailstorms has resulted in better status of Maharashtra reservoirs storages at this point in time.

However, Maharashtra (like the country) needs to be extra cautious with using the available resources. Several institutes and bodies like Skymet, Buraeu of Meteorology, Australia, National Weather Service USA, etc. are predicting a strong possibility of El Nino effect this year, which generally results in poor monsoons.  Sky met is specifically saying that this year may be a repeat of 2012 poor monsoons. The report also states that Vidarbha, Marathwada and Central Maharashtra, could face monsoon deficit.[1] Bureau of Meteorology, Australia has issued notice stating a 70% or more chance of El Nino this year. They state “Although the El Niño–Southern Oscillation (ENSO) is currently neutral, surface and sub-surface ocean temperatures have warmed considerably in recent weeks, consistent with a state of rapid transition. International climate models surveyed by the Bureau indicate continued warming of the central Pacific Ocean in coming months. Most models predict sea surface temperatures will reach El Niño thresholds during the coming season.”[2] A similar prediction has been made by US agency National Oceanic and Atmospheric Administration’s Climate Prediction Centre.[3] While some weather scientists are saying that we should not panic and wait for IMD’s (India Meteorological Department) official forecast on April 25 and the next one in June, however, it would certainly be useful to be careful from now onwards.[4]

According to the latest Central Water Commission (CWC) Reservoir bulletin of 090414 regarding water levels in 85 selected major reservoirs in India, the 12 major reservoirs of Maharashtra have a combined storage of 4.471 BCM (Billion Cubic Meters) which is still good 38.73% of live storage capacity of 11.544 BCM.  This is down from 6.522 BCM (over 50%) on Feb 6, 2014. It is not clear where this huge 2 BCM water has been used up in these two months.

However, Maharashtra is indeed lucky to have this 4.471 BCM water in 12 major reservoirs[5] at this time. We need to use this prudently in view of the forecast that situation similar to what prevailed in 2012 when Maharashtra experienced bad drought could get repeated in coming monsoon. Government needs to take advance steps to ensure that storage capacity is not frittered away and there is less land under water intensive sugarcane and such other crops. Media, civil society and independent observers need to be vigilant in this regard to ensure that mistakes of 2012 are not repeated and available resources are used wisely.

In terms of wise water management and effective use of available reservoir storage, waiting for June IMD forecast will be much too late. It will be wiser if water management is cautious starting from now. At this time, already some regions are facing water scarcity.

Maharashtra farmers are already in dire states due to 2012 drought followed by hailstorms and the disastrous impacts of extreme weather events in 2014. Another drought possibility is bad news, but impacts can be reduced with wise planning and prudent advance steps. Maharashtra Water Resources Department Website[6] provides further details about storage position. Let us look at basin-wise water storage position.

Godavari Basin

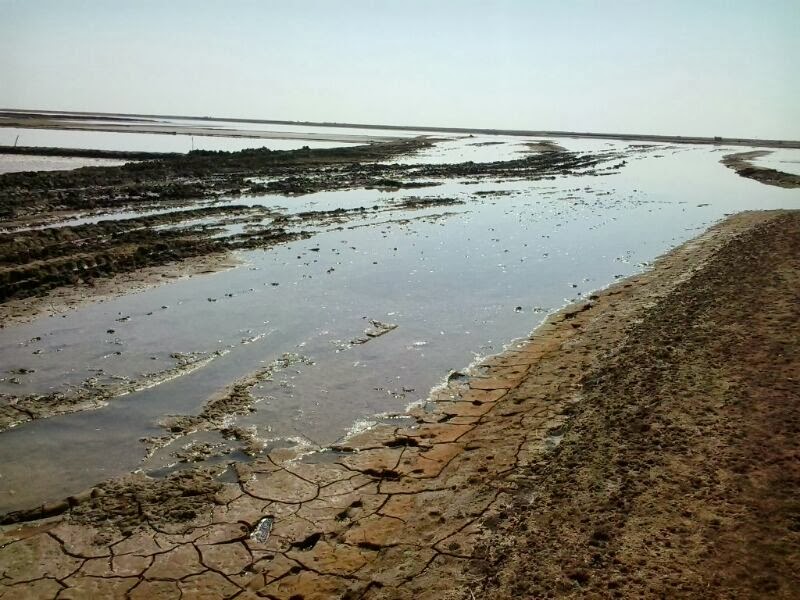
Marathwada: In Marathwada, the overall live storage is 31% on 17th April 2014, including Major, Medium and Minor storages. However, this gives a misleading picture as many dams with better storages (like Vishnupuri) are placed at the end of the basin.

Dams like Manjra, Lower Terna and Seena Kolegao are already at 0 live storage, while Jayakwadi is at 15% (It was at 0%, along with six other dams of Marathwada even before this time last year).

In the upstream of Godavari Basin, Kadwa sub basin is showing severe water scarcity already. The region consists of premier onion and grape growing belt of Maharashtra, as well as wine processing centre. The chronically drought affected town of Manmad lies here and last year, it received water after 51 days in March from the upstream Palkhed Dam.[7] Surprisingly, Palkhed is currently at 5% Live Storage, when this time last year it was at 19% live storage. Water releases from Palkhed were extremely contentious last year. This year with even lesser storage, things may flare up again and wise water management, curb on non-essential uses (in dry period) like wine industry, preventing siphoning water from canals for cash crops, etc., needs to be observed to avoid stress in coming two months or more. Kadwa Dam shows a dipping live storage at 2%, while Nilwande Dam in downstream Ahmednagar shows just 3% against 7% last year.

Vidarbha shows a better picture at 58% live storage, Lowest being Bagh Kalisarar inn Bhandar at zero live storage. Now this project, though in heavy rainfall region of Bhandara has been at 0 live storage since January for the past 6 years! Either the information about the project is incorrect, or the dam has serious issues which need urgent attention.

Krishna-Bhima Basin

Ujani which was at 110% LS earlier this year after many years because of the monsoon in 2013 is now showing LS of 22% on April 17.[8] Two irrigation rotations have been released from the dam. It was reported that last rotation was used up largely by sugarcane,[9] leaving little for other crops. Ujani was at sub-zero storage (-39%) at this time last year. According to that standard, it has a good storage now, which should be used very cautiously. Solapur has added several new sugar factories this year, in addition to the 28 factories and the area under sugarcane has increased tremendously because of good rainfall.[10] Keeping the possibility of a weak monsoon in 2014, water to sugarcane must be controlled and curtailed, else we will see a repeat of 2013, only on a larger scale.

1920 MW Koyana Hydropower Project: Surprisingly in Koyana, the reservoir level this year is worse off than last year at the same time, which is not the case for any other Maharashtra reservoir in CWC bulletin. While this year it is at 30%, last year it was at 47% as on April 9.

Falling Groundwater tables: Recent GSDA report[11] has warned that groundwater levels in more than 2700 villages in Maharashtra has fallen below 1 meter than the average levels in the past 5 years. This is definitely alarming as groundwater is the water lifeline of rural Maharashtra. Out of the 2700 villages, levels in nearly 1200 villages have fallen below two or even three meters (for 497 villages).

Sugarcane: Area under sugarcane has increased in Maharashtra following good rains in 2013. This cane will demand more water in its lifecycle in farm and also for crushing. Agricultural Minister of India too did not find it appropriate to curb the wide spread plantation of sugarcane in drought prone areas even when national and global sugar prices were falling.It is estimated that current year may see more than 10,00,000 hectares of sugarcane which will demand water.The government has not even taken its own promise of enforcing drip to sugarcane.

There seem to be turbulent times ahead and it will be advisable if water management in Maharashtra tightens up to respond to upcoming challenges. The fact that there is useful water storage in some reservoirs and that warning is available in advance could be blessings if necessary steps are taken.

Parineeta Dandekar, parineeta.dandekar@gmail.com

Himanshu Thakkar, ht.sandrp@gmail.com


END NOTES:


[1] http://www.skymet.net/

[2] http://www.bom.gov.au/climate/enso/

[3] http://www.cpc.ncep.noaa.gov/products/expert_assessment/sdo_discussion.html

[4] http://www.downtoearth.org.in/content/el-nino-may-disrupt-monsoons

[5] These 12 reservoir include: Jayakwadi, Ujani, Koyna, Khadakwasla, Isapur, Mula, Yeldari, Girna, Upper Vaitarna, Upper Tapi, Pench and Upper Wardha.

[6] http://mahawrd.org/default.htm

[7] http://www.thehindu.com/todays-paper/tp-national/tp-newdelhi/a-drop-in-the-bucket/article4560869.ece

[8] http://www.agrowon.com/Agrowon/20140415/5237052667319190169.htm

[9] http://www.agrowon.com/Agrowon/20140415/5237052667319190169.htm

[10] https://sandrp.in/Sugarcane_and_Drought_in_Solapur_june2013.pdf

[11] http://www.esakal.com/esakal/20140416/4977647275092496415.htm

Dams, Rivers & People

Dams, Rivers & People – February – March 2014, Vol 12, Issue 1-2

The February – March 2014 edition of SANDRP’s magazine ‘Dams, River and People’ is now available online. This is the 1st-2nd issue of magazine in its 12th volume.  The contents magazine is mentioned in the list below. This edition of the magazine covers varied but very significant issues related with dams, rivers and environment in India. This issues brings together detailed reports on a river protection rally in Western Ghats, blatant violation of environmental laws for construction Yettinahole Diversion Project in Karnataka, impacts of hailstorm on Maharashtra farmers and state’s ‘Inaction’ plan on climate change, a reality check on Narmada Kshipra pipeline project in Madhya Pradesh and a detailed critique of cumulative impact assessment study of Siang river basin in Arunachal Pradesh. The magazine in pdf format is available here — https://sandrp.in/DRP_Feb_Mar_2014.pdf. Several of the articles are also available in SANDRP’s blog and they can be viewed just by clicking on the name in the list. Enjoy reading.

cover page_drp_feb_mar_2014


Contents

Page No
International Day of Action for Rivers: Shalmala River Protection Rally 1
Examplary Fraud in environmental governance! Sonthi LIS in Karnataka 4
Veerappa Moily supports foundation stone laying of Yettinahole Diversion Project 7
Maharashtra farmers face impacts of hailstorms and State’s ‘Inaction’ Plan on Climate Change 9
Bahut kathin hai dagar panghat ki; ab kyo bhar lau pipe-link se ye mataki…. 13
Chinki Major Irrigation Project on Narmada 21
Cumulative Impact Assessment of Siang Basin in Arunachal Pradesh 24
New Publication from SANDRP: Report on Unjustified Dams for Mumbai Metro Region 32


Climate Change

Why is the IPCC’s Mitigation (WG3 summary) report so disappointing?

Extracts from and comments on WG3 summary report of IPCC of April 13, 2014

The summary for policy makers[i] of the Working Group 3 (WG3) report of IPCC (Inter Governmental Panel on Climate Change) Assessment Report 5 (AR5) was made public on April 13, 2014 in Berlin. As Dr Youba Sokono, a co-chair of the IPCC’s working group 3 said said science has spoken with a road-map and as IPCC chair Dr Rajendra Pachauri hoped, high-speed mitigation train was all ready to leave the station with all on board, as reported by BBC.

IPCC scenarios showed world emissions of greenhouse gases would need to tumble by 40-70 % from 2010 levels by 2050, and then to almost zero by 2100, to keep rises below 2C. “Ambitious mitigation may even require removing carbon dioxide from the atmosphere,” the IPCC said. The trouble is, the emissions are still rising as the WG3 report summary report shows and there are no plans in sight to reverse that trend and achieve even these targets that may not be sufficient. In such a situation to talk about rather business as usual low carbon technologies do not sound convincing. 

Here are some important relevant extracts and comments thereon. As IPCC statement in Berlin while releasing this report highlighted, this report is endorsed by the governments and is supposed to provide the main scientific guide for nations working on a UN deal to be agreed in late 2015. While governments of the world have promised to limit the increase in global temperature within 2 degrees C above pre-industrial level (there are many who have questioned if this will be good enough), this report does not provide clear implications of current global warming path and credible road-map to achieve that objective in a equitable, sustainable and democratic way. Many of solutions suggested in this report  including Carbon Capture & Storage, Nuclear Energy, Redd+, CDM and plantations are in reality false solutions, as is also proved by increasing trajectory of emissions in spite of so called actions being taken since over a decade. As a Guardian report on leaked copy of the report warned, it seems this report is largely making business as usual recommendations without showing will to face the reality or learn from past experiences.

According to IPCC, the IPCC WG III assesses options for mitigating climate change through limiting or preventing greenhouse gas emissions and enhancing activities that remove them from the atmosphere. The main economic sectors are taken into account, both in a near-term and in a long-term perspective. The sectors include energy, transport, buildings, industry, agriculture, forestry, waste management. The WG analyses the costs and benefits of the different approaches to mitigation, considering also the available instruments and policy measures. In case of some of the issues, our comment on the IPCC statements is also included. The overall conclusion is that the report is disappointing, but let us first go through some note worthy aspects.

“Total anthropogenic GHG emissions have continued to increase over 1970 to 2010 with larger absolute decadal increases toward the end of this period (high confidence). Despite a growing number of climate change mitigation policies, annual GHG emissions grew on average by 1.0 giga tonne carbon dioxide equivalent (GtCO2eq) (2.2%) per year from 2000 to 2010 compared to 0.4 GtCO2eq (1.3%) per year from 1970 to 2000. Total anthropogenic GHG emissions were the highest in human history from 2000 to 2010 and reached 49 (±4.5) GtCO2eq/yr in 2010.” The figure below provides how the emissions across sectors have been changing over the years. Even at conservative estimates, the emission is likely to have reached 53 GtCO2eq by 2014.

GHG emissions graph WG3 report

“About half of cumulative anthropogenic CO2 emissions between 1750 and 2010 have occurred in the last 40 years (high confidence). In 1970, cumulative CO2 emissions from fossil fuel combustion, cement production and flaring since 1750 were 420±35 GtCO2; in 2010, that cumulative total had tripled to 1300 ±110 GtCO2. Cumulative CO2 emissions from Forestry and Other Land Use (FOLU) since 1750 increased from 490±180 GtCO2 in 1970 to 680±300 GtCO2 in 2010.” It is not clear why the full emission from all sectors was not counted to arrive at this comparative statement.

GHG by sector WG3 report

“Globally, economic and population growth continue to be the most important drivers of increases in CO2 emissions from fossil fuel combustion. The contribution of population growth between 2000 and 2010 remained roughly identical to the previous three decades, while the contribution of economic growth has risen sharply (high confidence). Between 2000 and 2010, both drivers outpaced emission reductions from improvements in energy intensity (Figure SPM.3). Increased use of coal relative to other energy sources has reversed the long‐standing trend of gradual decarbonization of the world’s energy supply.” The equating of contribution from population growth and economic growth this way is a bit inappropriate and in any case, since contribution from economic growth went up, separate figures for the two should have been given.

GHG by type
GHG by type

“Without additional efforts to reduce GHG emissions beyond those in place today, emissions growth is expected to persist. Baseline scenarios, those without additional mitigation, result in global mean surface temperature increases in 2100 from 3.7 to 4.8°C compared to pre-industrial levels” (the increase could be 7.8°C when including climate uncertainty). “For comparison, the CO2eq concentration in 2011 is estimated to be 430 ppm” (uncertainty range means it be as high as 520 ppm).

The Cancún Pledges are likely to keep temperature change below 3°C relative to pre-industrial levels and not below 2°C as is required. This admission that Cancun Pledges (which still does not  a credible road map for implementation) are insufficient is welcome.

“In the baseline scenarios assessed in AR5, direct CO2 emissions from the energy supply sector are projected to almost double or even triple by 2050 compared to the level of 14.4 GtCO2/year in 2010, unless energy intensity improvements can be significantly accelerated beyond the historical development (medium evidence, medium agreement).” In the last decade, the main contributors to emission growth were a growing energy demand and an increase of the share of coal in the global fuel mix.

Regarding electricity generation, RE (Renewable Energy) accounted for just over half of the new electricity‐generating capacity added globally in 2012, led by growth in wind, hydro and solar power. However, the IPCC should not have put all hydro on same pedestal as solar and wind, it is well known that large hydro is not considered among Renewable source of energy.

Questionable certificate to Nuclear Energy and CCS This certificate of the IPCC report to Nuclear Energy is certainly going to be questioned: “Nuclear energy is a mature low‐GHG emission source of baseload power, but its share of global electricity generation has been declining (since 1993). Nuclear energy could make an increasing contribution to low‐carbon energy supply, but a variety of barriers and risks exist (robust evidence,high agreement). Those include: operational risks, and the associated concerns, uranium mining risks, financial and regulatory risks, unresolved waste management issues, nuclear weapon proliferation concerns, and adverse public opinion (robust evidence, high agreement). New fuel cycles and reactor technologies addressing some of these issues are being investigated and progress in research and development has been made concerning safety and waste disposal.”

Similarly, the claim of IPCC report about CCS is questionable: “Carbon dioxide capture and storage (CCS) technologies could reduce the lifecycle GHG emissions of

fossil fuel power plants”. In this respect, the warning issued by the Guardian[ii] based on a leaked copy of the report seems to be correct: “The underlying assumption appears to be that business as usual economic growth must be sustained, and industry and corporate profits must be protected and maintained. But if we focus on ‘business-as-usual economics’, seeking and accepting only bargain basement options for addressing global warming – the costs will be far more severe.”

Hopeful forecast for AFOLU GHG emissions The IPCC report is hopeful about emissions from AFOLU (Agriculture, Forestry and Other Land Use) sector: “Most recent estimates indicate a decline in AFOLU CO2 fluxes, largely due to decreasing deforestation rates and increased afforestation… in the future, net annual baseline CO2 emissions from AFOLU are projected to decline, with net emissions potentially less than half the 2010 level by 2050 and the possibility of the AFOLU sectors becoming a net CO2 sink before the end of century”. However, this is not the situation for India where deforestation continues to be on the rise. Moreover, it is not clear if the IPCC report equates forests with plantations. Similarly it is disappointing to note the IPCC saying that REDD+ is a “cost effective policy option” in forest sector, neglecting to note the huge opposition such measures are facing from the forest dependent populations in India and elsewhere.

No mention of SRI The report concludes, “In agriculture, the most cost‐effective mitigation options are cropland management, grazing land management, and restoration of organic soils”. However, it is disappointing that there is no mention of the huge potential of emission reduction through use of cropping methods like the System of Rice Intensification for rice and various other crops. It is good to see that the report notes that suitability of the conclusion “Bioenergy can play a critical role for mitigation” is limited by concerns of food security, water resources and biodiversity conservation.

Urbanisation “As of 2011, more than 52% of the global population lives in urban areas. In 2006, urban areas accounted for 67–76% of energy use and 71–76% of energy-related CO2 emissions. By 2050, the urban population is expected to increase to 5.6–7.1 billion, or 64–69% of world population. Cities in non-Annex I countries generally have higher levels of energy use compared to the national average, whereas cities in Annex I countries generally have lower energy use per capita than national averages”. However, there is little systematic efforts at tapping the huge potential of mitigation in Urban areas. The report has no success story in this regard. On the other hand there are many examples of urban areas demanding more dams in nearby areas at the cost of forests, rivers, biodiversity and people, without doing any options assessment or exhausting local options. From India, Mumbai[iii], Nashik[iv] and Bangalore[v] provide some examples in this regard.

What are low carbon energy sources? It is disappointing to note that IPCC report brackets “renewables, nuclear and electricity generation with CCS” as “low‐carbon electricity supply”. This is certainly recommendation for business as usual situation, without much change for the USD 1200 billion per year investment sector. This is certainly very questionable.

Are energy efficiency measures working?  The report makes and interesting observation about labeling programs to achieve energy efficiency: “There is general agreement that rebound effects exist, whereby higher efficiency can lead to lower energy prices and greater consumption, but there is low agreement in the literature on the magnitude”. This is particularly relevant since such programs are more likely to benefit more for the richer sections who are polluters in the first place.

“Cap and trade” is not working? The report conclusion in this regard is noteworthy: “Since AR4, cap and trade systems for GHGs have been established in a number of countries and regions. Their short-run environmental effect has been limited as a result of loose caps or caps that have not proved to be constraining”. In India this program is underway in terms of Renewable Energy Certificates (REC) and India’s power ministry rather misguidingly wants to implement this also for large hydro. In absence of any punitive measures for distribution companies not abiding by the CERC norms, there are few takers for the RECs and the price of RECs have also been low.

No attention to abject failures of UNFCCC and CDM The IPCC report says United Nations Framework Convention on Climate Change has “nearly universal participation” and “Kyoto protocol offers lessons towards achieving the ultimate objective of the UNFCCC, particularly with respect to participation, implementation, flexibility mechanisms, and environmental effectiveness”. Nothing can be farther from truth particularly in the context of actual implementation of Clean Development Mechanism (CDM), which is the main vehicle for achieving UNFCCC objectives. CDM has been a vehicle for perpetrating further environmental degradation, destruction of forests, biodiversity, rivers and livelihoods of people to basically benefit the private sector’s business as usual projects and with no benefits or participation for the local communities. The process of certifying the CDM projects as sustainable and additional in terms of emission reduction have proved to be complete failure as numerous examples from India and elsewhere show.

“Sustainable development and equity provide a basis for assessing climate policies and highlight the need for addressing the risks of climate change. Limiting the effects of climate change is necessary to achieve sustainable development and equity, including poverty eradication.” This sounds good, but there are no credible recommendations in the report to achieve equity or sustainable development.

“Effective mitigation will not be achieved if individual agents advance their own interests independently. Climate change has the characteristics of a collective action problem at the global scale, because most greenhouse gases (GHGs) accumulate over time and mix globally, and emissions by any agent (e.g., individual, community, company, country) affect other agents.” This is welcome indeed and should have been added that there are different classes of people who are polluters, different from those who are vulnerable to the impacts of such pollution.

“Important options for mitigation in waste management are waste reduction, followed by reuse, recycling and energy recovery (robust evidence, high agreement). Waste and wastewater accounted for 1.5 GtCO2eq in 2010. As the share of recycled or reused material is still low (e.g., globally, around 20% of municipal solid waste is recycled), waste treatment technologies and recovering energy to reduce demand for fossil fuels can result in significant direct emission reductions from waste disposal.” Indeed, but there are no credible measures to achieve progress on this front, particularly in country like India.

“Policies governing agricultural practices and forest conservation and management are more effective when involving both mitigation and adaptation. Some mitigation options in the AFOLU sector (such as soil and forest carbon stocks) may be vulnerable to climate change (medium evidence, high agreement). When implemented sustainably, activities to reduce emissions from deforestation and forest degradation (REDD+ is an example designed to be sustainable) are cost‐effective policy options for mitigating climate change, with potential economic, social and other environmental and adaptation co‐benefits (e.g., conservation of biodiversity and water resources, and reducing soil erosion) (limited evidence, medium agreement).” This recommendation of REDD+ is seriously problematic considering the opposition to such measures from forest dependent communities all over the world, including India. This shows how cut off from ground is the report.

Gas a bridge fuel? As BBC report [vii] noted, one of the surprising endorsements in the report is natural gas: “Emissions from energy supply can be reduced significantly by replacing current world average coal-fired power plants with modern, highly efficient natural gas combined-cycle power plants,” says the summary. However, gas is itself a fossil fuel, extraction of gas has its impacts and the extraction of shale gas, the newest and hottest source has worse kind of impacts. Without looking at all these issues, recommending gas as a bridge fuel is not likely to be convincing.

Conclusion The summary of the Working Group 3 report of the IPCC’s fifth Assessment Report is disappointing considering that it has failed provide the current status of climate change and its implications in 2020, 2030, 2050 and 2100 for the various sections of  the global society, particularly the vulnerable ones in clear terms. This conclusion seems justified even though the report does have certain welcome statements and recommendations as mentioned above. Since this is the summary for the policy makers and governments, it is a very crucial document, even as we await the full publication of the report. A number of recommendations of the report are  disappointing and unscientific, including: continued use of fossil fuels with questionable Carbon (dioxide) Capture & Storage techniques, nuclear energy, and putting  them in same footing as Renewables like solar, wind and micro hydro; equating plantation and forests, omission of SRI, omission of democratic and participatory governance, omission of identification of vulnerable sections, omission of critical view of CDM implementation and keeping them in focus and lack of sufficient emphasis on equity. The lack of recommendation that climate change polluters among the developed countries and rich sections of developing countries be made to pay for the pollution and upholding the principle of equity at global, national and local section is glaring. The report mentions nothing about need to reduce the demand. We hope the full WG3 report does not have more worrying aspects and has more hopeful recommendations.

Himanshu Thakkar, ht.sandrp@gmail.com

END NOTES:

[i] http://report.mitigation2014.org/spm/ipcc_wg3_ar5_summary-for-policymakers_approved.pdf

[ii] http://www.theguardian.com/environment/earth-insight/2014/apr/07/ipcc-un-climate-change-mitigation-wg3-worsen-geoengineering

[iii] https://sandrp.wordpress.com/2013/12/20/dams-in-tribal-areas-of-western-ghats-for-water-supply-to-mumbai-why-are-they-unjustified/,

https://sandrp.wordpress.com/2013/12/18/multiple-dams-for-mumbai-region/,

https://sandrp.wordpress.com/2014/02/28/crisis-in-indias-urban-water-sector/

[iv] https://sandrp.wordpress.com/2013/07/26/forest-advisory-committee-does-not-clear-a-dam-project-in-western-ghats-of-nashik-affecting-nearly-1000-hectares-of-land-in-the-absence-of-relevant-studies-information-and-compliance/,

https://sandrp.wordpress.com/2013/07/09/can-a-dam-submerging-1000-ha-be-encouraged-only-because-its-drinking-water-project/

[v] https://sandrp.wordpress.com/2014/01/30/open-letter-to-dr-veerappa-moily-as-he-supports-foundation-stone-laying-of-yettinahole-diversion-project/

[vi] https://sandrp.wordpress.com/2014/04/03/dams-are-not-climate-friendly-readings-from-ipcc-wg-ii-report/

[vii] http://www.bbc.com/news/science-environment-27008352

[ix] On 24 April 2014 on email:

The edits to the summary of the IPCC’s recent report, were all about governments vying for position ahead of crucial UN climate talks in Paris next year. –‘Censored’ IPCC summary reveals jockeying for key UN climate talks by David Stern, Australian National University
One of the graphs dropped from the summary  shows that per capita emissions have grown rapidly in middle-income countries like China and India, but have declined in both the richest and the poorest countries. Despite that, it also shows that per capita emissions remain much higher in the developed world than in developing countries.

Another graphs which was dropped shows that the greenhouse gases emitted to produce goods destined for rich countries outweigh the emissions created by rich countries to make goods for export elsewhere. Naturally, the reverse is necessarily true for middle- and low-income countries

Hydropower Performance · Narmada

Narmada dams’ levels depleted to generate more electricity: Threatening water security for Gujarat and Madhya Pradesh

An analysis of the available information on water levels and live storage % during February and March 2014 raises questions marks about the reasons for depletion of water levels in these dams when there was no apparent need. It prime facie seems to indicate that this has been done to generate more electricity in view of impending elections. However, this is likely to threaten water security of the people of Madhya Pradesh and Gujarat during coming summer months. It could also raise difficulties in post summer period if monsoon is deficit as seems to be indicated by the rapidly developing El Nino conditions. In table below we have given these figures for the Sardar Sarovar and Indira Sagar Dams, the biggest dams on Narmada in Gujarat and Madhya Pradesh.

Intake well at Kasrawad. Last intake hole is above the water level Photo: Pancham Choyal, Badwani Bureau chief of Patrika

 Level change in SSP and NSP between Feb 6 and April 9, 2014

Project Particulars Feb 6 Feb 13 Feb 20 Feb 27 Mar 6 Mar 13 Mar 20 Mar 27 Apr 9
SSP level m 121.47 120.88 119.8 117.79 117.31 115.62 115.12 113.88 114.82
% live storage 95 (58) 88 (55) 76 (51) 59 (48) 53 (58) 38 (60) 33 (57) 22 (53) 31 (58)
ISP level m 255.27 254.7 254.38 254.11 253.76 253.49 253 252.5 251.39
% live storage 47 (48) 43 (47) 41 (47) 40 (46) 37 (41) 35 (39) 34 (35) 31 (34) 26 (28)

Note: figures in bracket with those % live storage levels are the figures for % live storage same date last year.

Source: CWC weekly reservoir level updates. Strangely, the Apr 3, 2014 bulletin does not provide the reservoir details, see: https://docs.google.com/folderview?usp=sharing&id=0B2IHafYlWNipTm1wVXhXelV4RDg

It is clear from the above figures that level and % live storage of water in Sardar Sarovar Project (SSP, on Narmada River in Gujarat, considered Gujarat’s lifeline by Gujarat politicians and government) has drastically reduced from 95% on Feb 6, 2014 to just 22% on March 27, to rise slightly to 31% on April 9. The level last year remained almost constant between 58% and 53% during the same period.

News

In case of upstream Indira Sagar Project (ISP) in upstream on Narmada River in Madhya Pradesh too the level has been drastically reduced from 47% on Feb 6, 2014 to 26% on April 9, 2014. There was no need for this depletion and water stored could have been of use during summer. Here too it seems level has been reduced to generate more power, again at the cost of water security for people of Madhya Pradesh and Gujarat.

bank of Narmada at Rajghat. Gandhi Samadhi is also being seen in the background Photo: Pancham Choyal, Badwani Bureau chief of Patrika

It should be noted here that the storage gets depleted to the extent water is released from dams for hydropower generation and when water is released from 1200 MW River Bed Power House (RBPH) of SSP, it is not even useful for irrigation. Only water released through the 250 MW Canal Head Power House (CHPH) of SSP goes into canals and can be used for irrigation or water supply.

Overflowing Sardar Sarvor Dam in Monsoon 2013: Source: PTI

There was no need for this depletion and considering the impending summer and likelihood of deficit monsoon in view of developing El Nino conditions[1]. It seems the level has been depleted for generating extra electricity in view of ongoing elections, risking the water security for the Gujarat’s drought prone areas in coming summer. It should be disturbing that water level in SSP should reach such low level of 22% by March 27 this year when the monsoon was above average and water level at SSP reached its highest level till date in the monsoon. This mismanagement also punctures the hole in the oft repeated claim of the Gujarat government that Gujarat is suffering as it is not allowed to increase the dam height. If Gujarat cannot use water available at current dam height in optimal way, where is the case for increasing dam height?

Narmada river be between Kasrawad and Rajghat Photo: Pancham Choyal, Badwani Bureau chief of Patrika

Hydropower Generation The figures of electricity generation from these projects (and also Omkareshwar also on Narmada in Madhya Pradesh between ISP and SSP) from the official website of Central Electricity Authority (http://cea.nic.in/monthly_gen.html) for Feb and March 2014 and 2013 are given below.

Project Power stations February March
2014 2013 2014 2013
SSP RBPH 340.96 51.74 301.61 154.89
CHPH 48.48 17.09 44.3 47.92
Total 389.44 68.83 345.91 202.81
NHDC ISP 230.76 120.67 242.94 223.21
OHP 106.23 68.08 109.18 116.75
Total 336.99 188.75 352.12 339.96

Note: All figures in Million Units (One Unit is one Kilowatt hour). All figures from Central Electricity Authority Website. The figures for March 2014 are tentative, but the final figures do not change much as past experience shows. RBPH: River Bed Power House; CHPH: Canal Head Power House; OSP: Omareshwar Hydropower Project; NHDC: Earlier known as Narmada Hydroelectric Development Corporation (http://www.nhdcindia.com/ a joint venture of Govt of Madhya Pradesh and NHPC Ltd)

It is clear from these figures that electricity figures at SSP and NHDC hydropower stations have certainly been much higher during Feb-March 2014 compared to the same months the previous year. For SSP, the total power generation during Feb March 2014 was 735.35 Million Units, compared to 271.64 MU during the same period last year, the increasing being huge 171% in 2014 compared to the same in 2013. In case of NHDC stations, the generation during Feb Mar 2014 was 689.11 MU, compared to 528.71 in Feb Mar 2013, increase in 2014 period being 30.33% higher in 2014. Thus it is clear that much higher amount of power has been generated during Feb Mar 2014 at SSP and NHDC stations compared to same period previous month, at the cost of depletion of water level in the SSP and ISP. The power benefits from SSP are shared in the ratio of 57: 27: 16 % for MP: Maharashtra: Gujarat.

While people in Gujarat and Madhya Pradesh are likely to suffer in coming summer and monsoon due to this unjustifiable depletion of these reservoirs, some people are already suffering. For example, as reported by newspapers[2], Badwani city water supply in Madhya Pradesh has already suffered as the water level in the river has gone the lowest intake level. The report says that Badwani does not even get regular electricity to lift water from the river for city water supply. So even as SSP and NHDC power stations are generating extra power, it is not being made available to such small towns. Worse days are in store, it seems. With electricity demand and rates in Feb and March being lower than in summer, it also raises the question as to how prudent it was to generate this power in winter and not in summer when demands and rates of electricity are higher.

As  Energylineindia.com reported on April 14, 2014, “in February 2014, the PLF of thermal power plants was at 68.44% against the target of 71.3% on account of weak off-take of power… reason for lower thermal PLF is higher hydro generation. Hydel plants in February 2014 reported a 7.70% higher generation than what was programmed for the month. Hydel power generation is up by a whopping 25.98% in February 2014 as compared to the corresponding period in the previous year.” This also seems to be the case for March 2014. Thus, higher hydro generation during Feb-March 2014 actually led to backing down of thermal power plants, thus the Plant Load Factor of thermal power plans was lower in these winter months when electricity demands are not at peak. However, when electricity demand will be at peak in coming summer, these projects wont have water to generate power! Who will hold the operators of these projects accountable for this questionable decisions?

Reservoir storage at all India level At all India level, Central Water Commission provides storage situation for 85 reservoirs (37 of these reservoirs have hydropower component with installed capacity over 60 MW and total live storage capacity of 111.73 BCM) in its weekly bulletins, these reservoirs have total live storage capacity of 155.05 BCM (Billion Cubic Meters). On Feb 6, 2014, these reservoirs had a healthy 88.934 BCM in live storage, amounting to 57% of live storage capacity. By April 9, 2014 (the latest CWC bulletin), the storage in these reservoirs had dwindled to 59.581 BCM, just about 38% of live storage capacity. We hope these reservoirs are not further depleted in view of ongoing elections.

Not for the first time This is not happening for the first time in India[3]. During 2004 and 2009 elections too reservoir levels were unjustifiably depleted for additional electricity generation and people suffered in following monsoon when there were deficit monsoons. While in case of Narmada dams, the responsible agencies for reservoir operation decisions are state governments, Narmada Control Authority and Union Ministry of Water Resources in case of other dams, Central Water Commission is also responsible.

This again raises the recurring issue of more transparent, accountable and participatory reservoir management, which is completely absent in India. Without such a regime, politicians are likely to use the reservoir water as per their own agendas, to the detriment of the people and economy.

Rehmat M (Manthan Adhyayan Kendra, Badwani, r9300833001@gmail.com, 09300833001)

Himanshu Thakkar (SANDRP, Delhi, ht.sandrp@gmail.com, 09968242798)

Small temple on the Rajghat Ghat submerged Sardar Sarovar Dam, In the background are Rajghat bridge and Chikhalda village Photo: Pancham Choyal, Badwani Bureau chief of Patrika


END NOTES:

[1]http://articles.economictimes.indiatimes.com/2014-04-09/news/49000001_1_excess-rainfall-monsoon-forecast-normal-rainfall

[2] Dainik Bhaskar, April 9, 2014: http://epaper.bhaskar.com/detail/?id=546908&boxid=4902654906&ch=mpcg&map=map&currentTab=tabs-1&pagedate=04/09/2014&editioncode=363&pageno=1&view=image

[3] For exmaple, in case of Bhakra, the way the reservoir level was allowed to deplet in summer of 2012 had consequences in subsequent monsoon: https://sandrp.in/dams/PR_Why_precarious_water_situation_at_Bhakra_dams_was_avoidable_July_2012.pdf

[4] http://www.business-standard.com/article/economy-policy/indias-power-conundrumspot-power-prices-crash-to-lowest-ever-dipping-below-ntpcs-average-tariff-for-the-first-time-114041000455_1.html

ARTICLE IN HINDI TRANSLATED BY REHMAT OF MANTHAN ADHYAYAN KENDRA:

ज्यादा बिजली बनाकर नर्मदा का जलस्तर घटाया

मध्यप्रदेश और गुजरात में पेयजल सुरक्षा खतरे में

सरदार सरोवर और नर्मदा सागर बाँधों के जलस्तर और उनके उपयोगी भण्डारण (प्रतिशत में) के फरवरी और मार्च 2014 के आँकड़ों के विश्लेषण से इन बाँधों का जलस्तर घटाने पर गंभीर सवाल खड़े हुए हैं क्योकि जाहिर तौर पर ऐसी कोई जरूरत नहीं है। प्रथमदृष्टया यह आम चुनाव के मद्देनज़र ज्यादा बिजली उत्पादन के लिए किया जाना प्रतीत होता है। जलस्तर कम किए जाने से आगामी गर्मी में नर्मदा किनारे स्थित मध्यप्रदेश और गुजरात की शहरी आबादियों की जल सुरक्षा खतरे में पड़ने की संभावना है। यदि अल नीनो प्रभाव के कारण बारिश में कमी हुई तो गर्मी के बाद भी जलसंकट बना रह सकता है। इस स्थिति को स्पष्ट करने के लिए नीचे की तालिका में नर्मदा पर गुजरात और मध्यप्रदेश में बने सबसे बड़े बाँधों क्रमशः सरदार सरोवर और इंदिरा सागर के आँकड़े दिए गए हैं।

6 फरवरी से 9 अप्रैल 2014 के मध्य जलाशयों के जलस्तर में बदलाव
परियोजना का नाम विवरण 6फरवरी 13फरवरी 20फरवरी 27फरवरी 6 मार्च 13मार्च 20मार्च 27मार्च 9 अप्रैल
सरदार सरोवर जलस्तर, मीटर में 121.47 120.88 119.8 117.79 117.31 115.62 115.12 113.88 114.82
उपयोगी जल भण्डार, प्रतिशत में 95 (58) 88 (55) 76 (51) 59 (48) 53 (58) 38 (60) 33 (57) 22 (53) 31 (58)
इंदिरा सागर जलस्तर, मीटर में 255.27 254.7 254.38 254.11 253.76 253.49 253 252.5 251.39
उपयोगी जल भण्डार, प्रतिशत में 47 (48) 43 (47) 41 (47) 40 (46) 37 (41) 35 (39) 34 (35) 31 (34) 26 (28)
नोट – उपयोगी जल भण्डार के प्रतिशत वाली पक्ति में कोष्ठक में दिए गए आँकड़े पिछले वर्ष के इन्हीं तारीखों के हैं। इन आँकड़ों का स्रोत केन्द्रीय जल आयोग द्वारा साप्ताहिक जारी किए जाने वाले जलाशयों के स्तर संबंधी अपडेट है। आश्चर्यजनक रूप से 3 अप्रैल 2014 को जारी बुलेटिन में जलाशयों के कोई आँकड़े नहीं दिए गए हैं। इन बुलेटिनों को यहाँ देखा जा सकता है –https://docs.google.com/folderview?usp=sharing&id=0B2IHafYlWNipTm1wVXhXelV4RDg

उपरोक्त आँकड़ों से स्पष्ट है कि सरदार सरोवर जलाशय (नर्मदा पर बने इस बाँध को गुजरात के राजनेता और सरकार गुजरात की जीवनरेखा बताते हैं) का उपयोगी जलभण्डारण 6 फरवरी से 27 मार्च 2014के मध्य 95% से घटकर मात्र 22% रह गया था जो 9 अप्रैल को हल्का सा बढ़कर 31% हुआ है। पिछले वर्ष इसी अवधि में ये आँकड़े 58 से 53% के मध्य स्थिर थे।

नर्मदा के ऊपरी क्षेत्र मध्यप्रदेश में बने इंदिरा सागर जलाशय में भी 6 फरवरी से 27 मार्च 2014 के मध्य जलभण्डारण 47% से घटाकर मात्र 27% कर दिया गया है। इस उपलब्ध जलभण्डारण को गर्मी के दिनों के लिए सुरक्षित रखने के बजाय अनावश्यक रूप से कम किया जा रहा है। ऐसा लगता है कि चुनावी फायदे के लिए अधिक बिजली उत्पादन कर जल भण्डारण में कमी कर मध्यप्रदेश और गुजरात के लोगों की जल सुरक्षा को दाँव पर लगा दिया गया है।

आसन्न ग्रीष्म ऋतु और अलनीनो प्रभाव के कारण अगले मानसून में कमी[i] की आशंका के मद्देनज़र भण्डारित जल में कमी करना उचित नहीं है। ऐसा लगता है कि वर्तमान में जारी लोकसभा चुनाव के कारण अतिरिक्त बिजली पैदा करने हेतु जलाशयों को खाली किया जा रहा है जिससे गुजरात के सूखा प्रभावित क्षेत्रों की जल सुरक्षा खतरे में पड़ गई है। आगामी मानसून में बारिश में कमी या देरी से नर्मदा जल पर आश्रित भोपाल और इंदौर जैसे शहरों में भी जल उपलब्धता प्रभावित हो सकती हैं। हाल ही में जोरशोर से प्रारंभ की गई नर्मदा-क्षिप्रा पाईप लाईन योजना भी नर्मदा में पानी की कमी के कारण अनुपयोगी हो सकती है। यह दुःखद है कि गर्मी का मौसम शुरू होने के पहले 27 मार्च को ही सरदार सरोवर में जलभण्डारण घटाकर मात्र 22% कर दिया गया था जबकि पिछले वर्ष पूरे देश में औसत से अधिक बारिश हुई है और मानसून में सरदार सरोवर जलाशय अपने उच्चतम स्तर तक भर गया था।

गुजरात सरकार दावा करती है कि सरदार सरोवर की ऊँचाई नहीं बढ़ाए जाने के कारण उनका राज्य पीड़ित है। लेकिन सरदार सरोवर के पानी के इस कुप्रबंधन से इस दावे की हवा निकल गई है। यदि गुजरात सरकार बाँध की वर्तमान ऊँचाई पर उपलब्ध जलभण्डार का ही महत्तम उपयोग करने में ही सक्षम नहीं है तो फिर बाँध की ऊँचाई बढ़ाने का सवाल ही कहाँ उठता है?

पनबिजली उत्पादन – केन्द्रीय विद्युत प्राधिकरण (http://cea.nic.in/monthly_gen.html) द्वारा जारी इन परियोजनाओं (औंकारेश्वर परियोजना सहित) से फरवरी-मार्च 2014 और 2013 के बिजली उत्पादन के आँकड़े निम्नानुसार है –

परियोजना/कंपनी बिजलीघर फरवरी मार्च
2014 2013 2014 2013
सरदार सरोवर परियोजना नदी तल बिजलीघर 340.96 51.74 301.61 154.89
नहर मुख बिजलीघर 48.48 17.09 44.3 47.92
योग 389.44 68.83 345.91 202.81
नर्मदा हाईड्रोइलेक्ट्रिक डेवलपमेंट कार्पोरेशन(एनएचडीसी) इंदिरा सागर परियोजना 230.76 120.67 242.94 223.21
औंकारेश्वर जलविद्युत परियोजना 106.23 68.08 109.18 116.75
योग 336.99 188.75 352.12 339.96
नोट-आँकड़े मिलियन यूनिट में है (एक यूनिट एक किलोवाट घण्टा के बराबर होता है)। सारे आँकड़े केन्द्रीय विद्युत प्राधिकरण की वेबसाईट से लिए गए हैं। मार्च 2014 के आँकड़े अनंतिम है लेकिन पिछले अनुभवों से स्पष्ट है कि अंतिम आँकड़ों में भी कोई खास बदलाव नहीं होता है। नर्मदा हाईड्रोइलेक्ट्रिक डेवलपमेंट कार्पोरेशन (http://www.nhdcindia.com/ )मध्यप्रदेश सरकार और राष्ट्रीय पनबिजली निगम का संयुक्त उपक्रम है। 

उपरोक्त आँकड़ों से स्पष्ट है कि सरदार सरोवर और एनएचडीसी (नर्मदा हाईड्रोइलेक्ट्रिक डेवलपमेंट कार्पोरेशन) के पन बिजलीघरों से पिछले वर्ष के फरवरी-मार्च महीनों की अपेक्षा इस वर्ष के फरवरी-मार्च महीनों में विद्युत उत्पादन काफी अधिक था। सरदार सरोवर परियोजना से फरवरी-मार्च 2014 में 735.35 मिलियन यूनिट बिजली का उत्पादन किया गया जबकि पिछले वर्ष इसी अवधि में 271.64 मिलियन यूनिट था। इस वर्ष बिजली उत्पादन में 171% की भारी वृद्धि की गई है। एनएचडीसी के बिजलीघरों से फरवरी-मार्च 2014 में 689.11 मिलियन यूनिट बिजली उत्पादित की गई जबकि पिछले वर्ष इसी अवधि में 528.71 मिलियन यूनिट बिजली का उत्पादन किया गया था। इस प्रकार पिछले वर्ष की अपेक्षा यहाँ भी 30.33% बिजली उत्पादन बढ़ाया गया है। इस प्रकार स्पष्ट है कि सरदार सरोवर और एनएचडीसी के बिजलीघरों से इस वर्ष फरवरी-मार्च में पानी के भण्डारण की कीमत पर बहुत ज्यादा बिजली उत्पादन बढाया गया है। सरदार सरोवर से उत्पादित बिजली का लाभ मध्यप्रदेश, महाराष्ट्र और गुजरात को क्रमशः 57,  27 और 16% के अनुपात में मिलता है।

हालांकि जलभण्डारण में इस अनुचित कमी के कारण मध्यप्रदेश और गुजरात के लोग तो आगामी गर्मी और मानसून में प्रभावित होने वाले हैं ही लेकिन कुछ तो अभी से प्रभावित हो चुके हैं।[ii] सरदार सरोवर जलाशय के स्तर में अचानक कमी कर दिए जाने से बड़वानी की जलप्रदाय व्यवस्था बुरी तरह प्रभावित हुई है। बिजली की कटौती के कारण वैकल्पिक व्यवस्था में भी परेशानी आ रही है। सरदार सरोवर परियोजना और एनएचडीसी द्वारा भारी मात्रा में उत्पादित बिजली का लाभ भी बड़वानी जैसे छोटे कस्बों को नहीं मिल रहा है। लगता है आगे आने वाले दिन और अधिक मुश्किलों भरे होंगें। फरवरी-मार्च महीने में बिजली की माँग और राष्ट्रीय स्तर पर इसकी दरें गर्मी के दिनों के मुकाबले काफी कम होती है। यहाँ यह उल्लेखनीय है कि खेती में बिजली की माँग अभी तक शुरू नहीं हुई है। कपास की अगेती फसल (early crop)की बुआई मई के पहले सप्ताह से शुरू होती है और पानी की उपलब्धता के आधार पर जून के पहले सप्ताह तक चलती है। ऐसे में सवाल उठता है कि माँग और दरों में कमी के दौर में बिजली का भारी उत्पादन कौनसी बुद्धिमानी है?

राष्ट्रीय स्तर पर जलाशयों में भण्डारण – केन्द्रीय जल आयोग अपने साप्ताहिक बुलेटिन के माध्यम से राष्ट्रीय स्तर पर 85 जलाशयों (इनमें से 37 जलाशयों, जिनकी भण्डारण क्षमता 111.73 करोड़ घनमीटर है, में 60 मेगावाट से अधिक का पनबिजली घटक भी शामिल है।) के भण्डारण की स्थिति के बारे में जानकारी उपलब्ध करवाता है जिनकी कुल भण्डरण क्षमता 155.05 करोड़ घनमीटर है। 6 मार्च 2014 को इन जलाशयों में 88.934 करोड़ घनमीटर यानी कुल भण्डारण का 57% उपलब्ध था। लेकिन 9 अप्रैल आते तक भण्डरण मात्र 59.581 करोड़ घनमीटर यानी कुल भण्डारण का 38% ही बचा था। उम्मीद है कि ये इन जलाशयों का भण्डारण अब और चुनावी फायदों के लिए घटाया नहीं जाएगा।

ऐसा पहली बार नहीं हुआ – चुनावी लाभ के लिए ऐसा पहली बार नहीं हुआ है।[iii] वर्ष 2004 और 2009 के आम चुनावों के दौरान भी अतिरिक्त बिजली उत्पादन के लिए अनुचित तरीके से जलाशयों को खाली किया गया था और अगले मानसून में कमी के कारण लोगों को इसका खामियाजा भुगतना पड़ा था। नर्मदा पर बने बाँधों के मामले में जलस्तर का नियमन राज्य सरकारें, नर्मदा नियंत्रण प्राधिकरण और केन्द्रीय जल संसाधन मंत्रालय द्वारा किया जाता है। अन्य बाँधों के मामले में केन्द्रीय जल आयोग भी जिम्मेदार होता है।

अधिक पारदर्शी, जवाबदेह और सहभागी जलाशय प्रबंधन, जो भारत में नदारद है, का बारंबार उठने वाला सवाल यहाँ फिर उठता है। जब तक व्‍यवस्‍था में सुधार नहीं होता राजनेता जलाशयों के पानी का अपने एजेण्डे के अनुसार उपयोग करते रहेंगें और आम देशवासी और देश की अर्थव्यवस्था इसकी कीमत चुकाने को मजबूर रहेंगें।

–    रेहमत (मंथन अध्ययन केन्द्र, बड़वानी, R9300833001@gmail.com, 09300833001)

–    हिमांशु ठक्कर (दक्षिण एशियाई बाँधों, नदियों और लोगों का नेटवर्क, दिल्ली ht.sandrp@gmail.com, 09968242798)

 टिप्पणियाँ

[i]   इकॉनॉमिक टाईम्स, 9 अप्रैल 2014:  http://articles.economictimes.indiatimes.com/2014-04-09/news/49000001_1_excess-rainfall-monsoon-forecast-normal-rainfall

[ii]   दैनिक भास्कर, 9अप्रैल 2014: http://epaper.bhaskar.com/detail/?id=546908&boxid=4902654906&ch=mpcg&map=map&currentTab=tabs-1&pagedate=04/09/2014&editioncode=363&pageno=1&view=image

[iii] उदाहरण के लिए भाखड़ा बाँध के जलाशय का भण्डारण वर्ष 2012 की गर्मी में जिस तरह से घटाया गया उसके असर आगामी मानसून में दिखाई दिए : https://sandrp.in/dams/PR_Why_precarious_water_situation_at_Bhakra_dams_was_avoidable_July_2012.pdf

Dams

The World Bank drops funding USD 650 m for the LUHRI Hydro project! Victory for the Sutlej Bachao Jan Sangharsh Samiti

The World Bank has decided not to lend financial assistance to the massive Luhri Hydropower project on Sutlej River in Himachal Pradesh. The World Bank, which was to provide a huge USD 650 million to the $ 1150 million project, on its website now indicates[i] the status of the project as DROPPED. Environmental groups and local affected people under the banner of Sutlej Bachao Jan Sangharsh Samiti consider this is a major victory for the campaign to save the last remaining stretch of “free”[ii] flowing Sutlej River.

Protest against Luhri Dam

Continue reading “The World Bank drops funding USD 650 m for the LUHRI Hydro project! Victory for the Sutlej Bachao Jan Sangharsh Samiti”

Climate Change · Maharashtra

Maharashtra State Action Plan on Climate change: Farmers Suffer, State and consultant TERI unaffected

Even as rural areas in otherwise-drought hit Maharashtra (as also in neighbouring areas of Karnataka, Madhya Pradesh and Chhattisgarh) are trying to cope with the immense damages due to untimely rain and hailstorms in Feb-March 2014, the IPCC Assessment Report 5 by Working Group II warns that extreme weather events may increase in their frequency. This was also supported by the IPCC Special Report on Extreme Events in 2012.

Sr NoEventDate
1NAPCC made publicJune 30, 2008
2Mah state council on CC formed by a GRSept 2008
3Work awarded to TERI “to assess Climate Change Vulnerability and Adaptation Strategies for Maharashtra State and to prepare a Climate Change Adaptation Action Plan for the State” at the cost of Rs 98 lakhs; to include six case studiesAug 20, 2009
4Maharashtra govt order regarding TERI (6 members in addition to Dr Pachauri and Dr Leeana Srivastava as advisors) given above task, along with Met office, Hadley Centre, UK (2 members) and formation of state coordination committee for this under the chairmanship of Chief SecretaryNov 26, 2009
5Dept of Environment conducted decision makers workshop CC adaptation and mitigationFeb 24-25, 2011
6State advisory committee on CC created with chief minister as chairJuly 8, 2011
7First meeting of State advisory committee on CCFeb 2013
8Meeting (latest) held on draft climate change action plan with Chief Secy in chairOct 7, 2013
9Mah Env department gives RTI response to SANDRP: “The final action plan on climate change is not yet submitted by TERI to Govt of Maharashtra”Apr 2, 2014

Back to back in two years, Maharashtra faced a drought (in 2012-13), touted to be worst in past 40 years, to a hail and rain event which broke records of past hundred years (and perhaps even more) several times over. Studies are pointing out that the coastal region and the traditionally drought-affected part of Marathwada and Vidarbha is specifically vulnerable to climate change.

Drought 2013. Photo: Mint

It is also highlighted by the IPCC reports, experienced painfully by Maharashtra that: “Risks are unevenly distributed and are generally greater for disadvantaged people and communities in countries at all levels of development.”

So how prepared is Maharashtra to face, adapt to and mitigate the challenges put forth?

Information obtained by SANDRP under RTI underlines the fact that respective governments have given no priority, time or importance to consider climate change or its impacts on societies and ecosystems.

The Maharashtra State Council on Climate change was formed in Sept 2008 by a GR, its Chairperson was the then Chief Minister and included ministers from Agriculture, Water resources, Industries, etc. This Council awarded work related to State Action Plan on Climate Change to TERI on 20th Aug 2009 and TERI was supposed to complete this Study in two years,  that is by Aug 2011.

More than four and a half years latter, TERI has still not completed the report on State Action Plan on Climate change and Government of Maharashtra does not seem too bothered by it.

The process by which TERI was given the task of doing the SAPCC also seems inappropriate. The process is described in Maharashtra government order of Nov 16, 2009, where there is no mention of any competitive bidding. The order says that Dr RK Pachauri of TERI was  asked to make a presentation on climate change in Maharashtra, based on which it was decided to give the task of preparing the SAPCC to TERI and Met Office, UK at the cost of Rs 98 lakhs. This is clearly inappropriate process.

It’s been 5 years since the National Action Plan on Climate Change (NAPCC) was made public in June 2008. NAPCC itself was formulated in non-transparent, non-participatory way by Prime Minister’s Council on Climate Change.  Several States have submitted and are working towards their Action Plans.

In Feb 2011, Chief Minister Prithviraj Chavan announced Advisory committee on Climate change similar to PM’s council on CC. However, the Government Resolution for the State Council on CC came only on 8th July 2011. Some its  current 19  members include Chief Minister (chair), Deputy Chief Minister,  Ministers of Environment, Agriculture, Water resources, Rural Development, Chief Secretary, Secy-Environment, etc. Some Expert members include Sunita Narain, Jamshed Godrej, Anu Agha, Dr. R.K. Pachauri, Dr. R. A. Mashelkar, Dr. Anil Kakodkar and Ajay Mathur from Bureau of Energy Efficiency.

The Terms of Reference of the Committee indicate the following duties:

(a) To evaluate the study being done by TERI in the State and recommend strategies. (Emphasis added)

(b) Provide an oversight to the State Government in the drafting an action plan to combat climate change;

(c) To ensure a co-ordinated response to all issues relating to climate change.

This council was to meet “at least twice a year to review situation on CC and adaptation strategy” as per the GR. It has met just once in last 33 months.

After giving contract to TERI in 2009, announcing State Council on CC in 2011, the first and only meeting of the State Council on Climate Change happened only in Feb 2013! Minutes of the meeting claim that final report from TERI is expected in March 2013. However, there was no discussion on this important report or even a discussion to hasten the formulation and implementation of this report. Strangely, TERI and MET Office UK had already published a note on the Action Plan in 2012[1] itself, when the State Action Plan is still not final even today!

There is also issue of conflict of interest here: when TERI is given the task of preparing Maharashtra SAPCC, how can Dr. Pachauri, who heads TERI be on the State Council to oversee the preparation of SAPCC? Secondly, Dr. Pachauri is a member of PM’s Council on Climate Change, which recommends state action plans and then his own organisation, TERI is awarded the work to prepare the action plan for Maharashtra. Is not there a conflict of interest here?

Moreover, Sunita Narain and Dr. Pachauri are also members of PM’s Council on Climate Change and having seen the performance of PMCCC in bringing out business as usual NAPCC in non-transparent, non-participatory way. The state government should have appointed independent members who have knowledge of the state.

The minutes of the first meeting of the state council seem to suggest that the meeting had rather unfocused discussions. The meeting had interesting conclusion: “All the members Council were of the opinion that the implementation of the existing schemes/ plans need to be focused on climate change adaptation strategies and did not encourage going in for further studies.” In spite of such a clear conclusion, we see neither the state action plan in place, nor adaptation of the existing schemes/ plans with the climate change implications in Maharashtra. In fact, Sunita Narian was also member of the Kasturirangan committee on Western Ghats, but we see no effective reflection of climate change concerns in the conclusions of the Kasturirangan committee.

The Chief Minister said in conclusion, “Providing income support to farmers was of utmost importance to the Government. A special “Climate Change Cell” would be established in the state to focus on climate change issues”. There is no evidence of functioning of any such cell, more than a year after that meeting.

There have been some meetings of High Powered Committee on climate changed, headed by Chief Secretary, the latest meeting happed on Oct 7, 2013.

The minutes of the Oct 2013 meeting notes, “The officers of the disaster management department were attending the meeting for the first time, which according to the Chief Secretary was not very useful given that they do not have any background in the subject area as well as the previous discussions.” Considering how important is the role of disaster management in climate change context, this callousness of disaster management department seems disturbing. The minutes also noted the need for additional Rs 40 lakhs to get run off (hydrology) data.

The minutes of the meeting ends with this conclusion: “Chief Secretary instructed TERI, to finish the consultations with respective departments for validations of data and finalise the recommendations within a month time, post which the presentation could be made before the cabinet.” However, that was in Oct 2013, but even in April 2014, there is no sign of the State Action Plan on Climate Change, an exercise that has dragged on for over 4 and half years now.

While all this has been going on without any conclusion, action plan or implementation of any necessary actions, the millions of the vulnerable people of the state are suffering and more than 20 farmers have committed suicide in the face of inconsolable loss.

The State Action Plan on Climate change is not a magic wand that will cure all ills. It is, however, one of the indicators of the seriousness and intent of our administration in tackling the real and grave challenges. Right now, there seems to be no seriousness and no intent.

 Parineeta Dandekar (parineeta.dandekar@gmail.com),
Himanshu Thakkar (ht.sandrp@gmail.com)

END NOTES:

[1] http://www.metoffice.gov.uk/media/pdf/c/a/GOM_brochure_for_web.pdf

2. https://sandrp.wordpress.com/2014/03/11/maharashtra-farmers-face-impacts-of-hailstorms-and-states-inaction-plan-on-climate-change/

3. https://sandrp.wordpress.com/2014/04/03/dams-are-not-climate-friendly-readings-from-ipcc-wg-ii-report/

4. VERY TRAGIC story of how hailstorms have hit poor farmers in Marathawada in Maharashtra: http://www.livemint.com/Specials/jkcra6zQqMShlFJjzmvXeN/Death-and-despair-in-hailstormhit-Marathwada.html

Dams

Election manifestos of BJP, Congress and AAP: Comparative reading on Environment and natural resource management

Now that the Bharatiya Janta Party (BJP) has made its manifesto for the 2014 Parliamentary elections in India public on April 7, 2014, we are in a position to make a comparative reading of manifestoes of three most prominent parties in fray at national level, namely the BJP, Congress and Aam Aadmi Party (AAP). While manifestos are largely ritualistic exercises, they are also the most important documents that declare the intentions of the political outfits, besides the other statements of the party leaders and track records of the parties and their leaders. These documents need to be read both in terms of the promises that they make as also the roadmaps that the parties provide to achieve the promises.

Overall impression In that respect, the overall impression that BJP manifesto (let us begin with a comment on BJP manifesto since all the opinion polls are giving the party an edge over others, though it is well known that opinion polls are largely doctored exercises that have proved wrong so many times) gives is one of an arrogance: both in terms of the content and the timing of the document. The BJP manifesto reads more like a laundry list of feel good factors, without any roadmap as to how the party hopes to achieve the listed objectives. The fact that the party came out with manifesto even as the voting in first phase of the elections was already underway, signals that it is not bothered to tell people why they should vote for them. There is little in the track record of the party in the states it is in power for over a decade, like Gujarat, Madhya Pradesh and Chhattisgarh, to show that it is serious on these issues in these states.

Congress manifesto, also of 52 pages like that of the BJP manifesto, provides much more details about the specific issues they list, but it is not written in particularly imaginative style, nor is it making any attempt at taking care of the negativity that has been generated around its performance over the last decade. In that sense, Congress’s manifesto makes for somewhat bureaucratic and boring reading. It also lacks in providing the big picture and a big vision.

The AAP manifesto at 28 pages is more interesting as it is not written as a marketing product pamphlet. It starts with the section on Jan Lokapal, their main plank and tries to answer why people should vote for AAP. The major highlight of the whole manifesto is that the party wants to give Gram Sabhas and mohalla sabhas a decisive say in all matters at their respective levels and in overall governance. This is a major departure from other two manifestos, besides their reliance on tackling corruption & Crony Capitalism with more seriousness and convincingly than other two parties. However, while it is more elaborate than the BJP and Cong manifestos in describing how the party seeks to change the governance in India, it seems less comprehensive. Another lacuna of the AAP manifesto’s PDF file is that it is not searchable, unlike the other two manifestos.

Having taken an overall view, let us look at some specific issues that we are concerned about.

Natural Resource Management The BJP manifesto seems to have poor understanding of the scope of ‘Natural Resources’. The manifesto lists only coal, minerals and spectrum among natural resources. The most important natural resources of land, forests, rivers, water sources and biodiversity are not even listed. It seems the party is only interested in directly marketable (as in equity market) commodities that their industry friends are interested in. Interestingly, the section starts with Gandhi’s famous quote on need vs greed, but there is no reflection of this principle in what is said here.

The Congress manifesto talks about “establishment   of a clearly defined policy for fair, transparent equitable and time bound development of natural resources. The Indian National Congress will immediately put in place a Special Purpose Vehicle for this.”  The fact that this comes in industries section does not sound very confidence inspiring.

The AAP has a section on natural resources that does include water and forests among natural resources along with major minerals and provides Gram Sabha pivotal role, without whose consent, decisions about exploitation of such major natural resources cannot be taken. The ownership of the minor natural resources remains with the gram sabhas in AAP scheme of things.

Environmental governance The BJP section on this issue has interesting heading: “Flora, Fauna and Environment – Safeguarding Our Tomorrow”. However, the section or the rest of the document does not tell us anything how they are going to improve environment governance in India or do they even see this need. On the contrary, by stating in Industry section that it intends to “Frame the environment laws in a manner that provides no scope for confusion and will lead to speedy clearance of proposals without delay” and talking about single window and speedy clearance elsewhere, it is clear what is their understanding is and where they intend to go. This can only be disastrous for India’s environment and environmental governance.

The Congress Manifesto claimed that it intends to set up National Environment Appraisal and Monitoring Authority. However, as Supreme Court judges promptly remarked, this is actually the order of the Supreme Court and Congress had no business of putting it on their manifesto. Moreover, Congress lacks credibility on this, since, when Jairam Ramesh, as environment minister proposed this, he was actually removed and his successor did nothing to implement this. Moreover, the environment ministry under UPA II actually filed an affidavit in the Supreme Court saying that it is not possible to set up such an authority with any teeth. The appointment of Union Oil Minister Veerappa Moily as Environment Minister, forgetting about conflict of interest and the actions that Moily as been taking subsequently including pushing the disastrous Yettinahole Diversion Project to benefit his parliamentary constituency in Karnataka takes away any credibility the party may have had. It is true that National Green Tribunal is the only major contribution of UPA on this issue, but that too is largely due to Mr Ramesh as his successor ministers tried their best to scuttle the functioning of NGT.

The AAP manifesto talks about reforming “Ministry of Environment and Forests and its agencies so that they can empower and facilitate Gram Sabhas to be effective custodians and managers of their local natural resources.” This is certainly welcome. However, there are insufficient details as to how this will be achieved. Their clubbing of Ecology and Economy in one section sounds promising at one level, again how this will be implemented without allowing ecology to be subservient to economic interests is not described.

Rivers It is well known that Inter Linking of Rivers (ILR) is high on agenda of BJP and Mr Modi. However, for some unclear reasons, they have played down ILR, saying, “Inter-linking of rivers based on feasibility.” Possibly they do not want to raise the hackles prematurely. However, the Narmada Kshipra link that was recently inaugurated and the track record of the BJP in Madhya Pradesh and elsewhere seems to suggest that BJP state governments are working at cross purposes with the national ILR plan.

The BJP manifesto says, “BJP commits to ensure the cleanliness, purity and uninterrupted flow of the Ganga on priority”, but this is not helpful, since no roadmap is given how this will be achieved. Moreover, this intentionally ignores the three biggest threats that the Ganga and other rivers face: The dams & hydropower projects, the urban & industrial pollution & encroachment. The BJP manifesto is silent on all these three threats to the river. Even on the issue of River Pollution, the only thing the party manifesto condescends to inform the readers is that “a massive ‘Clean Rivers Programme’ will be launched across the country driven by people’s participation.” No details again. Even on the issue of seemingly unsolvable urban water pollution, the only solution party can offer is more sewage treatment plants, choosing to ignore that the existing STPs are non functional most of the places. Interestingly, BJP manifesto has a section on North East India (unlike the other two manifestos) and mentions the flood problem of Assam and promises tackling the river, but without any details as to how.

It is worth noting in this context that when BJP’s PM candidate Mr Modi visited North East India in general and Arunachal Pradesh in particular he did not mention ILR or large hydropower projects in that region, knowing that local sentiments are totally against them. However, Mr Modi, while proposing his national energy plan in Madhya Pradesh in March 2014, said that North East India is heaven for hydropower projects! The manifesto again is expectedly silent on this issue!

The Congress manifesto says that “The National Ganga River Basin Authority has begun the ambitious task of cleaning the Ganga River. We  will use similar models of creating empowered, well-funded agencies to clean other major rivers in the country”. Now this sounds mindless and incredible! NGRBA, five years after it was notified, has been the most ineffective, non transparent institution that has achieved no change in the state of the river. How can such an institution be used as a model for other rivers? The authors of the Congress manifesto seem completely ill informed on this score.

The AAP manifesto seems to have nothing on Rivers: a major omission of the manifesto.

Water The BJP manifesto promises piped water supply to all households! Irrespective of if all households need it or not or is it feasible or appropriate or not. The BJP manifesto claims that there will be 50% gap between demand and supply of water in India by 2050. This is totally off the mark, according to Govt of India’s National Commission for Integrated Water Resources Development, country’s water requirement will match the available resources in 2050, even considering high growth trajectory, we are going far below that level currently. The BJP manifesto writers seem to have no clue about the realities, or they are just trying to push greater market for water companies. There is one promise in this regard that is welcome: “We will promote decentralized, demand-driven, community-managed water resource management, water supply and environmental sanitation.” However, how they will promote this is not given. Moreover, this promise remains unconvincing considering they also talk about river linking.

The Congress manifesto talks about adding 1 crore ha in gross irrigated area in 12th Plan, two years of which are already over! It clearly looks impossible, but more importantly, it does not say how they will achieve it. Both Congress and BJP manifestoes talk about water conserving irrigation techniques, which is actually seems to be scam ridden and affected by crony capitalism. Congress manifesto also talks about increasing irrigation efficiency and water use efficiency in general, but without any roadmap. More worryingly, the UPA government has pushed the proposal to allow Jain Irrigation (the biggest private supplied of drop and sprinkler systems) to set up the National Bureau of Water Efficiency! Crony capitalism?

The AAP manifesto talks about giving priority to watershed development to reduce pressure on big irrigation projects, but fails to take an informed and prudent stand on performance of big irrigation projects. This is certainly a major let down of AAP manifesto.

Urban Water Issues There is nothing noteworthy in BJP manifesto in this regard, even as it plans to prioritise Urban Development. It has no clue about how to tackle Urban Wastewater as it only talks about more STPs when existing STPs are not working, including in Modi’s Gujarat.

The Congress manifesto talks about continuing the problematic Jawaharlal Nehru Urban Renewal Mission under which over Rs 70000/- crores have been spent, mostly on Urban water issues, without any attempt at democratic governance, local water options, demand side  management or recycle and reuse of treated sewage. This is creating havoc on surrounding areas with displacement of tribals, destruction of forests and pushing unjustifiable dams. But it seems Congress is least bothered about it. The problem is so acute that some 18000 people in Thane to be displaced by Kalu dam meant for Mumbai have decided to boycott the polls, since the dam is being taken up without any clearances and when all the gram sabhas have passed resolutions against it. The writing is clearly on the walls for the Congress.

The only positive aspect in this regard in AAP manifesto is the proposed empowerment of Mohalla Sabhas. Let us hope they are able to show how this will work.

Climate Change It is interesting to see that Climate Change is an issue recognised by BJP and Congress manifestos, but what they say there is disappointing in both cases. BJP manifesto talks about launching a National Mission on Himalayan Ecosystem, but there is already one existing, which is supposed to be under implementation for some years, but no one seems to know what it is doing! BJP Manifesto also talks about program devised to arrest melting of Himalayan glaciers, sounds strange, since no such program is known.

The Congress manifesto promises of continued implementation of National Action Plan on Climate Change when the plan and its mission stand discredited, along with the Prime Minister’s Council on Climate Change. These are the things that make the Congress manifesto sound so bureaucratic.

AAP manifesto seems silent on climate change.

Renewable Energy It is welcome to note that BJP manifesto talks about promoting small hydro with local support and without displacement. However, it is not welcome that there is no mention of big hydro and big dams. Their promise to push infrastructure development in Arunachal Pradesh without any mention of participatory decision making with the local communities is likely to raise suspicion that this is for pushing big hydro there. The manifesto is also silent about promoting household level solar power projects.

The Congress manifesto is also silent on promoting household level solar power projects. It talks about giving new  thrust to  small hydro under new and renewable energy sources, but these projects need social and environmental impact assessment, the manifesto is silent on this.

The AAP manifesto is the only one that does talk about pushing decentralized renewable energy plants, which is welcome.

Tribal Development The scary part in BJP manifesto in this regard is that tribal development in India will be pushed on the lines of what has been achieved in Gujarat, Madhya Pradesh and Chhattisgarh! If this is the tribal development model for tribals in other areas, tribals all over India need to be very wary of this party.

The Congress manifesto says: “We will ensure the stringent implementation of PESA, 1996 and the Forest Rights Act, 2006 to ensure that Scheduled Tribes are empowered and brought into the mainstream.” Sounds good, but the trouble is what has Congress governments both at centre and states done? Nothing about PESA and very little to implement FRA in letter and spirit.

In that respect AAP manifesto does make such commitment and this is most welcome. This is possibly the only useful thing for tribals among all three manifestos, in addition to the fact that AAP provides separate section for Tribals, for Scheduled castes and also for Valmikis, unlike the BJP and Congress manifestos basically clubbing all under one head.

In conclusion It is apt that the last page of the BJP manifesto says “Time for Modi” and not for BJP! The Congress manifesto on last page shows Rahul Gandhi sitting with urban youth. This appeal will have limited catchment. The last page of AAP manifesto asks voters in Hindi to vote for the honest party.

Let us hope the voters everywhere will do that.

Himanshu Thakkar, ht.sandrp@gmail.com

BJPcongressaap

This blog also hosted at: http://www.write2kill.in/himanshu-thakkar/election-manifestos-of-bjp-congress-and-aap-comparative-reading-on-environment.html

and at: http://indiatogether.org/comparing-manifestos-of-national-parties-environment.

END NOTES:

1. BJP Manifesto: http://www.bjp.org/images/pdf_2014/full_manifesto_english_07.04.2014.pdf

2. Congress Manifesto: http://inc.in/media/pdf/English_Manifesto_for_Web.pdf

3. AAP manifesto: https://app.box.com/s/q9k6f7e21265olkpxrzq

4. Some articles on Congress, AAP manifestos: http://www.thethirdpole.net/new-indian-party-integrates-economy-and-ecology-in-manifesto/,

http://www.thethirdpole.net/indias-congress-party-releases-poll-manifesto-green-promises-remain-unfulfilled/,

http://www.thethirdpole.net/environmentalists-attack-catch-all-bjp-manifesto/,

http://www.thethirdpole.net/little-space-for-environment-in-indian-elections/

5. A related article: https://sandrp.wordpress.com/2014/04/04/why-is-media-missing-the-real-gujarat-story-gujarat-satya-samachar/

6. http://www.indiawaterportal.org/articles/elections-manifesto-2014-water-policy

7. http://www.theguardian.com/commentisfree/2014/mar/22/water-decide-indian-elections-aam-admi

8. Great to see hydropower projects become election issue in Sikkim: http://www.firstpost.com/politics/in-sikkim-environmental-issue-get-top-priority-1470713.html

9. http://prernabindra.com/2014/04/09/little-space-for-conservation-in-the-election-manifestos/

10. EPW editorial: “The absence of any engagement with climate change in the planet’s biggest elections is shocking” http://www.epw.in/system/files/pdf/2014_49/15/King_Canutes_Land.pdf

11. Quotes SANDRP http://www.thehindubusinessline.com/news/politics/green-agenda-gets-the-grand-shove/article5897143.ece?homepage=true

12. http://indiatogether.org/comparison-of-congress-bjp-aap-manifestos-government

Gujarat · Narmada

Why is media missing the real Gujarat story: Gujarat Satya Samachar!  

It seems large parts of mainstream national media have gone underground these days. If you view most of the English and some Hindi news channels or most of the English and Hindi newspapers, you suddenly find proliferation of reports favouring Mr Narendra Modi and BJP. The repeated highlighting of the doctored pre poll analysis, without attempt at in-depth analysis or investigation into the credentials of the agencies doing such predictions is only one troublesome part. But even in reporting of the news, there is a clearly discernable pro-BJP tendency and an attempt to black out or under report or mis-report the news surrounding BJP’s rivals, particularly the news around Aam Admi Party (AAP). This was most evident in reporting of AAP’s trip to Gujarat in first week of March 2014.

There will be no doubt to any objective viewer that AAP’s trip punctured the well-crafted balloon of Gujarat’s development image. To many Gujaratis like me, this was not such a big breaking news. But strangely, the media that is supposed to report realities in an objective manner, should have been happy reporting this significant development. Arvind Kejriwal’s hour long speech in Ahmedabad at a hugely attended meeting should have been reported extensively in the media. Strangely, large parts of the mainstream media (both print and electronic) almost blacked this out.

This no doubt reflected poorly on the media that has been accepting the claims of Modi and BJP as gospel truths, since an independent media should have exposed the reality of these claims on its own through trips like the one AAP members did. The speech in Ahmedabad on March 8, 2014 was a good opportunity for the media to correct their own failure. In stead of using that opportunity, by not reporting or under reporting or mis-reporting, the media has further discredited itself.

It reminds one of an episode in Gujarat not long ago. “One morning some years ago, Gujarat’s residents found a newspaper on their doorsteps. They hadn’t subscribed to it, and it carried a vaguely familiar masthead. It was called Gujarat Satya Samachar, to make it resemble the state’s largest circulated newspaper, Gujarat Samachar. It was produced by Gujarat’s information department (a portfolio held by chief minister Narendra Modi) and contained reports of the state government’s achievements”, wrote former Divya Bhaskar (Gujarati edition of paper from Bhaskar group) editor Aakar Patel in his column in Mint on March 1, 2014.

The reason Gujarat government resorted to Gujarat Satya Samachar was “belief was that the local media was either suppressing stories about government successes or was critical of Modi to the point of antagonism”. The Gujarat Satya Samachar did not run much beyond a couple of issues, since Gujarati media quickly fell in line, the way government wanted. In fact, this episode should not give a misleading picture that Gujarati media was depicting the reality of Gujarat’s development before the government resorted to Gujarat Satya Samachar. Far from it.

While traveling through various parts of Gujarat, I have seen frustration of the aam Gujarati about the way the state is ruled over the last decade and more. Repeatedly, common people on the street have told me, during my numerous trip in the state, about corruption, break down of the regular basic facilities like schooling (everyone seems to have to go for tuitions and tuition classes, “then what are the schools for?” as one frustrated autorikshaw wala told me) or electricity or water and pro-big-industries bias of the state establishment. Intellectuals and independent observers have talked about the huge gap between claims of the Gujarat government and reality for long.

Ahmedabad is supposed to be shining with Sabaramati river front development, but if you go a dozen kilometers upstream or downstream you realize that this is just for the benefit of the real estate developers of the city. The state of the river elsewhere is as bad as Yamuna in Delhi. Even the water you see in Sabarmati flows in it through a fraud.  This water is from Narmada project and not a drop from it was planned or allocated for Ahmedabad city or Sabarmati River.  The project was proposed and justified for drought prone areas of Kutch, Saurashtra and North Gujarat. They are not getting this water, in stead farmers of Saurashtra are fighting FIRs and cases for using Narmada water! Farmers everywhere are feeling discriminated when the state government favours big industries at their expense and without transparency or due justice or their participation. The tribal belt is not only neglected, it is facing prospects of more and more displacement and deforestation in the name of dams, river linking projects and industrial zones and corridors.

Narmada Waters flowing unused in the Rann of Kutch, harming the eocsystem and saltpan workers livelihoods Photo: Counterview.net
Narmada Waters flowing unused in the Rann of Kutch, harming the ecosystem and saltpan workers livelihoods Photo: Counterview.net

While traveling through the tribal areas near Sardar Sarovar dam, Savitaben Tadvi of Indravarna village told us about the repression they are facing while peacefully opposing the Garudeshwar dam on Narmada river, which has neither any valid approval nor any impact assessment or consent from the affected villages in the upstream or downstream. Lakhan Musafir of Umarva village took us to the washed out portion below the Sardar Sarovar dam, including the viewers park, about which there is so little information in public domain. Rohit Prajapati of Paryavaran Suraksha Samiti, showing the proposed site of the statue of Unity, publicized as world’s highest statue, just downstream of the Sardar Sarovar Dam, said how the foundation stone was laid on Oct 31, 2013 by arresting the peacefully opposing tribals, but that project neither has any impact assessment, nor any of the statutorily required approvals. As Nandini Oza, after traveling for over a thousand kilometers in Gujarat recently said, “You can actually smell development at Vapi, Ankaleshwar!”

Pollution of Damanganga at Vapi Photo: Tehelka

Protest against the Bhadbhut Barrage also on Narmada Photo: Counterview.net

BJP’s prime ministerial candidate Narendra Modi, who as a chief minister, resorted to Gujarat Satya Samachar to show slightly critical Gujarati media its place and succeeded in arm-twisting them, has been resorting to less than Satya in his electioneering. Just to illustrate, during his trip to North East, he did not mention his support for either large hydro projects or inter linking of rivers, which are facing huge opposition in Assam, Arunachal Pradesh and other states. But during his speech in following week on February 26, 2014 in Madhya Pradesh, he talked about the North East region being “heaven for hydro power generation”. In that same state of Madhya Pradesh, his party chief Minister flashed full page advertisements (at public expense) for three straight days about Narmada Kshipra link as harbinger of the ILR dream of former prime Minister Atal Behari Vajpayee. In reality it is just a pipeline water supply project with questionable viability and justifiability, without even impact assessment or participation of the people of the Narmada or Malwa region. There is already opposition to the project from among the farmers of the Narmada Valley.

There are others who have taken an objective view of Gujarat story. Revealing research by two professors of British Columbia, Canada about GUJARAT GROWTH VS DEVELOPMENT recently[1] showed: “This is a perplexing picture of development. Gujarat has done so much better in terms of growth and so much worse in terms of development than other states. Why has the fast growth not translated into meaningful development? Finally, it is the grassroot-level institutions that run schools, health clinics, bring water and sanitation to households, and bring the fruits of growth to the multitudes. Could it be that the centralised model of governance that works well for big investment projects does not work as well for grassroot institutions? Or, is this high growth with low development model indicative of the priorities of the government of Gujarat? Or is it something else altogether? It would be good to know the answer.”

Protest against the illegal Garudeshwar Weir Photo: Counterview.net

The trouble is, large part of mainstream media has mostly blacked out all this critical news.  This situation is no doubt very bad for Indian democracy. As a senior journalist from financial paper told me, whenever there is extraordinarily positive report about any company or party, first question that arises is, how much has the reporter been paid to write such a story! Media should be wary of at least such a perception.

Himanshu Thakkar, SANDRP


END NOTES:


[1] http://indianexpress.com/article/opinion/columns/gujarats-growth-for-growths-sake/99/


[2] An edited version of this article was published in April 2014 at: http://www.civilsocietyonline.com/pages/Details.aspx?509

[3] Also published at: http://www.hotnhitnews.com/Real-Gujarat-An-Underreported-Story-By-Himanshu-Thakkar-HotnHitNews-13702042014.htm

Some other relevant links:

[4] http://www.thehindu.com/news/national/other-states/in-gujarat-tribal-people-get-a-raw-deal/article5873973.ece

[5] VERY INTERESTING Column by AAKAR PATEL, calling Modi a TYRANT, who hates democracy and revers only the dead: http://www.livemint.com/Leisure/NP7LlgqacegDU1PoTm3HKI/The-oneman-armys-forward-march.html

[6] How Modi’s government has treated RTI acitivists: http://www.firstpost.com/politics/narendra-modis-gujarat-model-has-no-space-for-rti-activists-1214009.html

[7] Why the growth fundamentalist THE ECONOMIST refused to back Modi: “But for now he should be judged on his record—which is that of a man who is still associated with sectarian hatred. There is nothing modern, honest or fair about that. India deserves better.” See: http://www.economist.com/news/leaders/21600106-he-will-probably-become-indias-next-prime-minister-does-not-mean-he-should-be-can-anyone?fb_action_ids=10202394265351839&fb_action_types=og.likes&fb_ref=scn%2Ffb_ec%2Fcan_anyone_stop_narendra_modi_

[8] http://indiatogether.org/could-modi-be-a-development-disaster-government by Ashish Kothri

[9] http://www.ndtv.com/elections/article/election-news/blog-gujarat-s-development-pre-dates-modi-considerably-505647?pfrom=home-topstories by Reetika Khera, Development Economist at IIT Delhi

[10] http://www.hindustantimes.com/india-news/gujarat-one-of-the-most-water-starved-states-in-india-un-report/article1-1205787.aspx

[11] BJP’s PM candidate Modi showing his true colours: Opposes even RTI: http://indianexpress.com/article/india/politics/in-karnataka-modi-targets-upas-aadhaar-rti/

[12] http://www.hindustantimes.com/elections2014/state-of-the-states/gujarat-s-pride-wilting-it-s-also-land-of-failing-crops-and-dying-men/article1-1206339.aspx

[13] “Hemantkumar Shah, an economics professor at Gujarat University, has challenged Modi’s claim of dramatic economic growth. He said data reveals the state’s economic and human development parameters worsened under Modi.” http://timesofindia.indiatimes.com/City/Mumbai/Growth-declined-poverty-increased-in-Gujarat-under-Modi-Guj-varsity-prof-claims-in-book/articleshow/33463710.cms

[14] “CAG reports and data on economic and social development from various sources make it evident that the much-touted “Gujarat model” of development is non-inclusive, socially divisive and highly ineffective in key areas.”

By ATUL SOOD and KALAIYARASAN A.” Gujarat Model: Fiction and Facts: Frontline Cover Story, April 4, 2014: http://www.frontline.in/cover-story/fiction-and-facts/article5795324.ece?ref=sliderNews (needs registration to get full story)

[15] http://themadeconomy.blogspot.in/2013/08/Facts-behind-Modi-and-Gujarat-Model.html

[16] “To sum up, the “Gujarat model” story, recently embellished for the elections, is misleading in at least three ways. First, it exaggerates Gujarat’s development achievements. Second, it fails to recognise that many of these achievements have little to do with Narendra Modi. Third, it casually attributes these achievements to private enterprise and economic growth. All this is without going into murkier aspects of Gujarat’s experience, such as environmental destruction or state repression.” From Hindu article by Jean Dreze, See: http://www.thehindu.com/opinion/op-ed/the-gujarat-muddle/article5896998.ece

[17] Another warning from eminent people against voting for Narendra Modi for Prime Minister: http://www.theguardian.com/commentisfree/2014/apr/10/if-modi-elected-india-future-gujarat

[18] Is Modi’s fabled Gujarat model lawful and accountable? http://www.firstpost.com/politics/is-modis-fabled-gujarat-model-lawful-and-accountable-1491885.html

Climate Change · Dams · Hydropower

Dams are not Climate Friendly: Readings from IPCC WG II Report

Inter-governmental Panel on Climate Change’s (IPCC) Fifth Assessment is falling into place. On the 31st March 2014, the report titled ‘Climate Change 2014: Impacts, Adaptation, and Vulnerability’, from Working Group II[1] was issued in Yokohoma, Japan. Working Group II assesses “the vulnerability of socio-economic and natural systems to climate change, negative and positive consequences of climate change, and options for adapting to it. It also takes into consideration the inter-relationship between vulnerability, adaptation and sustainable development.”[2]

This can be called as one of the more incisive Working Group Reports from IPCC. It states unequivocally that the effects of climate change are already occurring on all continents and across the oceans and world is ill-prepared for risks from a changing climate. According to Co-Chair of Working Group II, Chris Field, “The report concludes that people, societies, and ecosystems are vulnerable around the world, but with different vulnerability in different places. Climate change often interacts with other stresses to increase risk”.[3]

The report consists of two volumes. First volume contains a Summary for Policymakers, Technical Summary, and 20 chapters assessing risks by sector and opportunities for response. The sectors include freshwater resources, terrestrial and ocean ecosystems, coasts, food, urban and rural areas, energy and industry, human health and security, and livelihoods and poverty. A second volume of 10 chapters assesses risks and opportunities for response by region. These regions include Africa, Europe, Asia, Australasia, North America, Central and South America, Polar Regions, Small Islands, and the Ocean.

The summary for policymakers paints a sombre picture: “Climate change over the 21st century is projected to reduce renewable surface water and groundwater resources significantly in most dry subtropical regions, intensifying competition for water among sectors. In presently dry regions, drought frequency will likely increase by the end of the 21st century under RCP8.5. In contrast, water resources are projected to increase at high latitudes. Climate change is projected to reduce raw water quality and pose risks to drinking water quality even with conventional treatment, due to interacting factors: increased temperature; increased sediment, nutrient, and pollutant loadings from heavy rainfall; increased concentration of pollutants during droughts; and disruption of treatment facilities during floods. Adaptive water management techniques, including scenario planning, learning-based approaches, and flexible and low-regret solutions, can help create resilience to uncertain hydrological changes and impacts due to climate change.”

“Risks are unevenly distributed and are generally greater for disadvantaged people and communities in countries at all levels of development.”

Links with water

Being an integral and cross cutting issue, water features prominently in all of Chapters of the Working Group Report. Sections on Freshwater Resources, Costal systems and low lying areas, Food Security, Inland systems, etc. include important findings. It is significant to note that dams, hydropower projects, infrastructure measures like channelization, embankments, etc., are also mentioned in nearly all the chapters of the report. Couple of references indicate dams as a possible adaptation measure, but overwhelming references point to the contrary.

The collective picture that is arising through these reference is very important. A collation and analysis of all specific references to water infrastructure projects, read in tandem with the report indicates that: 

1. Dams and infrastructure projects contribute significantly to “non-climate impacts” which, after interacting with changing climate, exacerbate the overall impact on human societies and ecosystems

o   Sediment Trapping by reservoirs, exacerbates impact of  sea level rise

o   Hydropower affects local options

o   Climate  change and dams together affect a greater eco-region

o   Increased flow fluctuations by dams exacerbate through climate change

2. In case of Flood Protection, dams and embankments may do more harm than good. Ecological measures would fare better.

3. Dams and Hydropower projects affect biodiversity, which is critical in facing climate change challenges.

4. In the tropics, global warming potential of hydropower may exceed that of Thermal Power

5. Dams increase vulnerability of weaker sections to climate change

6. Existing Dams have to be managed sustainably, with ecological considerations

7. Hydropower itself is vulnerable to Climate Change

~~~

The references used in WG II report are peer reviewed research from several authors.The specific references given below will play an important role in debunking the simplistic myth that dams and hydropower projects are climate friendly and can be considered as de facto adaptation measures to cope with Climate Change.

Some Relevant Extracts from Working Group II Report:

  1. Dams and infrastructure projects contribute significantly to “non-climate impacts” which, after interacting with climate impacts, exacerbate the overall impact of climate change on human societies and ecosystems 
  • Sediment Trapping by reservoirs, exacerbates impact of  sea level rise

“Most large deltas in Asia are sinking (as a result of groundwater withdrawal, floodplain engineering, and trapping of sediments by dams) much faster than global sea-level is rising.” (Chapter 24: Asia)

“Human activities in drainage basins and coastal plains have impacted the coastal zone by changing the delivery of sediment to the coast. Sediment trapping behind dams, water diversion for irrigation, and sand and gravel mining in river channels all contribute to decrease sediment delivery, whereas soil erosion due to land-use changes help increase it. It is estimated that the global discharge of riverine sediment was 16-–19 Gt/ yr in the 1950s before widespread dam construction and it has decreased to 12–13 Gt/ yr. Out of 145 major rivers with mostly more than 25-year record, only 7 showed evidence of an increase in sediment flux while 68 showed significant downward trends. The number of dams has increased continuously and their distribution has expanded globally. As of early 2011, the world has an estimated 16.7 million reservoirs larger than 0.01 ha. Globally, 34 rivers with drainage basins of 19 million km2 in total show a 75% reduction in sediment discharge over the past 50 years. Reservoir trapping of sediments is estimated globally as 3.6 Gt/ yr to more than 5 Gt/ yr (Syvitski et al., 2005; Walling, 2012; Milliman and Farnsworth, 2011). Human pressure is the main driver of the observed declining trend in sediment delivery to the coastline.(Chapter 5 Coastal systems and Low Lying areas)

“Attributing shoreline changes to climate change is still difficult due to the multiple natural and anthropogenic drivers contributing to coastal erosion.” (Chapter 5 Coastal systems and low lying areas)

“The combined impact of sediment reduction, relative sea level rise, land-use changes in delta and river management on channels and banks has led to the widespread degradation of deltas. The changes of sediment delivery from rivers due to dams, irrigation and embankments/dykes creates an imbalance in sediment budget in the coastal zones. Degradation of beaches, mangroves, tidal flats, and subaqueous delta fronts along deltaic coasts has been reported in many deltas (e.g. Nile and Ebro, Sanchez-Arcilla et al., 1998; Po, Simeoni and Corbau, 2009; Krishna-Godavari, Nageswara Rao et al., 2010; Changjiang, Yang et al., 2011; Huanghe, Chu et al., 1996; very high confidence). Deltaic coasts naturally evolve by seaward migration of the shoreline, forming a delta plain. However, decreasing sediment discharge during the last 50 years has decreased the growth of deltaic land, even reversing it in some locations (e.g. Nile, Godavari, Huanghe). Artificial reinforcement of natural levees also has reduced the inter-distributory basin sedimentation in most deltas, resulting in wetland loss.” (Emphasis added.)

“The major impacts of sea level rise are changes in coastal wetlands, increased coastal flooding, increased coastal erosion, and saltwater intrusion into estuaries and deltas, which are exacerbated by increased human-induced drivers. Ground subsidence amplifies these hazards in farms and cities on deltaic plains through relative sea level rise. Relative sea level rise due to subsidence has induced wetland loss and shoreline retreat (e.g. the Mississippi delta, Morton et al., 2005; Chao Phraya delta, Saito et al., 2007; high confidence).” (Chapter 5 Coastal systems and low lying areas)

“There have been local variations in precipitation and runoff since 1950, but changes in sediment load are primarily attributed to over 50,000 dams and vegetation changes.”  (Chapter 18: Detection and attribution of observed impacts)

  • Hydropower affects local options

“Hydropower dams along the Mekong River and its tributaries will also have severe impacts on fish productivity and biodiversity, by blocking critical fish migration routes, altering the habitat of non-migratory fish species, and reducing nutrient flows downstream. Climate impacts, though less severe than the impact of dams, will exacerbate these changes.”(Chapter 24: Asia)

  • Climate  change and dams together affect a greater eco-region

“For one climate scenario, 15% of the global land area may be negatively affected, by the 2050s, by a decrease of fish species in the upstream basin of more than 10%, as compared to only 10% of the land area that has already suffered from such decreases due to water withdrawals and dams (Döll and Zhang, 2010). Climate change may exacerbate the negative impacts of dams for freshwater ecosystems.” (Chapter 3: Freshwater resources)

  1. Flood Protection: Dams and embankments may do more harm than good. Ecological measures fare better.
  • “On rivers and coasts, the use of hard defences (e.g. sea-walls, channelization, bunds, dams) to protect agriculture and human settlements from flooding may have negative consequences for both natural ecosystems and carbon sequestration by preventing natural adjustments to changing conditions. Conversely, setting aside landward buffer zones along coasts and rivers would be positive for both. The very high carbon sequestration potential of the organic-rich soils in mangroves and peat swamp forests provides opportunities for combining adaptation with mitigation through restoration of degraded areas.” (Chapter 3 Freshwater Resources)
  • “Ecosystem based adaptation (EBA) can be combined with, or even a substitute for, the use of engineered infrastructure or other technological approaches. Engineered defenses such as dams, sea walls and levees adversely affect biodiversity, potentially resulting in maladaptation due to damage to ecosystem regulating services. There is some evidence that the restoration and use of ecosystem services may reduce or delay the need for these engineering solutions. EBA offers lower risk of maladaptation than engineering solutions in that their application is more flexible and responsive to unanticipated environmental changes. Well-integrated EBA can be more cost effective and sustainable than non-integrated physical engineering approaches (Jones et al., 2012), and may contribute to achieving sustainable development goals (e.g., poverty reduction, sustainable environmental management, and even mitigation objectives), especially when they are integrated with sound ecosystem management approaches.” (Chapter 3 and Also Chapter 15 Adaptation Planning and Implementation)
  1. Dams and Hydropower projects affect biodiversity, which is critical in facing climate change challenges
  • “Freshwater ecosystems are considered to be among the most threatened on the planet. Fragmentation of rivers by dams and the alteration of natural flow regimes have led to major impacts on freshwater biota.” (Chapter 4: Terrestrial and Inland Water Systems)
  • “Damming of river systems for hydropower can cause fragmentation of the inland water habitat with implications for fish species.” (Chapter 4 Terrestrial and Inland Water Systems)
  •  “Freshwater ecosystems are also affected by water quality changes induced by climate change, and by human adaptations to climate-change induced increases of streamflow variability and flood risk, such as the construction of dykes and dams”. (Chapter 3: Freshwater resources)
  • “Hydropower generation leads to alteration of river flow regimes that negatively affect freshwater ecosystems, in particular biodiversity and abundance of riverine organisms, and to fragmentation of river channels by dams, with negative impacts on migratory species. (Chapter 3: Freshwater Resources)
  • “Hydropower operations often lead to discharge changes on hourly timescales that are detrimental to the downstream river ecosystem.”
  • “Climate change and habitat modification (e.g., dams and obstructions) impact fish species such as salmon and eels that pass through estuaries.” (Chapter 5 Coastal Systems and low lying areas)
  1. In Tropics, global warming potential of hydropower may exceed Thermal Power
  • “In tropical regions, the global warming potential of hydropower, due to methane emissions from man-made reservoirs, may exceed that of thermal power; based on observed emissions of a tropical reservoir, this might be the case where the ratio of hydropower generated to the surface area of the reservoir is less than 1 MW/km2”.
  • “Reservoirs can be a sink of CO2 but also a source of biogenic CO2 and CH4” (Chapter 4 Terrestrial and Inland Systems)
  1. Dams increase vulnerability of weaker sections to climate change
  • “A number of studies recognize that not every possible response to climate change is consistent with sustainable development, since some strategies and actions may have negative impacts on the well-being of others and of future generations .For example, in central Vietnam some responses to climate change impact, such as building dams to prevent flooding and saltwater intrusion and to generate power, threaten the livelihood of poor communities. First, the relocation of communities and the inundation of forestland to build dams limit households’ access to land and forest products. Second, a government focus on irrigated rice agriculture can reduce poor households’ ability to diversify their income portfolio, decreasing their long-term adaptive capacity. Indeed, the consequences of responses to climate change, whether related to mitigation or adaptation, can negatively influence future vulnerability, unless there is awareness of and response to these interactions. Here, the role of values in responding to climate change becomes important from a variety of perspectives, including intergenerational, particularly when those currently in positions of power and authority assume that their prioritized values will be shared by future generations. (Chapter 20: Climate-resilient pathways: adaptation, mitigation, and sustainable development)
  •  “Some documented impacts on dams, reservoirs and irrigation infrastructure are: reduction of sediment load due to reductions in flows (associated with lower precipitation), positively affecting infrastructure operation (Wang et al., 2007); impacts of climate variability and change on storage capacity that creates further vulnerability; and failures in the reliability of water allocation systems (based on water use rights) due to reductions of streamflows under future climate scenarios” (Chapter 9: Rural Areas)
  • “Infrastructure (e.g. roads, buildings, dams and irrigation systems) will be affected by extreme events associated with climate change. These climate impacts may contribute to migration away from rural areas, though rural migration already exists in many different forms for many non-climate-related reasons.” (Chapter 9 Rural Areas)
  • “Changes in water use, including increased water diversion and development to meet increasing water demand, and increased dam building will also have implications for inland fisheries and aquaculture, and therefore for the people dependent on them” .
  • “In the case of the Mekong River basin, a large proportion of the 60 million inhabitants are dependent in some way on fisheries and aquaculture which will be seriously impacted by human population growth, flood mitigation, increased offtake of water, changes in land use and overfishing, as well as by climate change. Ficke et al. (2007) reported that at that time there were 46 large dams planned or already under construction in the Yangtze River basin, the completion of which would have detrimental effects on those dependent on fish for subsistence and recreation.” (Chapter 7 Food security and food production systems)
  1. Existing Dams have to be managed sustainably, with ecological considerations:
  • “Suggested strategies for maximizing the adaptive capacity of ecosystems include reducing non-climate impacts, maximizing landscape connectivity, and protecting ‘refugia’ where climate change is expected to be less than the regional mean. Additional options for inland waters include operating dams to maintain environmental flows for biodiversity, protecting catchments, and preserving river floodplains.” (Chapter 24:Asia )
  1. Hydropower itself is vulnerable to Climate Change
  • “Climate change affects hydropower generation through changes in the mean annual stream-flow, shifts of seasonal flows and increases of stream-flow variability (including floods and droughts) as well as by increased evaporation from reservoirs and changes in sediment fluxes. Therefore, the impact of climate change on a specific hydropower plant will depend on the local change of these hydro-logical characteristics, as well as on the type of hydropower plant and on the (seasonal) energy demand, which will itself be affected by climate change”
  • “Projections of future hydropower generation are subject to the uncertainty of projected precipitation and stream-flow. In regions with high electricity demand for summertime cooling, this seasonal stream-flow shift is detrimental. In general, climate change requires adaptation of operating rules which may, however, be constrained by reservoir capacity. Storage capacity expansion would help increase hydropower generation but might not be cost-effective.”
  • “Observations and models suggest that global warming impacts on glacier and snow-fed streams and rivers will pass through two contrasting phases. In the first phase, when river discharge is increased due to intensified melting, the overall diversity and abundance of species may increase. However, changes in water temperature and stream-flow may have negative impacts on narrow range endemics. In the second phase, when snowfields melt early and glaciers have shrunken to the point that late-summer stream flow is reduced, broad negative impacts are foreseen, with species diversity rapidly declining once a critical threshold of roughly 50% glacial cover is crossed.” (Chapter 3 Freshwater Resources)

Let us hope that these collated finding will be helpful in addressing the myth that dams and hydropower projects are climate friendly and can even be looked at as adaptation measures. Let us also hope that the Working Group III Report, which will come out in less than a week’s time from now, will have lessons for hydropower development in line with the above statements in the WG II report.

Issues with WG III, Special Report on Renewable Energy

Findings of WG II contrast strikingly with Special Report on Renewable Energy Sources and Climate Change Mitigation (SRREN) [4]brought out by Working Group III in 2011.

SRRE
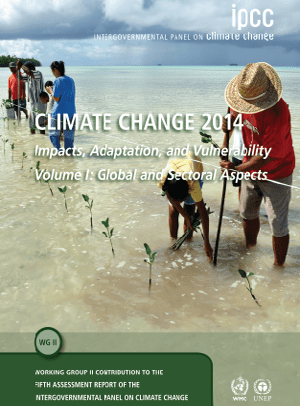
One of the two lead coordinating authors of this report was Dr. Arun Kumar, from AHEC, IIT Roorkee. Notably, Dr. Kumar was also a part of the team which worked on Cumulative Impact Assessment of Hydropower projects in Upper Ganga basin of Uttarakhand[5]. The state suffered huge flood and precipitation damages in June 2013 (long after the report came out) and commissioned and under–construction hydropower projects had a large role to play in compounding the impacts of the disaster[6]. Ministry of Environment and Forests as well as the Supreme Court of India rejected this report. SANDRP had published a detailed critique of this CIA report at the outset.

Amazingly, the Hydropower Section of the above mentioned IPCC Special Report on Renewable Energy severely downplays and ignores the impacts of hydropower. For example, it does not allude to peoples protests to projects, impacts of projects by blasting and tunneling, downstream impacts, impacts of peaking, associated deforestation and related development, cumulative impacts of projects in a cascade, increasing climate vulnerability of the population, seismic impacts, increased disaster vulnerability of the region, etc.,. In fact, these impacts have been some of the most-discussed issues in hydropower discourse in many countries at the moment. The report makes strange statements like “trans-boundary hydropower establishes arena for international cooperation”, when we see across the world that hydropower projects on internationally shared rivers further conflicts and strife between nations. It also downplays methane emissions from hydropower.

In all, the section appears biased towards hydropower and does not do justice to IPCC’s rigorous and objective standards. The section should not have been accepted as it stands now.

Now, the Working Group III is yet to submit its Assessment Report to the IPCC. It will be discussed by the IPCC between 7-11 April 2014, in Berlin. We hope there is true depiction of hydropower in the Working Group III report, looking at the above mentioned impacts and also keeping in mind strong statements from Working Group II report made public on March 31, 2014.

Parineeta Dandekar, parineeta.dandekar@gmail.com

~~~


[1] The IPCC Working Group I (WG I) assesses the physical scientific aspects of the climate system and climate change. Working Group II (WG II) assesses the vulnerability of socio-economic and natural systems to climate change, negative and positive consequences of climate change, and options for adapting to it. It also takes into consideration the inter-relationship between vulnerability, adaptation and sustainable development. The assessed information is considered by sectors (water resources; ecosystems; food & forests; coastal systems; industry; human health) and regions (Africa; Asia; Australia & New Zealand; Europe; Latin America; North America; Polar Regions; Small Islands). The IPCC Working Group III (WG III) assesses options for mitigating climate change through limiting or preventing greenhouse gas emissions and enhancing activities that remove them from the atmosphere. (https://www.ipcc.ch/working_groups/working_groups.shtml)

[2] https://www.ipcc.ch/

[3] https://www.ipcc.ch/pdf/ar5/pr_wg2/140330_pr_wgII_spm_en.pdf

[4] http://www.ipcc-wg3.de/special-reports/srren/special-report-renewable-energy-sources

[5] http://www.sandrp.in/hydropower/Pathetic_Cumulative_Impact_Assessment_of_Ganga_Hydro_projects.pdf

[6] https://sandrp.wordpress.com/2013/06/21/uttarakhand-deluge-how-human-actions-and-neglect-converted-a-natural-phenomenon-into-a-massive-disaster/

https://sandrp.wordpress.com/2013/06/23/uttarakhand-floods-disaster-lessons-for-himalayan-states/

https://sandrp.wordpress.com/2013/06/25/uttarakhand-and-climate-change-how-long-can-we-ignore-this-in-himalayas/

https://sandrp.wordpress.com/2013/08/14/uttarakhand-flood-disaster-supreme-courts-directions-on-uttarakhand-hydropower-projects/

https://sandrp.wordpress.com/2013/09/27/uttarakhand-floods-of-june-2013-curtain-raiser-on-the-events-at-nhpcs-280-mw-dhauliganga-hep/


Arunachal Pradesh · Assam · brahmaputra · Embankments · Ministry of Water Resources

Analysis MoWR’s Advisory Committee’s Decisions for Northeast – January 2009 to Dec 2013

This is analysis of the decisions of the Advisory Committee in the Union Ministry of Water Resources for consideration of techno-economic viability of Irrigation, Flood Control and Multi Purpose Project Proposals (TAC in short) for North East India[1] from 95th meeting of January 2009 to 122nd meeting held in December 2013. In our last analysis of TAC minutes we have covered the decision taken for NE states from July 2011 to December 2013 which  is available at – https://sandrp.wordpress.com/2014/03/19/lack-of-transparency-and-accountability-remains-the-norm-of-functioning-for-mowrs-advisory-committee/. In this analysis, we have covered the same for an extended period. In these five years TAC has accepted project proposals worth of 5515.46 crores. In calculating the total cost of the projects considered we have considered only the projects whose proposals were given clearance by TAC. In these five years, some of the projects also made two appearances with revised costs. In such cases the higher revised cost has been taken into consideration, e.g. Khuga Multipurpose Project and Dolaithabi Barrage Project, both located in Manipur were accepted by the committee in its 100th meeting (held on 9th October 2009) with revised cost of Rs 381.28 crore and 251.52 crore respectively. In the 115th meeting (held on 24th July 2012) of the TAC, these two projects were considered again where the cost for Khuga Project was Rs. 433.91 cr and for Dolaithabi Project it was Rs. 360.05 Cr. The same is the case for the Thoubal Multipurpose Project which appeared in 101st and 115th meeting of the TAC.

Within these five years, TAC has given financial clearance to 26 flood and erosion control projects and majority of these projects are from Assam. The committee gave the clearance to 6 irrigation projects, 3 barrage projects and 3 multipurpose projects.[2] The committee also gave clearance to a strom water drainage improvement project below Greenfield Airport at Pakyong in Sikkim within this period.

In this period, largest no of considered (25) and approved (20) projects were from Assam. Assam also has the maximum cost of projects among all states (Rs. 2631.99 Cr). Highest number of projects were considered (16) and approved (14) in the year 2009, with total cost of Rs 2321 Crores, which too was highest among all the years.

As found in our previous analysis, in the last five year from 2009 to 2013 TAC has not rejected a single project. Five projects had been deferred but were approved in the subsequent meetings within the same period. In the 108th meeting (held on 4th January 2011), the TAC did not discuss two projects on the Brahmaputra river stating “It was observed that the flood control and anti erosion scheme of Brahmaputra Board are implemented through Central Fund, which do not require investment clearance from the Planning Commission. Therefore, these schemes need not be put up to the Advisory Committee. However, the technical aspect of such project may be looked into by Central Water Commission as per past practice.”  But both these projects were reconsidered in the 110th meeting of TAC (held on 20th July 2011) and were cleared by the committee.

So this seems like a rubber stamping committee, clearing everything that comes to it. Reading of the minutes of the meetings also reveals that there are hardly any critical questions asked on merits of the questions for the massive delay and cost escalations that most of the projects suffer. Nor is there an discussion about the performance of the projects.

As we noted earlier, this committee functions in most non transparent, non participatory and unaccountable way. Neither the minutes nor the agenda notes of the meetings are in public domain. Following our letters along with TAC analysis in April 2011, addressed to Planning Commission, Union Ministry of Water Resources, Central Water Commission and members of the National Advisory Council, for the first time, TAC minutes were put up on CWC website (see: http://www.cwc.gov.in/main/webpages/TAC%20minutes.html). However, the last uploaded minutes were for the 115th meeting held in July 2012, after which minutes have stopped being uploaded. Secondly, some of the links are not working and all the files are unnecessarily large PDF files since only scanned pages of the minutes are put up, in place of the PDFs of normal word files, which would be of much smaller size. The TAC also has no independent, non government members, all the members are government officials. As we wrote to MoWR and Planning Commission in April 2011 and again in March 2014, there is urgent need for TAC to have  such members so that they provide objective perspective about the projects that come up before TAC.

The importance of functioning of this committee cannot be over emphasised. As we  wrote  in our letter to MoWR and Planning Commission, TAC “considers dozens of such projects with huge economic, social, environmental and other implications for the country in every one of its meetings. All of these projects are supposed to be public purpose projects, and are taken up using public resources. The Planning Commission accords investment clearance to the projects only after the TAC clearance. This Committee’s decisions are perhaps the ones which impact on India as a whole the most – as they relate to land and water – which are the basic life sustaining and livelihood providing resources for the people.”

It is high time that first effective steps are taken to ensure that the functioning of this committee becomes more transparent, participatory and accountable.

State-wise list of projects cleared by TAC

State No of Projects Considered No of projects approved Total cost of the projects
Arunachal Pradesh 4 4 106.6
Assam 25 20 2631.99
Manipur 10 10 2268.99
Meghalaya 1 1 5.63
Sikkim 1 1 48.55
Tripura 6 6 453.7

Note: No projects from Mizoram and Nagaland have come to TAC in this 5 years period.

Year-wise List of Projects Cleared by TAC

Year No of Projects Considered No of projects approved Total cost of the projects
2009 16 14 2321
2010 5 5 663.67
2011 12 9 497.33
2012 5 5 2208.81
2013 9 9 1439.45

Meeting-wise List Projects Cleared by TAC January 2009 to December 2013

Sl. No Meeting no Date of meeting No of projects considered No projects approved No of projects deferred No of projects rejected Total cost of the accepted projects, Rs Crore
95th 20.01.2009 4 3 1 0 196.07
96th 16.02.2009 2 2 0 0 168.14
100th 09.10.2009 6 5 1 0 264.73
101st 30.11.2009 4 4 0 0 77.26
102nd 28.01.2010 1 1 0 0 59.91
103rd 11.03.2010 1 1 0 0 302.22
106th 16.09.2010 3 3 0 0 301.54
108th 04.01.2011 2 0 2 0 0
109th 04.03.2011 3 3 0 0 70.13
110th 20.07.2011 5 4 1 0 211.56
111th 17.08.2011 1 1 0 0 167.09
112th 14.09.2011 1 1 0 0 48.55
115th 24.07.2012 5 5 0 0 2208.81
117th 21.03.2013 1 1 0 0 155.87
118th 30.07.2013 2 2 0 0 467.38
119th 29.08.2013 2 2 0 0 601.67
120th 13.09.2013 1 1 0 0 42.96
121st 08.10.2013 2 2 0 0 146.01
122nd 20.12.2013 1 1 0 0 25.56
Total   47 42 5 0 5515.46

95th meeting (20.01.2009): Accepted TOTAL – Rs 196.07 crores (revised costs have been taken into consideration)

SN Project Dist/ State Appr. year River/ Basin Original (revised) Cost-CrRs Decision
1 Protection of Sialmari Area Morigaon/ AS 2002 B’putra 14.29 (25.73) Accepted
2 Protection of Bhojaikhati, Doligaon and Ulubari AS 2002 B’putra 14.52 (27.92) Accepted
3 Protection of Majuli Island Ph II-III AS New B’putra 116.02 Deferred the proposal with suggestion to prepare the cost at current prices.
4 Raising & strengthening Dyke from from Sissikalghar to Tekeliphuta including closing of breach by retirement and anti erosion measures AS New B’putra 142.42 Accepted

96th meeting (16.02.2009): Accepted Total – Rs 168.14 crores

SN Project Dist/ State Appr. year River/ Basin Original (revised) Cost-CrRs Decision
1 Flood protection of Majuli Island Ph-II & III AS New B’putra 115.03 Accepted
2 Restoration of Dibang & Lohit rivers to their original courses at Dholla Hattiguli AS New B’putra 23.32(53.11) Accepted partially & suggested that proposal of coffer dam, pilot channel, etc. may be put up to the Standing Committee for expert opinion

100th meeting (09.10.2009): Accepted: TOTAL – Rs 897.53 crores

SN Project Dist/ State Appr. year River/ Basin L of Dam Original (revised) Cost-CrRs Benefit Irri CCA Annual Irrigation Decision
1 Borolia Irrigation Project AS 1980 Brahmaputra 92 m 6.775 (135.93) 9717 15,000 Ha Deferred due to non-submission of State Finance Concurrence
2 Khuga Multipurpose (Major- Revised) Manipur 1980 Khuga/ Imphal 230 m 15 (381.28) 9575 14,755 Ha Accepted
3 Dolaithabi Barrage Project (Med Revised) Manipur 1992 Iril/ Manipur 79 m 18.86 (251.52) 5,500 7,545 Ha
4 Gumti Irrigation Project (Revised) Tripura 1979 Gumti 96 m 5.88 (83.01) 4,486 9,800 ha Accepted
5 Khowai Irrigation Project (Revised) Tripura 1980 Khowai 96 m 7.10 (83.01) 4,515 9,320 Ha Accepted
6 Manu Irrigation Project Tripura 1981 Manu 82 m 8.18 (98.71) 4,198 7,600 Ha Accepted

101st meeting (30.11.2009): Accepted TOTAL – Rs 1059.26 crores

SN Project State Appr. year River/ Basin L of Dam Original (revised) Cost-CrRs Benefit Irri CCA/ flood prot. Annual Irrigation Decision
1 Raising & strengthening to Puthimari embankment Assam New B’putra NA 30.23 15000 Ha NA Accepted
2 Anti Erosion measures to protect left B’putra Dyke Assam New B’putra NA 27.97 5000 Ha NA Accepted
3 Protection of Gakhirkhitee and its adjoining areas Assam New B’putra NA 19.06 20,000 Ha NA Accepted
4 Thoubal Multipurpose Project (revised) Manipur 1980 Thoubal/ Imphal 1074 m 47.25 (982) 21,862 ha 33,449 Ha Accepted

102nd meeting (28.01.2010): Accepted TOTAL – Rs 59.91 crores

SN Project Dist/ State Appr. year River/ Basin Original Cost-CrRs Benefit-flood protsn Decision
1 Emergent measures for protection of Rohmoria in Dibrugarh Dist Assam New Brahmaputra 59.91 18,000 Ha Accepted

103rd meeting (11.03.2010): Accepted: TOTAL Cost of approved projects: Rs 302.22 crores

Project Dist/ State Appr. year River/ Basin L of Dam Original (revised) Cost-CrRs CCA (Ha) Annual Irrigation (Ha) Decision
Champamati Irrigation Project Chirag/AS 1980 Champamati/B’putra 258.5 m 15.32 (309.22) 17,414 24,994 Accepted

106th meeting (16.09.2010): Accepted TOTAL – Rs 301.54 crores

SN Project Dist/ State Appr. year River/ Basin Original (revised) Cost-CrRs Decision
1 Raising & strengthening of tributary dyke on both banks of Kopili River Assam New Kopilli/ B’putra 110.72 Accepted
2 Assam Integrated Flood River Bank Erosion Risk Management Project Dibrugarh/ Assam New Brahmaputra 61.33 Accepted
3 Assam Integrated Flood River Bank Erosion Risk Management Project Palasbari/ Assam New Brahmaputra 129.49 Accepted

108th meeting (04.01.2011): Accepted TOTAL- Rs 0

SN Project Dist/ State Appr. year River/ Basin Original (revised) Cost-CrRs Decision
1 Restoration of Dibang & Lohit rivers to their original courses at Dholla Hattiguli AS New Brahmaputra 23.32(53.11) The technical aspect pf this type of project may be looked in to by CWC as per past Practices.
2 Protection of Majuli Island from flood & erosion, Ph II-III AS New Brahmaputra 116.02 The technical aspect pf this type of project may be looked in to by CWC as per past Practices.

109th meeting (04.03.2011): Accepted TOTAL – Rs 70.13crores

SN Project Dist/ State Appr. year River/ Basin Original (revised) Cost-CrRs Decision
1 Anti Erosion & Flood Protection work in Dikrong Basin Arunachal Pradesh New Dikrong 23.68 Accepted
2 Anti Erosion & Flood Protection work in Bhareli sub Basin Arunachal Pradesh New Bhareli 16.81 Accepted
3 Anti Erosion & Flood Protection work in Siyom Basin Arunachal Pradesh New Siyom 29.64 Accepted

110th meeting (20.07.2011): Accepted: TOTAL: Rs 211.56 crores

Sl No Project Dist/State Appr. year basin original cost (Rs. Cr) decision
1 Anti Erosion & Flood protection in Tawangchu basin ArP New Tawangchu 36.47 Accepted
2 Protection of Majuli from Flood & Erosion Ph II & III Assam 2011 Brahmaputra 115.03 Accepted
3 Restoration of rivers Dibang and Lohit to their original courses at Dholla Hatighuli Assam 2011 Brahmaputra 54.43 Accepted
4 Protection of Balat village from flood and erosion of river Umngi in W Khasi hill district West Khasi hill/Meghalaya New Brahmaputra 5.63 Accepted

111th meeting (17.08.2011): Accepted: TOTAL: Rs 167.09 crores

Project Dist/State Appr. year basin original cost decision
Protection of Biswanath Panpur including areas of upstream Silamari and Far downstream Bhumuraguri to Borgaon Sonitpur/Assam New Brahmaputra Rs 167.09 Cr Accepted

112th meeting (14.09.2011): Accepted: TOTAL: Rs 48.55 crores

Sl No Project Dist/ State Appr. year original cost (Rs. Cr) decision
1 Improvement of Strom Water Drainage below Greenfield Airport at Pakyong Sikkim  New 48.55 Accepted

115th meeting (24.07.2012): Accepted: TOTAL: Rs 2208.81 crores

Sl No Project Dist/State Appr. year basin original cost (Rs. Cr) decision
1 Thoubal Multipurpose project Manipur 1980 Brahmaputra 1387.85 Accepted
2 Khuga Multipurpose project Manipur 1980 Brahmaputra 433.91 Accepted
3 Dolathabi Barrage Project Manipur 1992 Brahmaputra 360.05 Accepted
4 ERM of Imphal Barrage Project Manipur New Brahmaputra 16.8 Accepted
5 ERM of Sekmai Barrage Project Manipur New Brahmaputra 10.2 Accepted


117th meeting (21.03.2013): Accepted: TOTAL: Rs 155.87 crores

Sl No Project Dist/ State Appr. year basin Ht / L of Dam/Embnk. original cost (Rs. Cr) Benefit flood prot. (Ha) decision
Protection of Sissi-Tekeliphuta dyke from erosion – Lotasur to Tekeliphuta Assam New Brahmaputra 153 km 155.87 10117 Accepted

1188h meeting (30.07.2013): Accepted: TOTAL: Rs 467.38 crores

Sl No Project Dist/ State Appr. year River/ basin original cost (Rs. Cr) Benefit flood prot. (Ha) decision
Flood management of Dikrong and river training works on both banks embankment Lakhimpur/ Assam New Dikrong/ Brahmaputra 105.96 9998 Accepted
Flood management of Ranganadi and river training works on both bank embankments Lakhimpur/ Assam  New Ranganadi/ Brahmaputra 361.42  21056 Accepted

119th meeting (29.08.2013): Accepted: TOTAL: Rs 601.67 crores

Sl No Project Dist/ State Appr. year River/ basin original cost (Rs. Cr) annual irrigation decision
Dhansiri Irrigation project Assam 1975 Dhansiri/ B’putra 567.05 Accepted
ERM of Singda multipurpose project Manipur  New Brahmaputra 34.62 3000 Accepted


120th meeting (29.08.2013): Accepted: TOTAL: Rs 42.96 crores

Project Dist/State River original cost (Rs. Cr) decision
Anti erosion work along river Haora from Champakpur to Baldakhal W Tripura Haora 42.96 Accepted

121st meeting (08.10.2013): Accepted: TOTAL: Rs 146.01 crores

Sl No Project Dist/ State River original cost (Rs. Cr) Benefit flood prot. (Ha) decision
Anti erosion work along river Gumti from Dlak Samatal Para to Durgapur under Amarpur, Udaipur & Sonamura subdivision S & West Tripura Gumti 54.99 2209 Accepted
Anti erosion work along river Khowaii from Netajinagar to Banglahour under Telimura subdivision and from south L. N. Pur to Paharmura bridge under Khowai subvision West Tripura Khowaii 91.02  4256 Accepted

122nd meeting (20.12.2013): Accepted: TOTAL: Rs 25.56 crores

Sl No Project Dist/State River original cost (Rs. Cr) decision
Loktak Lift Irrigation Project Manipur 25.56 Accepted

 Parag Jyoti Saikia and Himanshu Thakkar

————————————–

[1]While this article only contains the details of the North East India Projects considered in TAC for the five years, we hope to soon provide details of the projects considered by TAC from all over India.

[2] Sicne Khuga Multipurpose, Thoubal Multipurpose and Dolaithabi barrage project, all from Manipur appears twice in this period, they have calculated only for once here.

[3] Feature image – Khuga Mutipurpose project. Image courtesy – http://manipuronline.com/