Climate Change · South Asia

Climate Change, Migration and Conflicts in Assam-Bangladesh: Why we need better reports than this

A new report named “Climate Change, Migration andClimateMigrationSubContinent_COVER 
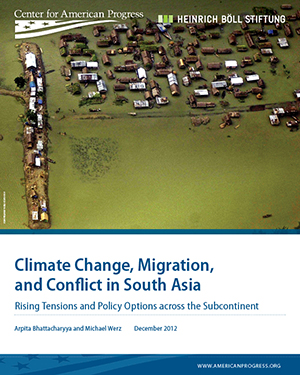
Conflicts in South Asia: Rising tension and Policy options across the sub-continent” was published in December 2012 by Center for American Progress and Heinrich Böll Foundation. This report, authored by Arpita Bhattacharyya and Michael Werz has analyzed how migration and security concerns are overlapping in the era of climate change in South Asia. Even though the title of the report mentions South Asia, it is mainly focused on India and Bangladesh. The central argument of the report is that an inevitable threat of climate change will intensify migration from Bangladesh to Northeast India, in general and Assam in particular.

In this report the authors have examined the role of climate change, migration, and security broadly at the national level in India and Bangladesh. Discussing the focus and relevance of the report the authors write “In this paper we examine the role of climate change, migration, and security broadly at the national level in India and Bangladesh—and then zero in more closely on northeast India and Bangladesh to demonstrate the interlocking problems faced by the people there and writ larger across all of South Asia.” But the report falls short of indentifying a causal relationship between climate change, migration, and conflict. This report emphasizes on understanding climate change, migration and security as three distinct layers of tension and assesses scenarios in which the three layers will overlap. The report takes Assam, the central state of northeastern border of India as a case study where the three factors converge. But the elements related to this convergence are rather inadequate that required further probing.

The report discusses the Assam movement of 1983 and the    clashes which  occurred in the summers of 2012 between ‘members of the Bodo tribe and  and  Muslim community’. Bringing climate change into the framework the report states “In assessing the security challenges of climate change, Assam provides an example of several factors coming together in a complex way. Climate change will stress existing migration patterns both locally and internationally in Bangladesh. Even more importantly, the perception that there has been an increase in immigrants has the potential to stoke tensions over immigration in Assam.” It seems to be generalization of a very complex process. We have found towering claims like this have very less linkages with the situation on ground(please see our blog – 2012 Floods Displaced 6.9 Million in Northeast-IDMC: Staggering but Highly Exaggerated). The report also mentioned that “Floods in September 2012 displaced 1.5 million people in the northeastern state of Assam” this again is not beyond doubts. The data available from National Disaster Management shows that, highest number of people affected in the floods in September 2012 is 383421.

Climate Change Scenario in India: For India the report draws from the “Climate Change and India: A 4×4 Assesment” (2010) which was prepared by the Indian Ministry of Environment and Forests for examining climate change impacts and projections through 2030 across four regions of India (the Himalayan Region, Western Ghats, Northeastern Region, and the Coastal Region) and four key policy sectors: agriculture, forests, human health, and water.

Bangladesh Discussing the situation in Bangladesh the reports deals with rising temperatures which are likely to have severe effects on agricultural production in Bangladesh due to higher rates of evaporation and changing rainfall patterns. According to the authors “Bangladesh could see up to an 8 percent reduction in rice production and a 32 percent reduction in wheat production by 2050…. With 63 percent of the population dependent on agriculture for basic livelihoods, the rise in temperatures could be crippling.”

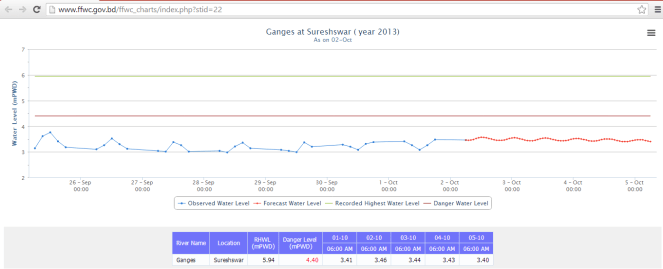
The report warns about increases both in extent and frequency of floods in the country. Talking about rise in sea level the report states, “The Bangladeshi government projects that the sea level will rise by 5.5 inches (14 centimeters) by 2030, 12.6 inches (32 centimeters) by 2050, and 34.7 inches (88 centimeters) by 2100. Predictions about the displacement of people resulting from a 1-meter (roughly 40 inches) rise in sea-level range from 13 million to 40 million in Bangladesh alone.” The report also discusses cyclone and storm surges, river and coastal erosion and saltwater intrusion. Bringing migration into the picture, the report first discusses rural urban migration within Bangladesh and describes a situation of migrants in the capital city Dhaka “When describing why they came, migrants tell stories of flood and famine in quiet rural towns where options dwindle by the day … these villagers pour into Dhaka at a rate of about 400,000 to 500,000 each year.”

Talking about international migration from Bangladesh, the report states “More informal—but still substantial—migration takes place from Bangladesh to India, especially to the far eastern Indian states of West Bengal and Assam….. It is estimated that approximately 12 million to 17 million Bangladeshi immigrants have come to India since the 1950s, with most residing in the northeast states of West Bengal, Assam, and Tripura.” In this situation presenting the interplay of migration and climate change the report says, “How climate change will effect migration to Bangladesh’s urban centers is not exactly determined. Even more uncertain is how climate change and Bangladesh’s urban growth will interact to shape international migration, particularly to India. But given the trajectory of available climate change projections and historical precedent, India may continue to be a popular destination for many Bangladeshi migrants.” However this seems to be an opaque statement without any substantiation. Instead of pitching their argument in the ahistorical categorization between an underdeveloped Bangladesh and an emerging India, the author should consider the present human development indicators of Bangladesh vis-à-vis India  (please see “Social indicators of Bangladesh are better than India”).

As a part of the solution, it suggests building of sustainable urban areas where governments manage to guarantee food security, deliver required energy resources, and develop infrastructure to more effectively protect livelihoods in rural areas. However, its suggestion that “economic growth must be maintained to accommodate growing populations and allow society to better prepare itself to deal with the impacts of climate change” seems to suggest that the authors have not understood basics of both economic growth and re-distribution as well as  climate change.

The American Perspective The paper does not provide any adaptation and mitigation measures for climate change. The paper argues for changing the pathways of growth towards greater sustainability. Talking about modern sustainable urban centers the paper focuses on the areas where U.S.-Indian cooperation can happen. The report is written in order to assess how United States can play a pivotal role in the threats and consequences of climate change arena in South Asia and that is why ‘the American perspective’ on the climate change in South Asia can be all pervasively found in the report. The report propose three policy collaborations that the United States can take up with South Asian partners as complex crisis scenarios unfold in the wake of climate change – 1. High-level climate-vulnerable cities workshop, 2. A dialogue on migration and 3. Ecological infrastructure development.

Pressing Critical issues

There are a lot of critical issues with this report which needs to be addressed.

How much migration is actually happening now: The report establishes its firm belief in the fact that large scale migration from Bangladesh to northeastern parts of India is still continuing. The report should have first questioned how much migration is actually happening rather than claiming that there will be increase in migration in the near future. There were several analysis available specially drawn from Government of India’s Census data which shows a complete different picture.  In an article named “Riots & the Bogey of Bangladeshis”, published in Hindu on 8th August 2012,  Delhi base researcher and activist Bonojit Hussain did an analysis of census data and reported that “Even though the religion-wise census figures for 2011 are not yet available, provisional results from the 2011 census show that the decadal growth rate of population between 2001-2011 for Kokrajhar district is 5.19 per cent, interestingly, marking a decline of 9 per cent as compared to the decadal growth rate of 14.49 per cent between 1991 to 2001. (The decadal growth rate for Assam between 1991 to 2001 was 18.92 per cent and 16.93 per cent between 2001-2011)……. The other possibility, which seems more plausible, is that there has been a considerable out-migration from Kokrajhar, especially after the formation of the BTAD in 2003. Since the Bodos (who constitute 20 per cent of the population in the BTAD area) hold a monopoly over political power in the area, it is unlikely that there has been any significant out-migration of the Bodo population from Kokrajhar district. The Koch Rajbangsis, who constitute roughly 17 per cent of the total population of the BTAD, have been campaigning for and demanding a separate homeland — Kamtapur — which territorially overlaps the BTAD, thus making it unlikely that they would out-migrate, abdicating their political claim over the territory. In all probability, the out-migration involves other non-Bodo communities, including Muslims.” The report seems to ignore this reality. It is also important to note that the report has very little to substantiate its assumptions.

Social indicators of Bangladesh are better than India: The report seems to ignore the substantial improvements in social indicators in Bangladesh. A recent review of Jean Drèze and Amartya Sen’s new book ‘An Uncertain Glory,’ states the improved social conditions of Bangladesh in the following way “even Bangladesh has better social indicators than India. It has higher life expectancy (69 vs India’s 65), better sanitation (half of all homes in India have no toilets compared to 10 per cent in Bangladesh), lower infant mortality (37 versus India’s 47) and lower fertility rate (2.2 against 2.6 for India). For those arguing that Bangladesh is a much smaller country, the answer is that its GDP per capita is roughly half that of India’s.”[1]

Is urbanization the only option: The report is biased towards urbanization. The report shows no interest to discuss how rural areas can be prepared to face climate change better. Projecting sustainable urbanization as the solution for migration is presenting only one side of the story. The report also seems like an attempt to push forward American agenda in South Asia. The report laments the facts that the urbanization programmes like JNNURM is facing shortage of funds.  But there are already several examples JNNURM programmes in India which are increasing the debt burden on the people and undermined the traditional sustainable systems.

Are thermal and large hydro-power projects climate friendly: The report on climate change shockingly, reemphasizes on coal based power generation. A study on climate change prescribing for coal based power generation is really very strange.

In another surprise the report, shows bias for (large) hydro power generation, even though hydro-power dams have very severe impacts on river ecology, bio-diversity and climate change. While discussing about water politics between China, India and Bangladesh the report mentioned about the fear of water diversion by China through hydro power dams and its severe impacts on flow of the Brahmaputra. But it makes no mention of more than 150 hydro power projects, which are being planned in Arunachal Pradesh and other north eastern states within the Indian territory and the downstream impacts of these. These projects will dam every major tributary of the Brahmaputra River. These tributaries collectively contribute at least four times more to the flow of the Brahmaputra than Yarlung Tsangpo or Siang, the part of Brahmaputra which flows from China. The report has no reference to any of this.

Internal migration within Assam and India: The report talks about migration from Bangladesh to Assam but it makes no mention of people migrating from rural areas of Assam to other cities due to severe flood and erosion. The report also does not take into account the case of char-dwellers (people living in sand bars) in Bangladesh and Assam. According to the Socio Economic Survey of 2003-04 in 14 districts of Assam, there were 2251 char villages with a population of 24, 90,397.[2] People who live on chars in Assam and in Bangladesh will be directly affected by any change in flow pattern in the rivers.

Spreading propaganda? Though this report is on migration from Bangladesh to Assam, the report presents very little data to back up its claims. Besides, on the issue of increasing Maoist activity in India, the report does a shoddy job. The map showing maoist activities in India is questionable. Since this report accepts the current development path of coal based and large hydro-based power generation unquestionably, the discussion on Maoist activity in India resonate with Assam’s Chief Minister Tarun Goigoi’s unfounded attempts at colouring of anti-dam struggle of the people in Assam as Maoist activity. Such uncritical acceptance of Indian government’s unfounded assertions discredits the report.

Parag Jyoti Saikia


[1] http://www.thehindu.com/books/books-reviews/the-inequalities-of-democracy/article4941693.ece

[2] Chakraborty G.,”Distortion  of Natural Watersheds and Land Erosion: The Char Areas Of Assam”, SIBCOLTEJO, Vol. 05 (2010): 18-30

Dams

River Conversations

Rivers in our times are facing many threats, most rivers are facing existential threats. This blog is a way of starting some conversation on Rivers and the threats that they face.

Since February 2013 (the blog was launched in June 2012, but till Feb 2013 there were just about six blogs, posted in June-July 2012, none after that) we at SANDRP have taken this blog a little more seriously in communicating conversations around rivers.

This is the 100th blog!

During the past about 9 months, we (SANDRP team as well as invited authors) have tried to write about issues surrounding our rivers. We’ve written about Large Dams (and mini hydels), Hydropower Projects, their impacts, their decreasing efficiency, the innumerable issues related to infrastructure projects affecting rivers, dependent communities and ecosystems and the governance process.  

We’ve talked about Climate Change and its impacts on rivers and communities, topical issues like Maharashtra drought in 2012-13, the Uttarakhand disaster in June 2013, India’s flood forecasting and disaster management, Eco sensitive areas like Himalayas and Western Ghats and threats that relatively pristine rivers of North East India are facing. Most institutions and sections of society remain oblivious, unaffected by the fate of our rivers.

Looking at the crisis that our rivers, dependent communities and freshwater ecosystems are in, the need for increased and consistent engagement with the governance processes around rivers is becoming stronger. Most of the rivers in Himalayas are being dammed multiple times, riverine fisheries and fish diversity is severely affected, dam scams are surfacing from across the country: from Maharashtra to Andhra Pradesh to Karnataka to Arunachal Pradesh.

Looking at this, we sincerely hope that more and more people will get involved with issues surrounding our rivers.

We request you to share stories and issues surrounding your rivers.

CONVERSATIONS WITH RIVER This is equally important, but more difficult. Hermann Hesse’s Siddhartha provides one of the rare instances of conversations WITH rivers. So we have reproduced some quotations from that most remarkable novel along with some photos that provide, hopefully, instances of conversations AT rivers. 

1

The Mighty Ganga Photo: Ganga Action Parivar
The Mighty Ganga Photo: with thanks from Ganga Action Parivar

2

A small boy by the Bhama River when water was released into the river after a long dry spell. Photo: SANDRP

3

Boat by the Brahmaputra Photo: SANDRP

4

Floods in Uttarakhand Photo with thanks from Times of India

5

The lovely Souparnika River in Karnataka Photo: SANDRP
The lovely Souparnika River in Karnataka Photo: SANDRP 

6

Ferryman at Varanasi Photo: with thanks from Gavin Gough gavingough.photoshelter.com
Ferryman at Varanasi Photo: with thanks from Gavin Gough gavingough.photoshelter

7

Child at Ganga Photo with thanks from:gnarlysunset.com

The river has something special to tell to all of us… only if we pause and listen…

The question is how many rivers we have with us still, to have such converstaions? How many rivers will the next generation have?

Do tell us about your conversations with rivers. In the meantime we will get back to conversations on rivers.

SANDRP

Floods · International Water Issues · Ministry of Water Resources

Bangladesh’s Amazing and New Flood Forecasting: A Tip for India’s CWC to Improve its Flood Forecasting Performance

Bangladesh has come up a new flood forecasting and warning system with several amazingly useful features of forecasting floods available on their website from June 2013. Flood forecasting is a vital non-structural measure to mitigate flood losses which can be very useful for a deltaic nation like Bangladesh which face brunt of floods annually. The Flood Forecasting and Warning Centre (FFWC) is under the aegis Bangladesh Water Development Board and is supported by UNDP through the Comprehensive Disaster Management Programme (Phase II) and Ministry of Disaster Management and Relief. The website can be accessed at http://www.ffwc.gov.bd/index.php.

ps 1

While the features have become available on website since June 2013, many of them have been otherwise available since 2011. In fact, Interactive Voice Response [Calling from mobile (phone no- 10941), flood and weather messages can be heard in Bangla (charge applicable)] facility is available since 2011.

The Deltaic Bangladesh Geographically, Bangladesh is country located in one of the biggest active deltas in the world with an area of about 1,47,570 sq km.  The climate of the country is subtropical-monsoon climate where annual average precipitation is 2300 mm which varies from1200 mm in the north-west to over 5000 mm in the north-east. Bangladesh, as stated in its Annual Flood Report of 2012, has a total of 230 rivers out of which 57 are Transboundary Rivers. 54 of these transboundary river flows from India to Bangladesh which includes the Ganges and the Brahmaputra. Bangladesh consists of flood plains of the Ganges, the Brahmaputra and the Meghna rivers and their numerous tributaries and distributaries. The FFWC carries out monitoring of 86 representative water level stations and 56 rainfall stations across Bangladesh.

The FFWC Website The homepage of the FFWC website presents a map of the whole country and its rivers, marked with flood forecasting sites in Bangladesh which is really useful for a number of reasons:

(i) For a first time visitor it gives a good idea of the rivers in Bangladesh and their flood forecasting sites.

(ii) When the cursor stops at a particular forecasting site, a pop up site appears with location details, water level, highest water level and danger level at that particular site.

(iii) with locations of forecasting sites on the same river clearly marked, one can get an overview of the situation across the river basin.

(iv) colour code of the symbol at each FF location gives an idea if the water level is above/ below warning or danger level or High Flood level.

ps 8

The homepage of FFWC offers an option to view the whole website in Bangla. This is very welcome and useful since this important information can be accessed and used by people in local language.

The home page also provides information on the sites where water level is currently on the rise or above the danger mark. Below the line of tabs of the website, name of the sites where water level is on the rise keeps on scrolling. Clicking in any of the sites in the scroll, leads to a pop-up where the rise in water level is presented in graph for the previous one week. The rise in water level for each day is also showed according to time which appears when the cursor is kept on any of the dots of the graph.  This pop up can also be saved either as a photo, as a pdf or as a SVG vector image.

The FFWC website provides rainfall data and water level data of every designated site in the four river basins of Bangladesh under the ‘data’ tab: Bramaputra (13 sites), Ganga (17 sites), Meghna (15 sites) and South East Hills (10 sites).  The rainfall data table gives rainfall of the day, along with previous two days rainfall, normal monthly rainfall and cumulative rainfall for the month. But here FFWC can add the total rainfall data for the whole season which will make it more useful.

The water level data table provides water level of the day, previous day water level and projection of water level for the next three days along with name of the river and location name for 38 sites in Brhamaputra basin, 27 sites in Ganga basin, 26 sites in Meghna basin and 7 sites in South East Hill Basin. ps 10

The FFWC website under the ‘Forecasting and Warning’ tab provides very substantial information regarding floods under following heads: ‘Flood Summary’, ‘Flood Bulletin’, ‘3-day Deterministic Flood Forecast’, ‘5-day Deterministic (experimental) Flood Forecast’, ‘Medium Range (1-10 Days)Forecast’ ‘Structure Based Forecast’ (available for a few structures like embankments or bridges on experimental basis) and ‘Special Outlook’ (only in Bangla language).

Under the ‘Map’ tab, the website has ‘Rainfall Distribution Map’ and ‘Inundation Map’. The rainfall distribution map[i] provides at a glace picture of rainfall over the last 24 hours. The latter provide the options to view inundation maps[ii] for the given day and forecasts for next two days, both for Dhaka and for Bangladesh as a whole. ps 2

ps 7

The ‘Reports’ tab holds annual reports on floods in Bangladesh for last five years. In the ‘Hydrograph’ tab, the website first provides of forecast of water level for each site through a graph. Under ‘Forecast’ the website provides observed water level at each selected site for the day, previous six days (with all the observations available on the graph) and forecast for the next three days. This is provided for 89 sites which include 8 sites from South East Hills basin, 26 sites in Meghna basin, 21 sites in Ganga basin and 34 sites in Brahmaputra basin. Division wise break up is: Borisal-1; Chittagong-11; Dhaka-30; Khulna-6; Rajshahi-14; Rangpur-12; Sylhet-15. It also provides monsoon hydrograph for 104 sites, where the water level throughout the monsoon is given, some of the graphs seems to show flat levels, though, raising questions if these are providing correct information.

Here for some sites several selected years’ monsoon season data is also represented through graph for some of the sites but it becomes bit confusing since no rational for choosing a particular year is provided. Providing the basis for choosing a particular year monsoon will clarify the picture. In both ‘forecast’ and ‘monsoon’ options the sites are presented not only river basin wise but also on the basis of regions making it more easy to use. Hydrograph also includes ‘Real Time Data’ of three sites. The real time data of these three sites presents the water level from one day to last 60 days through graph.

ps 9

GoI-CWC’s Flood Forecasting website If we compare this with the flood forecasting website of Government of India’s Central Water Commission (http://www.india-water.com/ffs/index.htm), the CWC site home page has two options ‘list based’ and ‘map based’ but the latter surprisingly never worked for this whole monsoons season, it has never worked, it seems. Clicking on the map based option leads to page which asks for plug in download. There is also an option for map browser installation but that never worked.

The ‘list based option’ has the flood forecasting sites under three options – state, basin and region-wise. But there is no page where all the flood forecasting sites can be found at one place. CWC flood forecasting site provides forecasts available at a given point of time, only for one day and which is removed as soon as the time of forecasting gets over. The forecasting in table format is made only for those sites where the water level has crossed the warning level. The CWC flood forecasting website does not provide three day, or five day or ten day forecasts. This is in contrast with the flood forecasting done by Bangladesh because the website provided water level data for each site in the country in one place and it is fast, more responsive and user friendly. Besides, on CWC site there is no option of keeping a record of previous forecasts. All the forecasting data available in the CWC website is available in English and not even in Hindi.

In case of CWC, there were also instances when water level even after crossing the danger level did not appear in the flood forecasting table. This has been observed for example in case of the Sahibganj site on the GangaRiver. Sahibganj did not appear in the flood forecasting table even for once even though the site was witnessing low to moderate floods as shown in the list base option of the same website.

There are also several other issues with the CWC flood forecasting website e.g. wrong flood forecasting, no forecasting of the floods during the Uttarakhand disaster and inadequate flood forecasting sites which had been pointed out to CWC by SANDRP[iii].

CWC need to do serious homework to improve its performance in flood forecasting for and in doing so it can take some good lessons from Bangladesh.

Extending the forecasts to GBM basin There is a huge scope for Transboundary cooperation in extending the flood forecasting across the countries sharing Ganga-Brahmaputra-Meghna basins, including Bangladesh, India, Bhutan, Nepal and China. In fact Md Amirul Hossain, Executive Engineer at FFWC wrote to SANDRP in response to a question, “The FFWC of Bangladesh has been receiving little (rather very little) upstream data/ information on water level or flood situation. This little data helped us very much for generating everyday flood forecasting. If we would be in a position to share hydro-met data of the upstream, most of within India, few in Nepal & Bhutan, then the Flood Forecasting and Warning Lead time could further be increased/ extended. FFWC-Bngladesh likes to share the information, skill and experience and would be happy to participate in an effort to develop “BASIN FLOOD FORECASTING AND WARNING” for Brahmaputra-Ganges and Meghna basin (GBM-Basin).” It is heartening to see this offer from FFWC, Bangladesh. We hope steps will be taken to realize this potential and more and transparent sharing of flood forecasting information across the countries will be a reality soon.

 Himanshu Thakkar and Parag Jyoti Saikia

Dams

NIH Roorkee’s Workshop on Eflows: Where is the credibility?

National Institute of Hydrology (NIH), Roorkee, an organisation under Union Ministry of Water Resources (MoWR) is organising a workshop on Assessment of Environmental flows (E-flows) in Rivers in Roorkee on the 2-3 October 2013.

Any serious engagement with e-flows, from any quarter is a welcome sign. However, NIH’s engagement with eflows is a bit ironic, looking at its past work and support for hydroelectric and large infrastructure projects, without any consideration for environmental flows.

Not surprisingly, NIH has refrained from inviting almost any voices that have been critical about MoWR’s Large Dam agenda. On the other hand, main ‘stakeholders’ invited are representatives from Hydroelectric dam projects! Expectedly, the workshop is looking at environmental flows in a role adversarial to “development”, without understanding the role the rivers play in a society. In fact there is no session on value of rivers, which forms the basis of the concept like eflows.

Let us have a quick look at NIH’s track record and its response to the concept of eflows so far.

Following the Uttarakhand Disaster, Supreme Court on the 13th of August, 2013 said in no uncertain terms that the Cumulative Impact Assessment Study done by AHEC, Roorkee on Upper Ganga Projects “has not made any in-depth study on the cumulative impact of all project components”, practically rejecting AHEC Study. Even the members of the MoEF’s (Ministry of Environment and Forests) EAC (Expert Appraisal Committee) on River Valley Projects have said that e-flows estimated in the AHEC report are unclear. Inter-ministerial Group Report (The BK Chaturvedi Committee) on Upper Ganga Projects has rejected most of the AHEC recommendations for eflows.

National Institute of Hydrology, Roorkee (NIH Roorkee) was a part of the study team of the AHEC Report on Upper Ganga[I] and hence, what this SC order and other agencies have said about AHEC report applies to NIH too.

NIH is supposed to be India’s premier institute on hydrology, but a closer look at the research and projects its done so far makes it clear that NIH is a also an integral part of the lobby that pushes large dams as the only solution to all of India’s water-related problems. The lobby includes the Ministry of Water Resources and the Central Water Commission. These organisations form an integral part of NIH’s organisational structure. Chairman of the governing body of NIH[II] is Secretary, MoWR. Its members include MoWR Joint Secretary and planning commission members. Its Standing Committee is comprised exclusively of MoWR representatives.

NIH introduces Environmental Hydrology as its area of specialisation. One of its tasks is[III] “Estimation of surplus and deficit water availability considering water demand and available water supply”. This concept of surplus and deficit has been used to support Interlinking of Rivers, which is ecologically one of the most destructive water projects in India. This too is explicitly supported by NIH. Note that while doing the studies related to ILR, NIH has assumed NO water for the environment!

It has estimated[IV], “In India, the estimates put a requirement of 10 BCM (billion cubic meters) for the year 2025 and 20 BCM for the year 2050 for EFR purpose.” This estimate, coming from an institute which is supposedly India’s Premier institute on hydrology lacks any ecological, social and scientific justification.

NIH’s thrust on ‘Water Resource Projects’ is so strong that its ‘water resources section’[V] pushes projects like the 2000 MW Lower Subansiri HEP, in Brahmaputra basin, without even mentioning that work on the project has stalled since Dec 2011 and  it is facing the biggest anti dam protest in India, mainly due to downstream impacts and non-transparent decision making processes.

As hydropower projects are being built in cascades in vulnerable regions, NIH has been conspicuously absent from the discourse. It has not taken a stand about e-flows, distance of free flowing rivers between projects and other environmental measures when hydropower projects are being built from Kashmir to Arunachal Pradesh with high disaster potential. On the other hand, through its studies like GLOF Analysis for Jelam Tamak Hydropower project [2] in Alaknanda basin in Uttarakhand, NIH has been largely supporting these projects, underplaying their impacts.

In fact, NIH did a eflows study for Loharinagpala HEP in Bhagirathi, where it assumed that Bhagirathi is a highly degraded river and recommended that 10% MAR will suffice as e-flows[VI], using the Tennant Method. Bhagirathi, which is hailed as the original stream of Ganga is not a ‘highly degraded’ river by stretch of imagination upstream of Maneri Bhali projects, but it will be ‘highly degraded’ if projects pushed by institutes like NIH are implemented. Significantly, Loharinagpala HEP was scrapped because of issues related to e-flows and aviral dhara of Ganga.

Strangely, NIH workshop on Assessing E-flows program starts not by addressing the importance of e-flows, but by stressing the importance of dams! The first session will be on Water Resources Development in India – need for power, irrigation, water supply and dams, to be conducted by NIH itself. It seems that this workshop is an attempt to get more eflows consultancies from private and government hydel projects.

Groups like WAPCOS (also a MoWR institute) and CIFRI have been churning out studies after studies with shoddy analysis and wrong biodiversity assessments, helping the project proponents and destroying the river further. However, communities, groups, and even judiciary are now putting its foot down about these shoddy studies.

NIH should realise that eflows are not one more of their studies which can be carried out excluding wide range of stakeholders: from communities to ecosystems. NIH has poor track record on eflows and it will have to do much more than organising workshops on eflows, if it is looking to establish its credibility on the issue.  

END NOTES:


[1] Environmental flows or E-Flows are defined as: ‘Environmental Flows describe the quantity, quality and timing of water flows required to sustain freshwater and estuarine ecosystems and the human livelihoods and well-being that depend on these ecosystems.” (Brisbane Declaration 2007)

[2] which has been rejected by Wildlife Institute of India and even BK Chaturvedi committee has suggested that the project should be taken up only after Ganga Basin Management Plan from IIT Consortium


[VI] “The E-Flow value computed by the Tenants method, considering it as 10% of the MAR, is 3848 Cumec Days for a calendar year” (NIH: Concluding Remarks No 10): Source: Dr. Bharat Jhunjhunwala’s Letter to IITR xa.yimg.com/kq/groups/8723444/2093659328/name/iitr

Dams

Happy World Rivers Day!!

Indians and South Asians dont need a reason to celebrate our rivers. Rivers, in their myriad avatars, are celebrated and worshipped across the Indian subcontinent, by religions like Islam, Hinduism, Buddhism, Jainism, Sikhism alike.

Most of our rivers are dying and the living, healthy and free flowing rivers are increasingly threatened. Indian Rivers have NO legal protection and there is no law that says that rivers should have freshwater! In the absence of political will and transparent and democratic governance more and more rivers are being damaged, diverted, destroyed and dried.

The species of flowing rivers are dwindling, the communities that depend are them are becoming increasingly vulnerable, governance surrounding rivers is becoming more and more non-transparent, strait jacketed and ecologically destructive. Decision makers are refusing to accept the dynamics, linkages, interdependencies and LIFE of rivers.

Religions too, have FAILED miserably in protecting rivers that they seem to worship so publicly.

We need to understand and appreciate the meaning and value of a healthy, flowing and giving river. Is river only a channel supplying drinking water? Is it only an irrigation canal? Is it only a powerhouse of electricity? Is it only an open drain to transport our sewage and effluents? Is it only an abstract religious idea in which we wash our sins?

What is the worth of a flowing river for us and the decision makers?

We do need every excuse to celebrate, nurture and contemplate our rivers. We need to take time and think more deeply about our connected future.

Last sunday of Sepetmeber has been celebrated as World Rivers Day by a small province in Canada since the past 33 years. Down the years, many countries, organisations and groups have joined in and this year, World Rivrs Day is being celebrated in over 60 countries across the world. (http://worldriversday.com/) Link to SANDRPs Note on World Rivers Day last year: https://sandrp.in/rivers/World_Rivers_Day_PR_Sept_30_2012.pdf

On this occassion, we look at some of our most spectacular, generous and threatened rivers and hope that the coming year will give us more reasons to celebrate our rivers!

Mighty Ganga at Rishikesh Photo: Himanshu Thakkar, SANDRP
Ganga, completely dry downstream Bhimgouda Barrage, Haridwar Photo: Parineeta, SANDRP

DevPrayag, confluence of Alaknanda and Bhagirathi Rivers, forming Ganga, threatened by Kotlibhel dam projects. Photo: trekearth.com

DevPrayag, confluence of Alaknanda and Bhagirathi Rivers, forming Ganga, threatened by Kotlibhel dam projects. Photo: trekearth.com
The beautiful Baspa River, a tributary of Satluj in himachal Pradesh. A river renowned for its scenic beauty and spectacular fish. now thretened by 300 MW Baspa II Hydel Project, without fish ladders or passes. Photo: Debashsih Dey
The beautiful Baspa River, a tributary of Satluj in Himachal Pradesh. A river renowned for its scenic beauty and spectacular fish. Now threatened by 300 MW Baspa II Hydel Project, without fish ladders or passes. Photo: Debashsih Dey
The beautiful Nyamjangchu River, Tawang, Arunachal Pradesh, now threatened by the 780 MW Nyamjangchu Hydel Project. Photo courtesy: Tenzing Rab Monpa
Breathtaking floodplains of the Lohit River, an important tributary of the Brahmaputra, threatened by the 1750 MW Lower Demwe Dam.  Photo: Neeraj Vagholikar
Breathtaking floodplains of the Lohit River, an important tributary of the Brahmaputra, threatened by the 1750 MW Lower Demwe Dam.
Photo: Neeraj Vagholikar

The Brahmaputra during monsoon in Matmora, Dhakukhana Sub-division, Lakhimpur District, Assam.  Photo – Parag Jyoti Saikia, SANDRP

The Brahmaputra during monsoon in Matmora, Dhakukhana Sub-division, Lakhimpur District, Assam.
Photo – Parag Jyoti Saikia, SANDRP

A woman weaving below a ‘Chang ghar’, a house made on an elevated platform. People from Mishing ethnic community live on chang ghars which is traditional way coping with floods. This photo taken in Matmora area of Dhakukhana subdivision also shows the backwaters of the river Brahmaputra. Photo – Parag Jyoti Saikia, SANDRP


Railway track washed away in the flash floods of Gai River I Dhemaji district of Assam of 15th August 2011.  Photo – Parag Jyoti Saikia, SANDRP
Railway track washed away in the flash floods of Gai River in Dhemaji district of Assam of 15th August 2011.
Photo – Parag Jyoti Saikia, SANDRP 


Fish, preserved in nets along Brahmaputra. Photo: Himanshu Thakkar, SANDRP
Fish, preserved in nets along the mighty Brahmaputra. Photo: Himanshu Thakkar, SANDRP

Gundia River and surrounding forests threatened by the 200 MW Gundia Dam and Yettinahole Diversion Photo: SANDRP

Gundia River and surrounding forests threatened by the 200 MW Gundia Dam and Yettinahole Diversion Photo: SANDRP

Estuary of the free flowing Shashtri River in Maharashtra
Estuary of the free flowing Shashtri River in Maharashtra, one of teh last remaining free flowing rivers of the country Photo: SANDRP
Seetha Nadi, free flowing river in Karnataka Western Ghats. Photo: SANDRP
Fishing in Vashishthi Estuary, Western Ghats. Photo: SANDRP
The beautiful Cauvery, shackeled in many small hydel projects at the gaganchukki falls, Karnataka. Photo: SANDRP
The lovely bharachukki falls on Cuavery, also shackeled by many mini hydel projects. Photo: SANDRP
Estuary of the Karli River in Western Ghats. Photo SANDRP
Thinking like a River at Athirappilly Falls on Chalakudy River, threatned by 164 MW Athirappilly Hydel Project Photo: SANDRP
Celebrating RIvers!! The Kumaradhara in Karnataka, near site for Kukke Stage II Mini Hydel Proejct Photo: SANDRP
Dams · Kerala

Public Pressure Leads to Changes in Kerala Dam Operation

Kerala Govt Agrees to Change Operation of Chalakudy River Hydropower Project:

Public Pressure Leads to Changes in Dam Operation

The decision to increase off-peak generation at Poringalkuthu Left Bank Hydro Electric Project (PLB HEP) in Chalakudy River, taken at a meeting convened by the Hon Chief Minister of Kerala in the fourth week of April (PRD – Thrissur, 25-04-13) was a partial success to the sustained campaign for dams re-operation at Chalakudy river. The meeting was attended by the Ministers for water resource and power, River Basin MLAs and officials of state electricity board and irrigation department. The decision however falls short of the demand for reverting the operation of PLB HEP into base load.

Chalakudy River Basin Physical Map

Normaly the summer water availability in the river below Poringalkuthu HEP should be between 1.3 – 1.5 MCM / day. The failure of both monsoons in 2012 and violation of Kerala-Tamil Nadu interstate Parambikulam – Aliyar agreement (1970) condition that the Kerala Sholayar reservoir shall be kept at full reservoir level by Tamil Nadu on the 1st of February every year (Sch. II.3 – PAP Capture 1Agreement), reduced the water availability in 2013 summer to less than 1 MCM per day resulting in severe water stress in the river basin. On top of the water shortage, intra-day as well as inter-day flow fluctuations in tail-race discharge from PLB HEP had worsened the situation. Anticipating water shortage the river basin MLAs as well as Local Self Government (LSG) heads had been demanding action from the State Government since December 2012.

Background: The river – dams and flow regime Chalakudypuzha (ChalakudyRiver), the fifth largest river in Kerala with a length of 144 kms and catchment area of 1704 Sq.kms is one of the heavily utilised rivers in the state. Major tributaries of this west flowing river originate from the Anamalai hills, Parambikulam Plateau and Nelliyampathy hills of Southern Western Ghats. The river/ its tributaries have been dammed at six places. The dams and diversions have completely altered the natural hydrological regime in the river. The river is the life line of about 30 Local Self Governments (LSGs) and about ten lakh people. Apart from the dams and diversion structures, numerous drinking water schemes and lift irrigation schemes are also dependent on the river. The table below provides details of existing major projects on the river.

Existing dams/ diversions in Chalakudypuzha

Sl. No. Project Commissioning Year Purpose Storage MCM Developer
1 Poringalkuthu LB HEP 1957 Hydro Power 32 Kerala SEB
2 Thunakadavu (PAP)* 1965 Diversion 15.77 Tamilnadu
3 Kerala Sholayar (PAP) 1966 Hydro Power 153.49 Kerala SEB
4 Parambikulam (PAP) 1967 Diversion 504.66 Tamilnadu
5 Peruarippallam (PAP) 1971 Diversion 17.56 Tamilnadu
6 TN Sholayar (PAP) 1971 Hydropower + diversion 152.7 Tamilnadu
7 ChalakudyRiver Diversion Scheme 1959 ** Irrigation 0,218 Kerala-Irri Dept
8 Idamalayar Augmentation Scheme 1990s Diversion NA Kerala SEB

*PAP- Parambikulam Aliyar Project    **Partially operational since 1952

Almost 75 percent of the catchments of the ChalakudyRiver were forested at the turn of 20th century. Hence the river had a fairly Capture 2
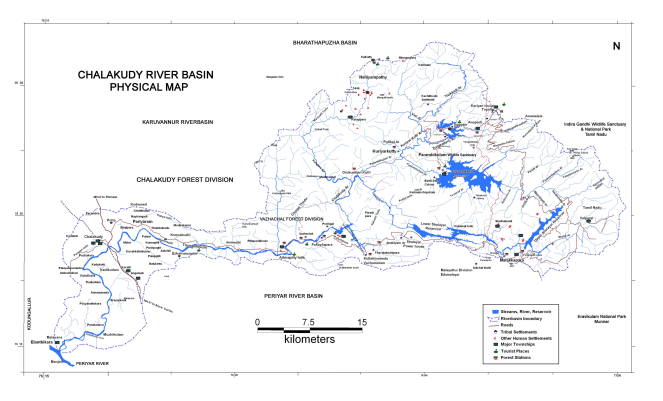
healthy flow even during summer months. However, at present, the natural summer flow in the river has reduced drastically due to forest degradation and dams and diversions. Consequently, the present river flow in non-monsoon months is almost entirely dependent on the storage at Kerala Sholayar and Poringalkuthu reservoirs. The downstream major irrigation project, the Chalakudy River Diversion Scheme (CRDS) does not have storage of its own. It is completely dependent on the tailrace discharge from the PLB – HEP. Over the last two decades, the daily flow fluctuation due to the semi-peaking operation of the PLB-HEP is affecting the functioning of CRDS. Incidentally, the campaign against the proposed Athirappilly hydroelectric project (AHEP) had first brought this issue into focus. One of the major issues with regards to AHEP, a peaking power station, was the downstream impacts of drastic intra-day flow fluctuation (to the tune of 1:17).

Incidentally, Western Ghats Ecology Expert Panel had recommended not to give clearance to the project after conducting field visits and detailed and transparent consultations. However, the High Level Working Group formed to look into the WGEEP report acted in a non-transparent manner. They conducted a field visit with the project proponent (The Kerala State Electricity Board – KSEB), without informing the public, press or the Grama Panchayath and not providing opportunity for the organisations opposing the project to present their case before the committee. The HLWG recommended that the project proponent can approach the Ministry of Environment and Forest (MoEF) for fresh clearance, if it so desired, after some studies despite identifying the project location as ecologically sensitive area.

Analysis of hydrological data for AHEP as well as debates on the issue revealed the existing flow fluctuations due to changed operation pattern of PLB HEP since early 1990s. As the capacity of the PLB HEP was enhanced from 32 MW (8 MW X 4) to 48 MW with the commissioning of a 16 MW generator in 1999, the peak generation and the resultant flow fluctuation increased. The field assessment in the CRDS command area had confirmed the impacts due to the flow fluctuations.

As part of an action research done by the Kerala State Centre of Forum for Policy Dialogue on Water Conflicts in India, an attempt was made to find possible solutions to the conflict of interest between power generation and downstream needs. The conflict between CRDS and other downstream uses due to total diversion of water at its head works at Thumboormuzhi was also taken up. An alternate reservoir operations management (ROM) strategy that aims at sustainable and equitable sharing of available water resources was prepared as part of the study. Capture 3

ROM strategy for Chalakudy River The ROM strategy tried to synchronise the operations of Kerala Sholayar and PLB HEPs with the downstream requirements. Secondary data regarding the river flow, rainfall etc. was collected from concerned agencies like KSEB, Water Resources Department etc. Issues with respect to the present flow regime were assessed through field surveys and stakeholder consultations.  After analysing the available data and assessing downstream irrigation needs through people’s perception and based on the suggestions/ comments by the experts, the draft reservoir operations strategy was prepared. ROM strategy is attempted for water available to the basin after diversions to Tamil Nadu and Idamalayar with focus for non-monsoon months.

In the proposed ROM strategy, the summer water availability for the downstream needs is suggested to be increased through modifications in the operation pattern of Kerala Sholayar and Poringalkuthu HEPs. At Kerala Sholayar, the total utilisable quantity of water is fixed as per the PAP agreement. The monsoon discharge is proposed to be reduced by about 15 % of the average flow (data period – 1979 to 2006) so that the non-monsoon water availability can be enhanced. At Poringalkuthu, the ROM strategy proposes that the water level in the reservoir shall be kept at close to the full reservoir level up to the end of January. The change in the operation of the two HEPs is expected to ensure water availability of not less than 1.5 MCM/ day for the downstream uses. The ROM strategy proposes to operate the Poringalkuthu HEP, the lower dam, that discharges water into the main river as a base load station (as it was operated before 1990s) in non-monsoon months. This can ensure a steady discharge of over 17 m3/sec.

Peringal Dam Photo: CPSS
Peringal Dam
Photo: CPSS

At present the entire flow reaching Thumboormuzhi weir, the head works of CRDS is being diverted to the canals, except for some overflow during peak hours. This is affecting the downstream areas including the ecological functions of the river. The ROM strategy proposes a minimum flow of not less than 2 m3/sec to be released from Thumboormuzhi weir in to the river. This may be increased later after improvement in natural summer river flow through eco-regeneration of the upper catchments and by reducing the irrigation demand through adoption of ‘more crop per drop’ approach in the CRDS command.

The revised operation pattern is not expected to have significant impact on the power front. The non-monsoon power generation from the river basin is expected to slightly increase, whereas, the peak power generation will be reduced by 8 MW to 16 MW, which is about 0.25-0.5 % of the present summer peak demand of Kerala of about 3400 MW.

Building public awareness and public pressure The ROM strategy was widely discussed with the LSGs and other stakeholders. As the LSGs, farmers and Irrigation and Agriculture departments were active partners in the action research (2008 – 2012) they Capture 4readily accepted the proposed ROM strategy. Many LSGs demanded the state government to implement this, through resolutions. With the shortage in rainfall during 2012 monsoons, severe water stress was anticipated and a series of steps were taken to put pressure on the state government for dams re-operation so that the summer water shortage for downstream areas can be reduced.

  • A meeting of the LSG representatives organised by Chalakudy Puzha Samrakshana Samithi (CPSS) before the start of irrigation season discussed the anticipated scenario for the 2012-13 season and decided to step up campaign for changing the operation pattern at PLB HEP.
  • The project advisory committee meeting of CRDS, in December 2012 also took a similar decision.
  • In December 2012, five MLAs of the ChalakudyRiver basin, cutting across party lines, jointly demanded the Chief Minister to convene a meeting of the concerned ministers, MLAs, LSG heads and officials to discuss the issues with regards to the summer water availability in the river basin. This was the result of a series of interactions with these MLAs by the CPSS team.
  • In the second week of January 2013, 25 LSG heads gave a submission to the CM demanding action by the government to ensure water availability at Kerala Sholayar as per the PAP agreement and changing the Poringalkuthu HEP to base load station.
  • Even as no action was taken by the state government and the situation was becoming grim, the project advisory committee meeting of CRDS decided that a delegation must go to Thiruvananthapuram and meet the CM and other concerned ministers. A meeting of LSG heads organised jointly by CPSS and Chalakudy basin Block Panchayaths also decided to take necessary actions.
  • On March 19th 2013,   four MLAs and 10 LSG heads from ChalakudyRiver basin met the Chief Minister and Minister for Water Resources. Rajaneesh from CPSS was also part of the team. The people’s representatives wanted the Govt to take necessary steps to ensure better water availability for Chalakudy basin. The main points raised were regarding violation of Parambikulam – Aliyar Agreement condition and ensuring steady flow from Poringalkuthu HEP for the downstream needs. The CM agreed to convene a meeting of all concerned immediately. However, the meeting was delayed by more than one month and when the meeting finally took place, the LSG representatives were not invited for the same.
  • Meanwhile a detailed discussion was held with the KSEB Chairman in the first week of April 2013. The Chairman promised to look into the issue.
  • All along the campaign, the print as well as visual media reported these developments and published / telecast stories on the issue.

Partial re-operation The daily average generation at Poringalkuthu in January 2013 was 0.4481 MU (Million Units, as per Kerala State Load Despatch Centre website) and the corresponding discharge was about 1.2 MCM per day. Due to the non-compliance of PAP agreement condition, the combined storage at Kerala Sholayar and Poringalkuthu reservoirs on the 1st February was only around 115 MCM against an anticipated volume of 160 -170 MCM. Consequently, the generation was less in the following months. The average generation and discharge in February, March and April were 0.3457 MU / 0.93 MCM, 0.3237MU / 0.87 MCM and 0.3343 MU / 0.9 MCM respectively. The semi-peaking operation at PLB HEP continued resulting in intra-day fluctuations. The off-peak generation was mostly limited to 8 MW with a corresponding discharge of around 6.5 m3/sec, which is highly insufficient to meet the irrigation demand of the CRDS command. There were also instances of practically no generation during off-peak hours, especially during night times.

Upper Sholayar Dam Photo: CPSS
Upper Sholayar Dam
Photo: CPSS

Apart from the intra-day fluctuation the inter-day flow fluctuations was also a major cause of worry. The situation was particularly bad in the second half of March and first half of April. On 4 days between March 21st and April 10th, the generation was between 0.158 MU and 0.182 MU. The corresponding discharge was less than 0.5 MCM. On a few other days, the generation was between 0.2 -0.3 MU.

Since the decision of the meeting convened by the CM, the situation has slightly improved. The inter-day fluctuation was less since 25th of April with the discharge of 0.9 -1 MCM on most days. More importantly, the off-peak generation was at least 16 MW (except on a couple of days). The average discharge since the last week of April has also slightly increased in comparison to the previous months.

The change in operation pattern does not seem to have had any negative impact on power front. Initially the KSEB had increased off-peak generation without reducing peak generation. The generation figures as per the SLDC website shows the generation at PLB HEP on 25th, 26th and 27th April (after the decision at Ministry level meeting) as 0.425 MU, 0.402 MU and 0.412 MU respectively, corresponding to discharge of around 1.1 MCM. Later only one machine was available and the peak as well as total generation reduced.  The average generation during this period was around 0.35 MU corresponding to a discharge of about 0.95 MCM. The generation figure shows that the station was running continuously as a base load station (by default?) for two weeks. Even though the rate of discharge was less than the actual requirement, we have requested the irrigation officials to assess the effect of steady inflow at CRDS.

The decision for increasing off-peak generation is significant since it is acknowledgement by the government that the downstream requirement should be given priority over power generation. However, the long delay in taking such a decision even after the river basin MLAs and LSG heads unanimously demanded for the same cannot be justified. Also, the steps taken so far are not sufficient. The storage position as on 27-04-2013 at Kerala Sholayar and Poringalkuthu reservoirs (33.78 MCM and 9.23 MCM respectively) could have supported a daily discharge of upto 1.3 MCM till May 31st, especially since the catchments traditionally get good pre-monsoon rains and an inflow of 100 cusecs from Tamil Nadu Sholayar was anticipated, on the basis of inter-ministerial discussion on PAP agreement.

The campaign / advocacy for further changes in operation will have to be continued as the present decision is of a temporary nature. Until and unless the non-monsoon discharge from Poringalkuthu HEP is enhanced to around 17 m3/ sec, sufficient river discharge from CRDS head works is not likely to materialise. (The suggested discharge rate from Poringalkuthu HEP as per the ROM strategy, based on anticipated water availability, is 17.25 m3/ sec and the corresponding generation will be 24 MW.) The fact that the Chalakudy MLA protested against closing down all generators of old powerhouse together since May 7th shows that the people’s representatives are now more vigilant on the issue and this should help in stepping up the campaign. Moreover, a collective of Local Self Government heads is emerging for the cause of the river and this collective, if it becomes active, can really help take forward the efforts for the revival of ChalakudyRiver.

S P Ravi (cholayar@rediffmail.com)

Dams · Hydropower · Uttarakhand

Uttarakhand Floods of June 2013: Curtain Raiser on the Events at NHPC’s 280 MW Dhauliganga HEP

box 2
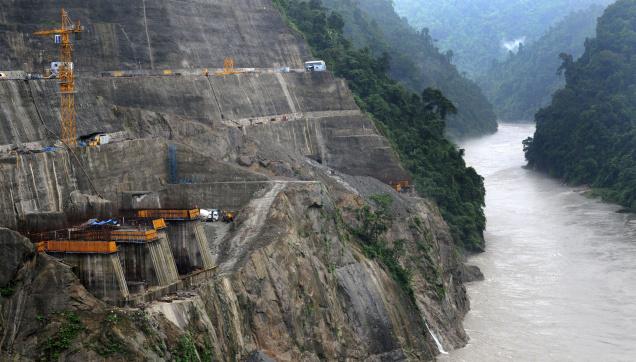
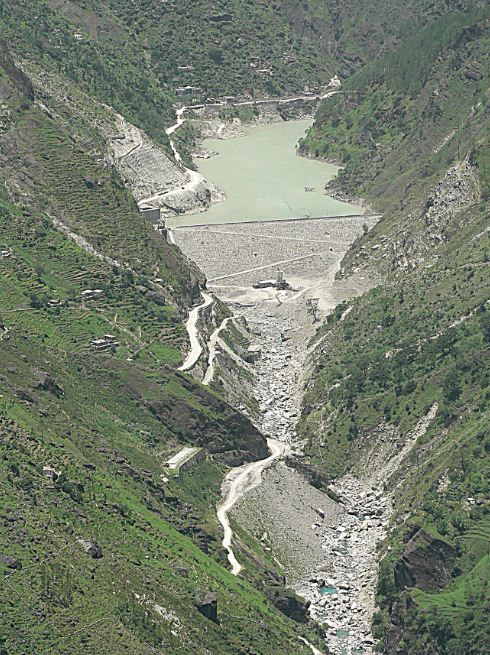
Days after walking down the Gori, we go to the Sub-Divisional Magistrate of Dharchula sub-division, Pramod Kumar, who is busy coordinating rescue and relief on a war-footing, but still has the courtesy to meet. On being asked by me regarding the sudden release of water by the 280 MW National Hydro-Power Corporation (NHPC) Dhauliganga Hydro-Electric Project (HEP, see below the layout of the project given on NHPC website) at Chirkila and the ensuing damage downstream, he confirms that he received an emergency call on the night of 16th June, 2013 from the NHPC, asking that they be permitted to release the impounded water in their reservoir, because it was in danger of breaching. Under normal circumstances they do not need his permission. He also confirms that he had refused, because the water level in the Mahakali main-stem was already flowing at danger-mark. NHPC went right ahead and opened their gates at full on the night of 16th June, without authorization or any prior warning to anybody[1] but their own office-residence complex 20 km downstream, at Dobat.

Map of Dhauliganga Dam Source: NHPC
Map of Dhauliganga Dam
Source: NHPC

Was this really an emergency, or was this purely opportunistic on the part of NHPC to take this opportunity early in the season to flush their reservoir that had been filled almost to half with bed-load and silt? We went looking for clues and information. I went to the NHPC office complex at Dobat, and met Bhuvan Chand Joshi, their Public Relations Officer. After giving me the spiel on how safe, and how green this so called run-of-the-river (ROR) project was, constructed by no less than the Japanese, the Germans and the Koreans put together[2], he admitted that their underground power-station was entirely flooded. Housed in a gigantic underground cavern about 100 meters long, four-storeys high at 40 meters and about 16 meters wide, river water had filled it right upto the control-room on the fourth floor. I had already been told by Kesar Singh Dhami, taxi owner of Dharchula, that on the 16th June itself, when he was ferrying the first batch of Kailash yatris to the road-head on their way up to Tibet, he had noticed the reservoir was filled high already with flood-waters, with large uprooted trees and other woody debris floating at the damsite. He confirms that water was being released, but only a small release, despite the dam being fuller than he had ever seen it.

I was also told by another employee of NHPC (who did not wish to be named) that what had gone wrong was that despite the high flows on the 15th and 16th June, the power-station continued with production of electricity as usual. In what seems to be an unbelievably short-sighted and poor design, the Tail-race Tunnel, from where water is released back into the river after having turned the turbines, is flushed into a tributary stream, the Ellagad. It was when Ellagad also pulsed, that it sent a train of bed-load debris down its lower reaches, effectively blocking the exit of the Tail-race Tunnel coming out of the powerhouse. The power house continued to take in water from the Head-race Tunnel intake to work their turbines, unaware that the exit for water had been blocked. It is only when the water blocked in the Tail-race Tunnel surged back up, burst through the turbine units and began flooding the powerhouse, that NHPC even know that something was wrong. It was then that the massive curved steel gates of the intake were slid shut, and the powerhouse evacuated. This was further confirmed by Joshi, PRO, who also said that the ‘matter was under investigation’ by their own team for organizational detail. The General Manager and the Chief Engineer of the Dhauliganga HEP had meanwhile been transferred out. It is not clear yet how soon after the powerhouse was flooded, that they opened the sluice gates at the bottom of the reservoir. Draining it was clearly beneficial for NHPC, but catastrophic for roads, bridges and habitations downstream, both in India and Nepal.

Dhauliganga before the disaster, with zero water flow downstream from the dam, killing a perennial river. Source: Author

If you look closely enough, there are two separate events here. The flooding of the powerhouse, and the ’emergency’ release of reservoir water. The powerhouse was not flooded because of too much water in the reservoir, but because it was in operation when its tail-race exit seven km downstream, is blocked-off because of poor short-sighted design[3]. They are then forced to close the gates of the intake, and abandon the powerhouse where water has reached the control-room on the fourth floor. The intake gates are now shut, but the flood waters continue to fill the reservoir further. They have already allowed the dam fill to a very high level, and here is the other curious factor.

The design of the Dhauliganga dam, is such that the dam has no provision for water to ‘overflow’ the dam safely, should undesired (even if foreseeable) levels be reached as they did this year. Or say if giant boulders block the narrow sluice gates at the bottom of the reservoir. Or in the real-time situation of what actually happened this year, the blocking of the tail-race tunnel leading to flooding of the powerhouse, hence requiring the shutting off of the intake, and losing the option of reducing reservoir levels more gradually and safely through two simultaneous releases. They then open the flood-gates. Clearly, one of two things have led to this decision:

One, letting the reservoir fill to a very high level is not out of the ordinary for NHPC; they do it every monsoon, as they had done on 16th June as well. It is not for many months in the year that they have enough water to run all four turbines. Despite the run-of-the-river label, Joshi confirmed that they were unable to let any water to continue to flow un-diverted in the river-channel during the winter-spring months (we have photographic evidence of this as well), or they would not have water to turn even one turbine! The mandatory requirement that every hydro-power dam in Uttarakhand be required to release at least 10% of the river’s minimum flows at all times (as greatly insufficient as such a small flow is for downstream life), it seems neither a consideration while justifying the economics of such projects, and neither is it complied to here. The use of the term run-of-the-river here, is plain deception.

The Dhauliganga Hydro-power dam, after being flushed of bed-load sediment Source: Author
The Dhauliganga Hydro-power dam, after being flushed of bed-load sediment
Source: Author

Their regular annual schedule for flushing the reservoir of bed-load and sediment is normally the 15th of July and the 31st of July every year. Here again, when the reservoir is full, and there is enough water to provide the pressure for increased and accelerated flow to flush the reservoir on a twice-annual basis. Both flushing schedules follow each other closely at peak-flow season, so that the flushing is as complete as possible, and there is enough of a monsoon season ahead to fill the reservoir up again before the winter-lean. The probable reason for preponing the flushing could be the chance of flushing some of the unusually high accumulation of bed-load debris that had come down in this years flood. What this meant to the efficiency of the power-station is one thing, but what it means to all life in and along the river, is quite another.

Two, that the faulty design of the dam, both in location of its tail-race exit as well as no provision for over-topping, in combination with the carelessness of allowing the reservoir to fill to such levels at the start of the monsoon, was responsible for the ’emergency’ catastrophic release.

Stitched photo of the bed of the drained Dhauliganga reservoir  Source: Author
Stitched photo of the bed of the drained Dhauliganga reservoir
Source: Author

The Dhauliganga HEP is located on the Darmayangti river, re-christened the Dhauliganga  river, just a couple of kilometers upstream of the confluence with the Mahakali at Tawaghat. In these two kilometers, the rivers flows (twice a year when it is allowed to, for a few hours) down steeply to the confluence which it meets at right-angles. With the Mahakali already in spate, coupled with the sudden release of more than 6 million cubic meters of stored water (Gross Storage Capacity), plus the flow of the river in flood (steadily increasing from 398 cubic meters a second on 15th June), as well as millions of tonnes of bed-load boulders and sediment, the damage downstream is clear to see. If you look at the fresh scour-level on the banks downstream of the dam, it is in places more than 15 meters higher than the flood-level flow of the DhauliRiver. The river added thousands of tonnes of even more debris when, because of the flood level it reached, it tore through, plucking high at the talus-cones on either bank, and at every turn. At the confluence at Tawaghat, there must have been something of a back-flood for some time (a common flood phenomenon where the high-flowing main-stem creates a temporary water-dam), because the water-level seems to have risen very high, taking away the bridge that connects the entire Kuti valley and the trade route to Tibet,   tearing away almost the entire village-market complex at Tawaghat, and destroying the road as well. The flood waters had clearly reached the top of the road because of the deposition of river-sand on it. When I walked this section days later, the river was only less than a meter below danger mark. Even so, it was flowing about 12 meters below the road! Further downstream, the destruction was more serious.

In order to understand the magnitude of this flood event, I ask Joshi of NHPC for flow-data of the Dhauli river between the 12th and the 18th of June. He goes off for some time and returns with a sheet of paper that has hand-scrawled 6 hourly flow volumes from 12th June, but stops short at 15th June. All the flow volumes between the 12th and the 15th were below 150 cubic meters a box 1
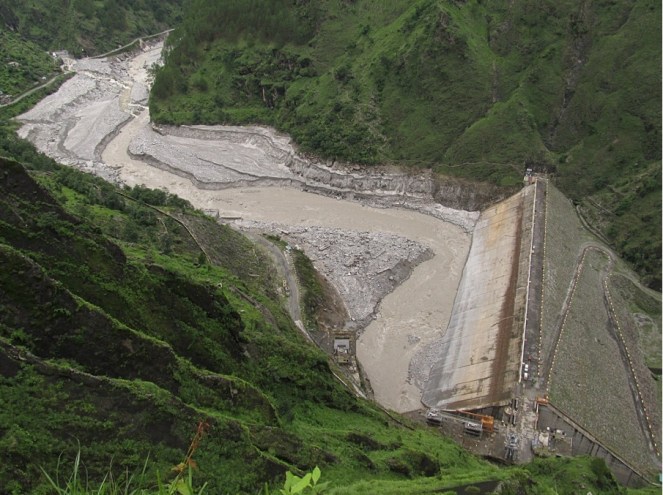
second (cumecs), and at 12 am, on the night of the 15th June it jumps up to 389.92 cumecs. This is just the start of the flood. Joshi seems to balk right here, and says that they have not received data for the 16th June yet (the day I speak to him was the 8th of July), and that he may get it after a week or so. And anyway, he says, the powerhouse was abandoned from the night of the 16thJune, so getting data beyond that would be out of question. It is clear that Joshi was unwilling to give me flow-data for the duration of the flood-pulse. He had only minutes before informed me of how automated the whole operation was, and that it was possible for them to even operate the power-house sitting in their Dobat office-complex itself. The real scenario will be clear when we get flow data for the 16th and 17th of June.

According to NHPC, the Peak Flood Design for the Dhauliganga HEP is 3,210 cumecs, at a return interval of 100 years. That is the flow volumes that the dam is designed to be able to take without damage, at flood levels expected at least every hundred years. It is unlikely that flow volumes had reached almost 10 times the flow volumes of the flood on the 15th June at the damsite (389.92 cumecs). NHPC gets its flow data from an automated level-gauge at the reservoir, so it did not require anyone to take readings manually, even prior to abandoning the station. If unprecedented levels had indeed been reached, then why had they held on to water in the reservoir right till the night of the 16th June?  Please see the accompanying photographs, of the dam reservoir, empty of water. You can see at least two levels of cut-away terraces. The lower ones are alluvial terraces, consisting clearly of coarser gravels and cobbles deposited by the flowing river. The higher terraces, more visible high on the upper true-left bank in the photo, are remnant lacustrine (lake-bed) terraces, consisting of finer silts and sand, deposited by the stilled waters in the reservoir when it was full. This was the highest point of sediment accumulation in the reservoir prior to being flushed out. Clearly, at least 45% the reservoir was full of debris and sediment before NHPC flushed it. And if you look at the brown line on the concrete face of the dam, you see the level that the reservoir was allowed to fill upto, marked by the ‘bath-tub ring’ of floating bark and woody debris stuck there after draining.

Joshi tells me that when a delegation of people from Nepal came to NHPC to talk about the possible role that NHPC’s sudden release of water might have had on the flood that devastated Khalanga bazar at Darchula, he had told them that to the contrary, the dam had saved Nepal from great damage. “See how much debris is still behind our reservoir!” This was bare-faced misinformation. There are two aspects being denied here. One, that great masses of debris were actually flushed out from the lower-end of the reservoir on the night of 16th June, leading to greatly increased flood levels as well as erosive potential downstream, especially on the Nepal bank at Darchula, which bore the brunt of flushed debris centrifuged on the curve. As is evident from the photo of the dam-site above, most of the debris that has been flushed, is from the front-end of the reservoir only. And two, that all dams and reservoirs, despite some being able to flush out debris from a section of the reservoir, do actually hold back a great deal of bed-load as well as suspended sediment in the upper end of the reservoir. They impede the very essential flow of sediment down to the oceans. Look now at the geometry of bed-load debris in the stitched photo. Distortions from the wide-angle lens apart, it clearly shows a gradual slope, and a filling up of the bed-rock channel to form a wide, sloping flood-plain. Had it not been for the dam, the bed-load would have continued to fill up the bed-rock channel downstream at about the same angle, slowing the entire flow of water and entrained debris. It would not have been washed down catastrophically all the way down to Darchula, without the force of an additional 6 million m³ of stored water released suddenly.

Emmanuel Theophilus (etheophilus@gmail.com)


[1]    NHPC never gives warning of sudden releases. There is a notice painted on a board at Tawaghat, the first river-side habitation downstream, that warns people not to go anywhere near the river, because water may be released anytime.

[2]    Kajima Construction Corporation Ltd of Japan, Daewoo Engineering and Construction Company of Korea, and Bauer Maschinen of Germany.

[3]    How a tail-race exit could be planned on the Ellagad stream which is very steep and unstable, full of debris from a service tunnel, and highly ‘flashy’, is indicative of poor design and of lax design approval mechanisms.

Arunachal Pradesh · Environment Impact Assessment · Expert Appraisal Committee · Hydropower

Subansiri Basin Study – Another Chapter of Environment Subversion in Northeast

The Study The study has been done by IRG Systems South Asia Private Limited (http://www.irgssa.com/, a subsidiary of US based IRG Systems) and http://www.eqmsindia.com/[i]. It is supposed to be a Cumulative Impact Assessment of 19 HEPs planned in the basin, out of which PFRs of 7 are available, DPR of two, and one of which, the 2000 MW Subansiri Lower HEP is under construction.

Subversion of Environment Governance in the Subansiri basin While looking at this basin study, the subversion of environment governance in Subansiri basin this very millennia should be kept in mind. A glimpse of it is provided in Annexure 1. In fact, one of the key conditions of environmental clearance to the 2000 MW Lower Subansiri HEP was that no more projects will be taken up in the basin upstream of the Lower Subansiri HEP, which essentially would mean no more projects in the basin, since LSHEP is close to the confluence of the Subansiri River with Brahmaputra River. That condition was also part of the Supreme Court order in 2004. The need for a carrying capacity study was also stressed in the National Board of Wild Life discussions. We still do not have one. In a sense, the Subansiri basin is seeing the consequences of that subversion.

Map of Subansiri RIver Basin  Source: https://sandrp.in/basin_maps/Subansiri_River_Basin.pdf
Map of Subansiri RIver Basin
Source: https://sandrp.in/basin_maps/Subansiri_River_Basin.pdf

Information in public domain not known to consultants The report does not even state that Middle Subansiri dam have also been recommended TOR in 41st EAC meeting in Sept 2010. This project will require 3180 ha of land, including 1333 Ha forest land, and 2867 ha area under submergence. Even about Upper Subansiri, the consultants do not know the area of forest land required (2170 ha). So the consultants have not used even the information available in public domain in EAC meetings.

Study based on flawed and incomplete Lohit Basin Study The Study claims that it is based on Lohit Basin Study done by WAPCOS. Lohit Basin Study is an extremely flawed attempt and does not assess cumulative impacts of the cascade projects. Civil society has written about this to the EAC and the EAC itself has considered the study twice (53rd and 65th EAC Meetings), and has not accepted the study, but has raised several doubts. Any study based on a flawed model like Lohit Basin Study should not be acceptable.

A house in the upstream of Subansiri River  Source: http://cooperfreeman.blogspot.in/2012/12/the-wild-east-epic.html
A house in the upstream of Subansiri River
Source: http://cooperfreeman.blogspot.in/2012/12/the-wild-east-epic.html

No mention of Social impacts Major limitation of the study has been absolutely no discussion on the severe social impacts due to cumulative forest felling, flux of population, submergence, livelihoods like riparian farming and fishing, etc. Though this has been pointed out by the TAC in its meeting and field visit, the report does not reflect this.

Some key Impacts Some of the impacts highlighted by the study based on incomplete information about HEPs are:

Þ    The length of the river Subansiri is 375 km up to its outfall in the Brahamaputra River. Approximately 212.51 km total length of Subansiri will be affected due to only 8 of the proposed 19 HEPs in Subansiri River basin.

Þ    Total area brought under submergence for dam and other project requirements is approx. 10, 032 ha of eight proposed HEPs. The extent of loss of forest in rest of the 9 projects is not available.

Þ    62 species belonging to Mammals (out of 105 reported species), 50 Aves (out of 175 reported species) and 2 amphibians (out of 6 reported species) in Subansiri Basin are listed in Schedules of Wildlife Protection Act, 1972 (as amended till date).

Þ    99 species belonging to Mammals (out of 105 reported species), 57 species belonging to Aves (out of 175 reported species), 1 Reptilian (out of 19 reported species), 2 Amphibians (out of 6 reported species), 28 fishes (out of 32 reported species), 25 species belonging to Odonata of Insecta fauna group (out of 28 reported species) are reported to be assessed as per IUCN’s threatened categories.

Even this incomplete and partial list of impacts should give an idea of the massive impacts that are in store for the basin.

Cumulative impacts NOT ASSESSED Specifically, some of the cumulative impacts that the report has not assessed at all or not adequately include:

1. Cumulative impact of blasting of so many tunnels on various aspects as also blasting for other project components.

2. Cumulative impact of mining of various materials required for the projects (sand, boulders, coarse and fine granules, etc.)

3. Cumulative impact of muck dumping into rivers (the normal practice of project developers) and also of also muck dumping done properly, if at all.

Subansiri River in the Upper Reaches  Source: Lovely Arunachal
Subansiri River in the Upper Reaches
Source: Lovely Arunachal

4. Changes in sedimentation at various points within project, at various points within a day, season, year, over the years and cumulatively across the basin and impacts thereof.

5. Cumulative impact on aquatic and terrestrial flora and fauna across the basin due to all the proposed projects.

6. Cumulative impact of the projects on disaster potential in the river basin, due to construction and also operation at various stages, say on landslides, flash floods, etc.

7. Cumulative dam safety issue due to cascade of projects.

8. Cumulative change in flood characteristics of the river due to so many projects.

9. Cumulative impacts due to peaking power generation due to so many projects.

10. Cumulative sociological impact of so many projects on local communities and society.

11. Cumulative impact on hydrological flows, at various points within project, at various points within a day, season, year, over the years and cumulatively across the basin and impacts thereof. This will include impacts on various hydrological elements including springs, tributaries, groundwater aquifers, etc. This will include accessing documents to see what the situation BEFORE project and would be after. The report has failed to do ALL THIS.

12. Impact of silt laden water into the river channel downstream from the dam, and how this gets accumulated across the non-monsoon months and what happens to it. This again needs to be assessed singly and cumulatively for all projects.

13. Impact of release of silt free water into the river downstream from the power house and impact thereof on the geo morphology, erosion, stability of structures etc, singly and cumulatively.

14. Impact on Green House Gas emissions, project wise and cumulatively. No attempt is made for this.

15. Impact of differential water flow downstream from power house in non-monsoon months, with sudden release of heavy flows during peaking/ power generation hours and no releases during other times.

16. Cumulative impact of all the project components (dam, tunnels, blasting, power house, muck dumping, mining, road building, township building, deforestation, transmission lines, etc.,) for a project and then adding for various projects. Same should also be done for the periods during construction, operation and decommissioning phases of the projects.

17. Cumulative impact of deforestation due to various projects.

18. Cumulative impact of non compliance of the environment norms, laws, Environment clearance and forest clearance conditions and environment management plans. Such an assessment should also have analysed the quality of EIA report done for the Subansiri Lower hydropower project.

Wrong, misleading statements in Report There are a very large number of wrong and misleading statements in the report. Below we have given some, along with comment on each of them, this list is only for illustrative purposes.

Sr No

Statement in CIA

Comment

1 “During the monsoon period there will be significant discharge in Brahmaputra River. The peaking discharge of these hydroelectric projects which are quite less in comparison to Brahmaputra discharge will hardly have any impact on Brahmaputra.” This is a misleading statement. It also needs to be assessed what will be the impact on specific stretches of Subansiri river. Secondly, the projects are not likely to operate in peaking mode in monsoon.
2 “However, some impact in form of flow regulation can be expected during the non-monsoon peaking from these projects.” This is not correct statement as the impact of non-monsoon peaking is likely to be of many different kinds, besides “flow regulation” as the document describes.
3 “Further, during the non-monsoon period the peaking discharge release of the projects in upper reaches of Subansiri basin will be utilized by the project at lower reaches of the basin and net peaking discharge from the lower most project of the basin in general will be the governing one for any impact study.” This is again wrong. What about the impact of such peaking on rivers between the projects?
4 “The construction of the proposed cascade development of HEPs in Subansiri basin will reduce water flow, especially during dry months, in the intervening stretch between the Head Race Tunnel (HRT) site and the discharge point of Tail Race Tunnel (TRT).” This statement seems to indicate that the consultants have poor knowledge or understanding of the functioning of the hydropower projects. HRT is not one location, it is a length. So it does not make sense to say “between HRT and the discharge point of TRT”.
5 “For mature fish, upstream migration would not be feasible. This is going to be the major adverse impact of the project. Therefore, provision of fish ladder can be made in the proposed dams.” This is simplistic statement without considering the height of the various dams (124 m high Nalo HEP dam, 237 m high Upper Subansiri HEP dam, 222 m high Middle Subansiri HEP dam), feasibility of fish ladders what can be optimum design, for which fish species, etc.
6 “…water release in lean season for fishes may be kept between 10-15% for migration and sustaining ecological functions except Hiya and Nyepin HEP. Therefore, it is suggested that the minimum 20% water flow in lean season may be maintained at Hiya and Nyepin HEP for fish migration.” This conclusion seems unfounded, the water release suggested is even lower than the minimum norms that EAC of MoEF follows.

Viability not assessed The report concludes: “The next steps include overall assessment of the impacts on account of hydropower development in the basin, which will be described in draft final report.”

One of the key objective of the Cumulative Impact assessment is to assess how many of the planned projects are viable considering the impacts, hydrology, geology, forests, biodiversity, carrying capacity and society. The consultants have not even applied their mind to key objective in this study. They seem to assume that all the proposed projects can and should come up and are all viable. It seems the consultant has not understood the basic objectives of CIA. The least the consultant could have said is that further projects should not be taken up for consideration till all the information is available and full and proper Cumulative impact assessment is done.

The consultants have also not looked at the need for free flowing stretches of rivers between the projects.

Section on Environmental Flows (Chapter 4 and 9): The section on Environmental flows is one of the weakest and most problematic sections of the report, despite the fact that the Executive summary talks about it as being one of the most crucial aspects.

The study does not use any globally accepted methodology for calculating eflows, but uses HEC RAS model, without any justification. The study has not been able to do even a literature review of methodologies of eflows used in India and concludes that “No information/criteria are available for India regarding requirement of minimum flow from various angles such as ecology, environment, human needs such as washing and bathing, fisheries etc.”

This is unacceptable as EAC itself has been recommending Building Block Methodology for calculating eflows which has been used (very faultily, but nonetheless) by basin studies even like Lohit, on which this study is supposedly based. EAC has also been following certain norms about E flow stipulations. CWC itself has said that minimum 20% flow is required in all seasons in all rivers. BK Chaturvedi committee has recently stipulated 50% e-flows in lean season and 30% in monsoon on daily changing basis.

The assumption of the study in its chapter on Environmental Flows that ‘most critical reach is till the time first tributary meets the river” is completely wrong. The study should concentrate at releasing optimum eflows from the barrage, without considering tributary contribution as an excuse.

First step of any robust eflows exercise is to set objectives. But the study does not even refer to this and generates huge tables for water depths, flow velocity, etc., for releases ranging from 10% lean season flow to 100% lean season flow.

After this extensive analysis without any objective setting, the study, without any justification (the justification for snow trout used is extremely flawed. Trouts migrate twice in a year and when they migrate in post monsoon months, the depth and velocity needed is much higher than the recommended 10% lean season flow) recommends “In view of the above-said modeling results, water release in lean season for fishes maybe kept between 10-15% for migration and sustaining ecological functions except Hiya and Nyepin HEP. Therefore, it is suggested that the minimum 20-25% water flow in lean season may be maintained at all HEP for fish migration and ecological balance.”

The study does not recommend any monsoon flows. Neither does it study impact of hydro peaking on downstream ecosystems.

Shockingly, the study does not even stick with this 20-25% lean season flow recommendation (20-25% of what? Average lean season flow? Three consecutive leanest months? The study does not explain this). In fact in Chapter 9 on Environmental Flows, the final recommendation is: “Therefore, it is suggested that the minimum 20-25% water flow in lean season may be maintained at Hiya and Nyepin  HEP or all other locations for fish migration.” (emphasis added)

So it is unclear if the study recommends 20-25% lean season flows or 10-15% lean season flows. This is a very flawed approach to a critical topic like eflows.

The study keeps mentioning ‘minimum flows’ nomenclature, which shows the flawed understanding of the consultants about e-flows.

The entire eflows section has to be reworked, objectives have to be set, methodology like Building Block Methodology has to be used with wide participation, including from Assam. Such exercises have been performed in the past and members of the current EAC like Dr. K.D. Joshi from CIFRI have been a part of this. In this case, EAC cannot accept flawed eflows studies like this. (DR. K D. Joshi has been a part of a study done by WWF to arrive at eflows through BBM methodology for Ganga in Allahabad during Kumbh: Environmental Flows for Kumbh 2013 at Triveni Sangam, Allahabad and has been a co author of this report)

Chocolate Mahseer in Subansiri  Source: http://www.flickr.com/photos/8355947@N05/7501485268/
Chocolate Mahseer in Subansiri
Source: http://www.flickr.com/photos/8355947@N05/7501485268/

Mockery of rich Subansiri Fisheries Subansiri has some of the richest riverine fisheries in India. The river has over 171 fish species, including some species new to science, and forms an important component of livelihood and nutritional security in the downstream stretches in Assam.

But the study makes a mockery of this saying that the livelihoods dependence on fisheries is negligible. The entire Chapter on Fisheries needs to be reworked to include impacts on fisheries in the downstream upto Majuli Islands in Assam at least.

No mention of National Aquatic Animal! Subansiri is one of the only tributaries of Brahmaputra with a resident population of the endangered Gangetic Dolphin, which is also the National aquatic animal of India (Baruah et al, 2012, Grave Danger for the Ganges Dolphin (Platanista ganegtica) in the Subansiri River due to large Hydroelectric Projecthttp://link.springer.com/article/10.1007/s10669-011-9375-0#).

Shockingly, the Basin Study does not even mention Gangetic Dolphin once in the entire study, let alone making recommendations to protect this specie!

Gangetic Dolphin is important not only from the ecological perspective, but also socio cultural perspective. Many fisher folk in Assam co-fish with the Gangetic River Dolphin. These intricate socio ecological links do not find any mention in the Basin study, which is unacceptable.

Agitation Against Lower Subansiri Dam in Assam Source: SANDRP
Agitation Against Lower Subansiri Dam in Assam
Source: SANDRP

Lessons from Lower Subansiri Project not learnt A massive agitation is ongoing in Assam against the under construction 2000 MW Subansiri Lower HEP. The people had to resort to this agitation since the Lower Subansiri HEP was going ahead without studying or resolving basic downstream, flood and safety issues. The work on the project has been stopped since December 2011, for 22 months now. In the meantime several committee have been set up, several changes in the project has been accepted. However, looking at this shoddy CIA, it seems no lessons have been learnt from this ongoing episode. This study does not even acknowledge the reality of this agitation and the issues that the agitation has thrown up. There is no reflection of the issues here in this study that is agitating the people who are stood up against the Lower Subansiri HEP. The same people will also face adverse impacts of the large number of additional projects planned in the Subansiri basin. If the issues raised by these agitating people are not resolved in credible way, the events now unfolding in Assam will continue to plague the other planned projects too.

Conclusion From the above it is clear that this is far from satisfactory report. The report has not done proper cumulative assessment on most aspects. It has not even used information available in public domain on a number of projects. It does not seem to the aware of the history of the environmental mis-governance in the SubansiriBasin as narrated in brief in Annexure 1. For most projects basic information is lacking. Considering the track record of Central Water Commission functioning as lobby FOR big dams, such a study should have never been given to CWC. One of the reasons the study was assigned by the EAC to the Central Water Commission was that the CWC is supposed to have expertise in hydrological issues, and also can take care of the interstate issues. However, the study has NOT been done by CWC, but by consultants hired by CWC, so CWC seems to have no role in this except hiring consultant. So the basic purpose of giving the study to CWC by EAC has not been served. Secondly the choice of consultants done by the CWC seems to be improper. Hence we have a shoddy piece of work. This study cannot be useful as CIA and it may be better for EAC to ask MoEF for a more appropriate body to do such a study. In any case, the current study is not of acceptable quality.

South Asia Network on Dams, Rivers & People (https://sandrp.in/https://sandrp.wordpress.com/)

ANNEXURE 1

Set Conditions to be waived Later – The MoEF way of Environmental Governance

In 2002, the 2,000 MW Lower Subansiri hydroelectric project on the Assam-Arunachal Pradesh border came for approval to the Standing Committee of the Indian Board for Wildlife (now called the National Board for Wildlife) as a part of the Tale Valley Sanctuary in AP was getting submerged in the project. The total area to be impacted was 3,739.9 ha which also included notified reserved forests in Arunachal Pradesh and Assam.  The Standing Committee observed that important wildlife habitats and species well beyond the Tale Valley Sanctuary, both in the upstream and downstream areas, would be affected (e.g. a crucial elephant corridor, Gangetic river dolphins) and that the Environmental Impact Assessment studies were of a very poor quality. However, despite serious objections raised by non-official members including Bittu Sahgal, Editor, Sanctuary, Valmik Thapar, M.K. Ranjitsinh and the BNHS, the Ministry of Environment & Forests (MoEF) bulldozed the clearance through in a May 2003 meeting of the IBWL Standing Committee. Thus a project, which did not deserve to receive clearance, was pushed through with certain stringent conditions imposed (Neeraj Vagholikar, Sanctuary Asia, April 2009).

Lower Subansiri HEP Source: The Hindu
Lower Subansiri Dam
Source: The Hindu

The EC given to the project was challenged in Supreme Court (SC) by Dr L.M Nath, a former member of the Indian Board for Wildlife. Nath pleaded, these pristine rich and dense forests classified as tropical moist evergreen forest, are among the finest in the country. Further the surveys conducted by the Botanical Survey of India and the Zoological Survey of India were found to be extremely poor quality. The Application mentions that the Additional DG of Forests (Wildlife) was of the view that the survey reports of the BSI and ZSI reports were not acceptable to him because these organisations had merely spent five days in the field and produced a report of no significance.

The SC gave its final verdict on 19-4-2004, in which the Court upheld the EC given by MoEF to NHPC but with direction to fulfill some important conditions. Out these conditions there were two conditions which were very significant – “The Reserve Forest area that forms part of the catchment of the Lower Subansri including the reservoir should be declared as a National Park/ Sanctuary. NHPC will provide funds for the survey and demarcation of the same.”, and “There would be no construction of dam upstream of the Subansri River in future.” These conditions were also mentioned in the original EC given to the project in 2003.

In May 2005, two years after the EC was given the Arunachal Pradesh govt and NHPC approached the SC to waive or modify the above two conditions. The state government calimed that following these conditions would imply loss of opportunity to develop 16 mega dams in the upstream of Lower Subansiri (this including 1,600 MW Middle Subansiri and 2,000 MW Upper Subansiri to be developed by NHPC). The SC sent it back to National Board for Wildlife to review the conditions.

The petition was done strategically. “The strategy of the dam proponents is simple. They raised no objection to the terms until the construction of the Lower Subansiri project had proceeded beyond a point when it could have been cancelled. Armed with this fait accompli, they asked for a review of the clauses on the very basis on which the original clearance – laid down by members who were subsequently dropped from the wildlife board – was granted.”[ii]

Then nonofficial members of NBWL expressed their dissent to the proposal. In a May 2008 communication to the Chairman of the NBWL Standing Committee, member Dr. Bibhab Talukdar observed: “If the Standing Committee agrees to waive the conditions, we would be setting a dangerous precedent and sending a wrong signal regarding the credibility of decision-making by us. This would mean that projects impacting rich wildlife habitats can receive clearances based on stringent conditions, only to be up for review later. Such an approach is undesirable both from a perspective of good governance as well as the long-term interest of wildlife in the country.”

Dr. Asad Rahmani of the BNHS, who was part of a sub-committee of the NBWL Standing Committee conducting a site visit to the project area, stated in his report: “Under no circumstances should new projects be allowed in the Subansiri river basin until an advance cumulative assessment of proposed projects and a carrying capacity study of the Subansiri river basin are completed.”

In the December 12 2008 meeting of NBWL Standing Committee, even after these dissenting opinions from nonofficial members MoEF managed to do a dilution of the above two conditions. Assam that time was witnessing a major protest concerning the downstream impacts of Lower Subansiri HEP but it was not even consulted. Shockingly the “no dam upstream” condition was removed and it was decided that “any proposal in the upstream of the SubansiriRiver would be considered independently on its merit by the Standing Committee as and when submitted by the proponents”.

Now the Arunachal Pradesh government needs to declare a smaller area of 168 sq. km. as a sanctuary and “make serious efforts” to bring an additional 332 sq. km. reserved forest under the category of Conservation Reserve (CR) in consultation with the MoEF. The latter part of the condition (declaration of CR) is non-enforceable because of the choice of words. Even the demand to at least conduct an advanced cumulative impact assessment of proposed projects and a carrying capacity study of the Subansiri river basin has been ignored[iii].

As Bittu Sahgal, Editor, Sanctuary Asia says, “The Lower Subansiri is one such, where the PMO has placed a very dubious role in forcing clearances, agreeing to clearance conditions and then starting the project, only to loosen the environmental conditions. In this whole scam the Zoological Survey of India and the Botanical Survey of India have been co-conspirators that have suppressed the ecological value of the forests to facilitate the building of the dam, which will drown pristine elephant, tiger and clouded leopard forests and cause havoc downstream as well.”

The above sequence of events are very pertinent to remember as we see the Subansiri basin study.

END NOTES:


[i] Website says: “More than 200 successful environmental Impact Assessment Clearance from Ministry of Environment & Forests, Government of India for Industry, Infrastructure & Construction projects” Sounds strange from an EIA consultant.

[iii] For more details please see – “Forest Case Update”, Issue 1, June 2004 and “The Subansiri Subversion” by Neeraj Vagholikar published in Sanctuary Asia, April 2009 issue

Climate Change · Uttarakhand

Uttarakhand Rainfall: Since 1901 and in light of the 2013 disaster

During the tragic Uttarakhand disaster, one of the most discussed but the most elusive topics has been rainfall. Uttarakhand, though having experienced frequent extreme weather events, has a poor distribution of rain gauge stations and weather monitoring. The worst hit districts like Rudraprayag, Chamoli and Pithoragarh have especially dismal distribution of monitoring stations, making it impossible for us to understand the intensity of rainfall in places like Kedarnath when the disaster struck. (https://sandrp.wordpress.com/2013/06/21/uttarakhand-deluge-how-human-actions-and-neglect-converted-a-natural-phenomenon-into-a-massive-disaster/)

According to the Indian Meteorological Department (IMD) June 2013 rainfall was over thrice the normal amount between June 1 and 21. The highest figure quoted by IMD was 370 mm a day at Dehradun, which was said to be ‘a record not seen for five decades’. IMD has also said that in the week of 13th to 19th June, the entire state of Uttarakhand received 847% excess rainfall, and that this has no precedent.[1] However, according to experts, this generalisation of a very diverse state does not depict the true picture.

Nonetheless, it is worthwhile to string together whatever data we have on Uttarakhand’s rainfall in order to get a clearer picture of rainfall trends, and also underline the fact that Uttarakhand and all the other Himalayan States need a much denser network on weather monitoring stations, representation all altitudes, river basins & sub-basins and climatic zones. Only then will the data be a useful tool in planning and forecasting.

In this piece, we have tried to analyse rainfall datasets of the hundred years (1901-2000) for some of the worst affected and vulnerable districts of Uttarakhand. This data has been obtained from Indian Meteorological Department. Districts analysed include Uttarkashi, Rudraprayag, Haridwar, Chamoli, Tehri Garhwal, and Pithoragarh.

While we have rainfall data from 1901-2000 (with some gaps), there is a gap in the data during 2000-2008. Then again we have data from 2008-2012 and 2013 till 25th September 2013. (All figures from IMD – India Meteorological Department – http://imd.gov.in/).

What we have attempted here is:

1.     Identification of Top 5 Maximum and Minimum rainfall events in the selected 7 districts in the past 100 years. Comparison of these values with 2013 Maximum monthly rainfall

Interesting to note that the only time when 2013 monthly (approximate, as we have weekly figures from IMD, not monthly ones) features in top 5 monthly rainfall is for Chamoli, in July 2013! 537.9 mm rainfall it received in July 2013 was the second highest recorded rainfall in the district since 1901-2000 and 2008-2013.

2.   100 year monthly monsoonal and annual rainfall for selected 7 districts, 2008-2012 monsoonal and annual rainfall for selected 7 districts.

3. 2013 weekly rainfall collated in respective months for June, July and August for the seven districts.

Results:

1.             Dehradun: 

  • Maximum monthly rainfall in last 100 years during monsoon months (Same for all districts below): 1271 mm in August 1943
  • Minimum rainfall in last 100 years during monsoon months: 20.4 mm in June 1965
  • Maximum rainfall of 2013 compared with the 5 previous maximums: In August 2013 it received 676.7 mm rainfall which was maximum for the district in 2013 monsoon.

However, this did not figure amongst the top 5 values for monsoon rainfall in the period considered.

  • Rainfall during the week 13-06-13 to 19-06-13: 565.4 mm
  • Departure from normal for the same week – 1436%

Dehradun_Reshaped

Deharadun_100_Years

2. Uttarkashi:

  • Maximum rainfall in last 100 years: 800.8 mm in August 1963
  • Minimum rainfall in last 100 years: 36.8 mm in June 1987 
  • Maximum rainfall of 2013 compared with the 5 previous maximums: In 2013, 529.9 mm received in June was the highest for the 2013 monsoon season.

However, this does not feature among the top 5 values for monsoon rainfall in the period considered.

  • Rainfall during the week 13-06-13 to 19-06-13: 375.6 mm
  • Departure from normal for the same week: 1356%

Uttarkashi_ReshapedUttarkashi_100_Years

3. Tehri Garhwal-

  • Maximum rainfall in last 100 years 1097 mm in September 1995
  • Minimum rainfall in last 100 years- 0 mm in September 1997
  • Comparison of 2013 max rainfall with the previous 5 maximum: In 2013, 453.4 mm rainfall received in June was the highest for the 2013 monsoon season.

However, this does not feature among the top 5 values for monsoon rainfall in the period considered.

  • Rainfall during the week 13-06-13 to 19-06-13: 327.7 mm
  • Departure from normal for the same week – 390%Tehri Garhwal_ReshapedTehri Garhwal_100_Years

4. Haridwar-

  • Maximum rainfall in last 100 years: 848.2 mm in September 1924
  • Minimum rainfall in last 100 years: 0 mm in September 1971
  • Maximum rainfall of 2013 compared with the 5 previous maximums: In 2013, 426 mm rainfall received in August was the highest for the 2013 monsoon season.

However, this does not feature among the top 5 values for monsoon rainfall in the period considered.

  • Rainfall during the week 13-06-13 to 19-06-13: 298.8 mm
  • Departure from normal for the same week – 1283%

Hardwar_Reshaped

Hardwar_100_Years

5. Rudraprayag

  • Maximum rainfall in last 100 years 914.6 mm in August 1925
  • Minimum rainfall in last 100 years 0 mm, in September 1971
  • Maximum rainfall of 2013 compared with the 5 previous maximums: In 2013, 664 mm rainfall received in June was the highest for the 2013 monsoon season.

However, this does not feature among the top 5 values for monsoon rainfall in the period considered.

  • Rainfall during the week 13-06-13 to 19-06-13:366.3 mm
  • Departure from normal for the same week – 580%

Rudraprayag_ReshapedRudraprayag_100_Years

6. Pithoragarh-

  • Maximum rainfall in last 100 years 1057 mm in August 2000
  • Minimum rainfall in last 100 years 22 mm in June 1901
  • Maximum rainfall of 2013 compared with the 5 previous maximums: In 2013, 471.9 mm rainfall received in July was the highest for the 2013 monsoon season.

However, this does not feature among the top 5 values for monsoon rainfall in the period considered.

  • Rainfall during the week 13-06-13 to 19-06-13: 246.9 mm
  • Departure from normal for the same week – 238%

 Pithoragarh_ReshapedPithoragarh_100_Years

7. Chamoli

  • Maximum rainfall in last 100 years860.7 mm in September 1924
  • Minimum rainfall in last 100 years– 0 mm in 1998
  • Maximum rainfall of 2013 compared with the 5 previous maximums: In 2013, 537.9 mm rainfall received in July was the highest for the 2013 monsoon season.

It was a second maximum recorded rainfall since 1901-2000 and 2008-2013.

  • Rainfall during the week 13-06-13 to 19-06-13: 316.9 mm
  • Departure from normal for the same week – 1302%

Chamoli_Reshaped

Chamoli_100_Years

8. For Uttarakhand state-

  • Maximum rainfall in last 100 years685.6 mm in August 1922
  • Minimum rainfall in last 100 years 28.1 mm in September 1907
  • Maximum rainfall of 2013 compared with the 5 previous maximums: In 2013, 510.4 mm rainfall received in June (June 1 to July 3) was the highest for the 2013 monsoon season.

However, this does not feature among the top 5 values for monsoon rainfall in the period considered.


Uttarakhand_ReshapedUttarakhand_100_years

In conclusion While presenting data for entire districts, we realise that there have been major variations in rainfall experienced within a district, for example, parts of Pithoragarh received extremely high rainfall during 15th-19th June, but the average rainfall for Pithoragarh District in June 2013 (Period between 06.06.13-03.07.13) is only 418.4 mm. The week between 13 June 2013-19th June 2013 shows only 238% departure from normal rainfall, when the higher reaches of Pithoragarh received some of the heaviest rainfall in Uttarakhand in June 2013.

As per researcher Emmanuel Theophilus, from Himal Prakriti at Munsiyari, Pithoragarh, the rainfall data with IMD for the entire Pithoragarh Districts  is  only from 2 stations in  the mid altitude areas, where it hardly rained much. Hence, the discrepancy, of Pithoragarh having only a 238% departure from normal, whereas the NASA maps show one of the darkest blue spots in Pithoragarh as well. In addition, he says: “IMD has only a very few stations scattered sparsely over the state, and what they have, are located in central district and sub-division office locations. Sure this makes for easy gathering of data, but is of little use for understanding any particularities, even at the sub-basin scale. In just the Gori sub-basin (Pithoragarh) for example, rainfall can vary from 15 cm annually, (spread over ~28 rainy days a year, and not counting snow) in the higher alpine Trans-Himalaya reaches, to as much as 4 meters, yes meters, of rain annually (spread over ~152 rainy days a year, and again not counting snow) just 50 km downstream, in the Greater Himalaya. Therefore, statements such as ‘the entire state of Uttarakhand received 847% excess rainfall’, can be misleading.”

After the Uttarakhand Disaster of unprecedented proportions, let us hope that now IMD, Uttarakhand Government, heavily funded programs like National Climate Mission, Universities, research institutes[2], etc can come together to create reliable and representative weather monitoring stations in the vulnerable state. Only through such data will a robust forecasting system be supported.

Damodar Pujari and Parineeta Dandekar

END NOTES:


[1] From Emmanuel Theophilus: A River Pulse. A discussion paper on the flood-events in June 2013, Mahakali basin, Uttrakahand. Himal Prakriti, Sept 2013

[2] Here it may be noted that some institutes have their own automatic and other rain-gauge stations, but data from such stations is not in public domain. For example, Wadia Institute of Himalayan Geology (http://www.wihg.res.in/) is supposed to have at least two automatic weather stations at Chorabari lake upstream of the worst impacted Kedarnath, but the data from these stations was not put up in public domain promptly or even now. Such data can be of great use for disaster forecasting, management and other purposes, but cannot be put to use without the data being in public domain.

Assam · Dam Induced Flood Disaster · Dams · Expert Appraisal Committee · Hydropower

Lower Kopili HEP: Oustanding issues that must be resolved before EAC can consider the project

The Lower Kopili Hydro Electric Project(HEP) will be considered for TOR clearance in the forthcoming Expert Appraisal Committee(EAC) meeting on September 23-24, 2013. This project was first discussed in the 63rd EAC meeting held on 12-13th October, 2012. It was again discussed in the 65th meeting of the EAC held on 26-27th December, 2012 for approval of Terms of Reference (TOR) for the Environmental Impact Assessment (EIA). EAC had sent back the project proposal seeking additional information/clarification on several issues. There were several critical issues which were not raised by the EAC. We have made a submission to EAC pointing out issues which need urgent attention.

Background of Hydroelectricity Generation on Kopili River

The Kopili River: Kopili is a south bank tributary of Brahmaputra which originates in the Borail range mountains in Meghalaya at an altitude of about 1600 m and has a total length of 290 km up to its confluence with Brahmaputra. Its basin is bound by the Jaintia Hills in the west and the South Cachar and Mikir Hills in the east. Kharkor, Myntriang, Dinar, Longsom, Amring, Umrong, Longku and Langkri are its major tributaries in its upper reaches.

After entering Assam the Kopili separates the Karbi Anglong district from the Dima Hasao North Cachar Hills district up to its confluence with Diyung River on its right at 135 km. After the confluence with Diyung, Kopili flows into the Nagaon district in a north-westerly direction. The Jamuna River with a catchment of 3960 km2 flows to the Kopili at Jamunamukh. The river then flows in western direction, and further downstream, the Umkhen-Borapani River which rises in the Shillong plateau and drains an area of 2038 km2 joins Kopili at a distance of 254 km from the left. The Killing River, known as Umiam in its upper reaches draining an area of about 1445 km2, flows into Kopili from the left at about 280 km. The Kopili River finally flows to Kalang, a spill channel of Brahmaputra, near Hatimukh after traversing a distance of 290 km2. The total catchment of Kopili River is about 16,421km2.

Kopili HEP: The Kopili Hydro Electric Project (HEP) has two dams, one on the Kopili River and one on its tributary Umrang stream. This project was developed by NEEPCO (Northeast Electric Power Corporation Ltd.). The first dam with 66 m height on the Kopli River is known as Khndong dam and the second one with 30 m height is known as Kopili dam located at Umranso.  Water from the Khandong reservoir is utilised in the Khandong power station through a 2852 m long tunnel to generate 50 MW (2 X 25 MW) of power. The tail water from this powerhouse is led to the Umrong reservoir. The water from Umrong reservoir is taken through a 5473 m long tunnel to the Kopili power station to generate 200 MW (4 X 50 MW) of power. An additional 25MW was added to the Khandong dam in the Stage two of the Kopili HEP, making the total power generation 275 MW. Both Khandong and Kopili dams are concrete gravity dams. The first unit of this Kopili HEP was commissioned in March 1984. Additional unit under stage two was commissioned in July, 2004.

Proposed Lower Kopili HEP: The proposed Lower Kopili HEP is coming up in Boro Longku village in Dima Hasao district. The project is developed by Assam Power Generation Corporation Limited (APGCL). The Lower Kopili dam will be a concrete gravity dam with 70.13 m high dam wall. This project will also have two power houses and the first power house, or the main power house will have an installed capacity of 110 MW (2X55MW). An auxiliary Power House with an installed capacity of 10 MW (2×2.5 MW+1×5 MW) has been planned  at  the  toe  of  the  dam  for  utilizing  the  mandatory  releases  for  ecological purposes, making the total installed capacity 120 MW. The Head Race Tunnel(HRT) of the project will be 7.25 m in diameter and 3.6 km long. The total land required for this project will be 1577 ha out of which according to the revised PFR and Form-I 552 ha will fall under submergence. But the old PFR and Form-I had mentioned the size of the submergence area as 620ha. The  free flowing river  stretch  between  Full Reservoir Level  (FRL) of  Lower  Kopili  HEP  and  Tail Water Level (TWL) of upstream  Kopili  HEP  is  about  6  km.

The water available at Lower Kopili dam site will consists of the following components:

1.   Tailrace releases from Kopili Power Station (4 x 50 MW)

2.   Inflow from intermediate catchment between Khandong and Longku Dam site

3.   Spill from Khandong and Umrong Reservoir.

Projects in Cascade on Kopili River

Some Key Issues Requiring Urgent Attention

After thoroughly going through Pre Feasibility Report (PFR) and Form-I of the proposed Lower Kopili HEP we have found that following issues have not been adequately dealt with by the project authorities. Infact some of them have not even been mentioned at all. EAC should not give TOR clearance to the project without satisfactory resolution of these issues.

Dam induced Flood: Experiences of the people living in downstream suggest that floods have become more recurrent after construction of the dam. The Kopili dam has changed the character of flood in the river downstream for the worse. Before the construction of Kopili dam, floods occurred mainly during monsoon season. Increase in water volume due to heavy rains used to be the reason for flood. These were normal floods which occurred not more than two or three times a year. But after the construction of the dam, number of artificial floods occurring in a year has gone upto 5- 6 times. These floods mainly occurred from the month of August to the first one or two weeks of November. Government of Assam never made an attempt to investigate the source of these floods (this information is from a field visit done to the area). 

In the catastrophic floods of 2004, out of 140 revenue villages of Kampur circle of Nagaon district 132 were affected by floods with area of 135.12 sq. miles. Due to these floods 1,92,000 people were temporarily displaced. These floods also took the lives of 4 people. Even government had confirmed that the main reason for the devastation in these Nagaon and Morigaon districts was the release of the water from the NEEPCO’s Kopili project. The team that was deputed by the government found that water level of the Khandong reservoir went up to 727.70 meters against the FRL of 719.30 meters on 18th July 2004, which rolled down and led to catastrophic disaster. Flood release from the dam happened without prior warning and affected the whole valley. Kampur is one of the towns located in the downstream of Kopili dam where people were give only 2 hours to evacuate the area and move to nearby relief camps.  July 18 is less than midway through the monsoon and questions arise why was the dam allowed to be filled up so soon which had led to such disaster. Had the dam operations were conducted properly the disaster could have possibly been avoided.

The issue of flash floods in Kopili River was raised in the Assam state assembly. On 8th November, 2010 former Chief Minister of Assam Mr. Prafulla Kumar Mahanta, an MLA from Nagaon district made a call attention motion in the Legislative assembly on the issue flash floods in Kopili. He stated the NEEPCO is responsible for the flash floods in the Kopili River.[1] Then Water Resource Minister Prithvi Majhi in his reply accepted this claim by saying that “the government would take up the matter of providing prior warning before release of excess water with the NEEPCO authorities.”  From the above experiences of flood in Kopili River, it is clear that after the construction of the Kopili HEP (Hydroelectric Project) flood ferocity had increased in the downstream. In such situation construction of another dam in the immediate downstream of previous dam can worsen the flood scenario.

Besides, The Kopili reservoir of the Khandong dam is located at 82.5 km downstream from the origin of Kopili River. A major tributary Myntang with 512 sq kmcatchment joins Kopili at 86 km from origin[2]. This is one of the tributaries in the upstream of proposed Longku dam site. In rainy season excess of rains in the catchment of these streams can also lead to spillovers in the proposed dam itself. The PFR does not look into the cumulative impact of the operation of the two dams on the downstream riverine area.

Spillway Capacity Inadequate at Lower Kopili HEP: As per the PFR, the design spillway capacity of the proposed Lower Kopili project with catchment of 2106 sq km is 16110 cumecs. Compare this with the spillway capacity of the upstream Khandong dam on the same Kopili river with catchment area of 1256 sq km being 15471.3 cumecs. It is clear that the design spillway capacity of the proposed Lower Kopili Project is inadequate.

Acid Contamination due to Opencast Mining threatens Viability of Lower Kopili: In the item 9.9 of the Form-I it has been mentioned that the acidic mine discharge in the upper reaches of the Kopili catchment is posing serious threats to the existing Kopili HEP. The PFR states “The identified acid mine discharge has been reported to cause constant erosion/ corrosion of critical hydropower equipments leading to frequent outages of the power plants under Kopili HEP.” The minutes of 9th TCC (Technical Coordination Committee) & 9th North East Region Power Committee Meetings held on 11-12th August, 2010, stated “The Kopili HE Plant has faced an extraordinary and unprecedented situation owing to acidic nature of the reservoir water. Prima facie, the acidification of the reservoir water is caused due to unscientific coal mining in the catchment area as revealed by study through GSI, NER, Shillong. The increased wear and tear on the underwater metal parts of the Plant due to corrosive action of the acidic water has led to the increase in the number of breakdowns.” The minutes also mentioned “It is pertinent to mention here that, although massive repairing work has been carried out by NEEPCO as temporary measures; an integrated, interdisciplinary approach for preventing / tackling acidification at source must be opted for survival of the Plant.” The acidic contamination due to open cast mining is such that no living organisms could be found in the downstream of Kopili river up to Kheroni.[3] The situation is quite alarming as the PH value of the water has come down from 5.5 to 3.2 due to acidic contamination which is unfit for human consumption. State Power Minster was very much aware of the situation and expressing concerns over this he had asked the center to take up this issue with Meghalaya.[4] The PFR should have given detailed account of implication of this on the proposed Lower Kopili HEP and further downstream, but has not done that.

PFR overlooks Kopili Fault Line: The PFR of the proposed Lower Kopili HEP does not mention about the Kopili fault line[5]. In recent studies done in the Kopili river basin it has been found that the Kopili fault extends  from  western  part  of  Manipur  up  to  the  tri-junction  of  Bhutan,  Arunachal Pradesh  and Assam, covers  a  distance  of about  400 km. During the last 140 years, the Kopili fault has experienced 2 earthquakes of magnitude greater than 7 in R.S., three of magnitude 6 to 7 in R.S. and several of magnitude 4.5 to 6 in R.S.[6]   The study concludes that the North East region, more specially the Kopili Fault area is a geologically unstable region, surrounded by faults and lineaments and seduction zones in the east.  But the PFR of Lower Kopili, overlooking this issue states that there are only two minor faults in this area and both of them are much beyond the project area. This clearly wrong and misleading on the part of Lower Kopili PFR.

Besides, some of the EAC statements are not complete and stand in contradiction to each other. The EAC said that as the site specific seismic study had been completed by IIT Roorkee and considered it appropriate for 120 MW project. But it also mentioned “The project specific geo-morphological and neo-tectonic mapping has not been done so far. As the project area falls under the active seismic zone where the Disang-Naga Thrust and Dhauki fault merge which triggers high seismic risk, the proponent is to monitor the MEQ studies by installing a 3-4 seismograph network for a period of one year.” When EAC is aware of these site specific details, allowing an additional big dam in the area will only to increase disaster potential in the area. EAC needs to keep this in mind while considering this new dam.

Issues Tribal Land Relations: In the item 2.1 of the Form 1 the project authorities have stated that the 620 ha that will be submerged due to this project consists of medium to high density vegetation, scrubs open and barren land etc. But Dima Hasao people have expressed their fears of not getting proper rehabilitation.[7] The project seems to ignore this fact in the form 1. There can another reason also for the stating the submerged land as government land because the land holdings may not same as the ‘patta’ lands.[8] Besides, the area which has been considered for the construction of the dam is inhabited by Dimasa people who mainly depended on the system of shifting cultivation.[9] It is to be noted that in shifting cultivation there a cultivator cannot exercise permanent ownership over the land.

Defining ‘Other Forests’: The project as stated in item 1.1 of form 1 will also submerge 65 ha cultivation land. In the same item it is mentioned that an area of 585 ha will be submerged and this area has been mentioned as ‘other forests’. But the Form 1 did not define what this ‘other forests’ are or what they consists.

Impact on the Local People: In a memorandum submitted jointly by the Karbi Students’ Association (KSA), Sominder Kabi Amei (SKA) and Karbi Nimso Chingthur Asong (KNCA), to the State Power Minster Mr. Praduyut Bordoloi, the association demanded first preference in terms of employment should be given to the locally affected people. But the track record of dam building companies is very poor in this regard. The local people did not get promised employment and other benefits the in the Kopili project which came up in 1970s, 1980s and 1990s. On 20th March 2012, the Dimasa Students’ Union, Dimasa Welfare Association, Karbi Students’ Association and Sengia Tularam Club called for a 48 hours Umrangso bandh seeking “60 per cent of technical and non-technical posts in the project should be reserved for the local tribal populace, 100 per cent reservation for local tribal youths for Grade III and Grade IV posts, free electricity for locals, free treatment facilities in NEEPCO-run hospitals and so on.”[10] This is very crucial issues but surprisingly it finds no place in the PFR document.

Why the size of forest area significantly reduced: In the revised Form I and PFR, submitted on 23 August 2013, Section 1.1 mentioned that out of 1577 ha which is the total land required for the project, 552 ha will fall under submergence and 340 ha forest land will  be submerged in the reservoir. But the previous Form I and PFR, submitted on 14th November 2012, stated in the same section that the land falling under submergence and land converted into reservoir area is same i.e. 620 ha. The revised document does not give any rationale for reducing size of submergence area and reservoir area. It is also surprising to note that in the revised document, under the section “Impacts due to damming of river” in page 55, the old figures of submergence has been reiterated – “The  damming  of  river  Kopili  due  to  the  proposed  hydroelectric  project  in  creation  of  620  ha  of submergence  area.” So the new documents submitted in Aug 2013 have serious contradictions.

Issues Need to be Included in EIA report

Since several critical issues were not included in the previously submitted document, we have listed out the following issue which should be included in the Environment Impact Assessment (EIA) study of the proposed Lower Kopili HEP. Without detail analysis of all these issues EIA cannot be considered as complete.

Downstream Impact Assessment:  Downstream impact assessment is a burning problem in Assam. The state has already witnessed huge protests against dams due to lack of proper downstream impact assessment. In case of proposed Lower Kopili HEP, the EIA document should do a proper downstream impact assessment. In order to do a thorough downstream impact assessment, the EIA will have to go beyond the 10 km radius and assess the full downstream area. In case of Lower Kopili, going beyond 10 km downstream becomes all the more significant because major part of the Kopili river basin is in the downstream of the dam. The downstream impact assessment should specifically focus on the impacts of the dam on fisheries and livelihood of the people who are dependent on fisheries, change in character of flood and impacts thereof, change in sedimentation and impacts thereof, change in geomorphological issues, change in groundwater recharge, among others. The EIA should find which section of people will be affected the most by the dam and how to compensate those people.

It has been reported that bank erosion by the Kopili River has increased after the construction of the Kopili dam. The EIA report of Lower Kopili HEP, should do an analysis to find what will be impacts of the new project on river bank erosion.

Impacts Peaking Power Operations: The EIA should do a detail assessment of impacts of peaking power operation during non-monsoon months. Due to peaking power generation in non-monsoon months the river stretch downstream from power house will have very little water for most hours of a day with sudden flows in the river only for a few hours. This flow fluctuation leads to many severe impacts including on aquatic bio-diversity, on safety, on river bed cultivation, on erosion, among others. This has severe socio economic impacts along with issues of safety of the people and their livestock in this stretch of the river. Therefore the EIA should do a detail assessment of impacts of peaking power generation.

Assessment of Optimum Reservoir Operation: The EIA should do an assessment to prepare an optimum reservoir operations plan for the project in order to minimize the downstream impacts if a disaster occurs. It is also highly recommended that the local people should be made a part of the reservoir operations process. Then only the dam authorities can be expected to be more responsible to in reservoir operations.

Impacts of Silt Management operations: The EIA should include detail analysis impact of changing silt flows downstream from desilting chamber, from silt flushing in monsoon, on the downstream areas. The EIA study should give detailed account of how the silt from the dam will be flushed out annually and what will be the impact of this in the downstream. The EIA should also include how the desilting chamber will be operated and what will be its impacts.

Detailed and Thorough Options Assessment: The EIA should do a thorough options assessment for the project. There can be several other cost effective options for power generation in that area and options assessment should look into al those.

Here we can take the case of solar power. A recent example of proposed 1000 MW solar power generation in Rajastan[11] has showed that for 1 MW installed capacity only 2 Ha of land is required and the cost per megawatt installed capacity will be 7.5 crores and electricity will be provided at Rs 6.5 per unit. Another proposed 25 MW solar power project in Assam[12] has similar figures.

At this rate, for a 120 MW (the target capacity of the proposed Lower Kopili HEP) solar power plant, the land required will be 240 ha. But for Lower Kopili HEP the land required is 1557 ha of land out of which nearly 900 ha will be used for the project even if we subtract 680 ha projected to be used for compensatory afforestation. This implies that for 1 MW installed capacity for the proposed dam the land requirement will be about 7.5 ha, about 3.75 times the land required for solar project of same capacity. Besides, the total cost for the Lower Kopili project is expected to be Rs. 1489.64 crores implying cost per MW installed capacity will be Rs. 12.41 crores, compared to Rs 7.5 cr for solar plant. Even if we were to put up 240 MW installed capacity of solar project, it would require 480 ha land, will not have impacts on the river, on people’s livelihoods, on forests, on climate change, and so on.

Increased Costs: It is important to note here that EAC in its 65th meeting in March 2013 discussing this projects had noted “In  comparison  to  other  HEPs  being  examined  recently,  the  cost  per  unit  of installed capacity of this project is almost double!” and this was said when the cost per megawatt installed capacity was Rs. 9.79 crores. Now in the revised document, the cost has gone up further to Rs 12.41 cr, the project proponent need to explain this further escalation from the earlier already high cost.

Groundwater Depletion in Downstream areas: People in the downstream of Kopili dam have reported that there has been depletion of groundwater in the downstream areas of Kopili dam. From a field visit done in the downstream areas of Kopili dam, it was reported that the ground water level at certain areas had reduced to 140 feet. River like Borapani, Kopili and Nisari dry up in the winters affecting the winter cultivations. Besides, wetlands which are known as Beel or Duba locally have disappeared. The reduction in groundwater can also be due to reduced groundwater recharge due to the dam. Impact of the dam on groundwater recharge should be a part of the EIA study.

Impacts of Tunneling and Blasting: The EIA should analyze the impacts of tunneling and blasting as these activities can increase in risk of landslide and disaster in a hilly area. Blasting in hilly area also will have impacts on water and people. These impacts should be thoroughly assessed by the EIA of the proposed project.

Impacts of Mining: The project will require large quantities of sand, coarse and fine granules and boulders. These are likely to be mined from the nearby areas. The EIA should include a study on the impacts of mining on the people as well on the local environment. Mining for the project will be done in the nearby areas and it will have severe impact on people as well as on the river, bio-diversity, hills, flora-fauna and aquatic bio-diversity etc. The study on the impacts of mining should include all these issues.

Impacts of Backwater Effects: The PFR of proposed Lower Kopili HEP states that Maximum Water Level (MWL) of the river is 229.60m where as the FRL of the reservoir is 226.0m. The MWL is thus 3.6m higher than FRL and this will have serious back water effects during the times of monsoon. The EIA must do an assessment of the submergence at MWL level and backwater effect measured at MWL and follow it up with an impacts analysis.

Detailed analysis about the existence of wetlands, watercourses and other water bodies: The revised PFR in page 17 under section ‘Environment Sensitivity’ states that there are no wetlands, watercourses and other waterbodies reported within the 15 km of the project. This statement seems incorrect. The EIA should do a detailed and thorough analysis regarding the existence wetlands, watercourses and other water bodies within 15 km of the project site.

 Impacts of Climate Change: The EIA of the proposed Lower Kopili dam should do a study of  possible impact of the climate change on the dam as well as on the Kopili river. Besides, it should also include the impacts of the dam on adaptation capacity of the local people.

Smaller Size Documents should be Uploaded for Public Dissemination: The EIA and other documents which would be uploaded on the internet should be about the size of 10 MB or less. The Revised Form I and PFR which uploaded on the MoEF website was 114 MB and it was difficult to download such a huge document even in a metropolis. These heavy documents will nearly be impossible to download from a small town or a village. The MoEF should insist from projects proponents that PP should be careful about this and should reduce the size (less than 10MB) documents for uploading from next time.


Parag Jyoti Saikia

with inputs from Himanshu Thakkar and Pooja Kotoky

Email – meandering1800@gmail.com

South Asia Network on Dams, Rivers & People (https://sandrp.in/https://sandrp.wordpress.com/)


[2] Patowary, A., “The Kopili Hydroelectric Project, Downstream People Rise in Struggle” published in “Water Conflicts in Northeast India – A Compendium of Case Studies” edited by Das, Partha J. et. all, 2013

[5] Mahanta,  K. and et all (2012): “Structural Formation & Seismicity of Kopili Fault Region in North-East India and Estimation of Its Crustal Velocity” International Journal of Modern Engineering Research,Vol.2, Issue.6, Nov-Dec. 2012 pp-4699-4702

[6] ibid

[8] It is to be noted that in many of the tribal areas of Assam and India’s north eastern states, the tribal law of land is community of ownership of land and there are no government ‘patta’ system.