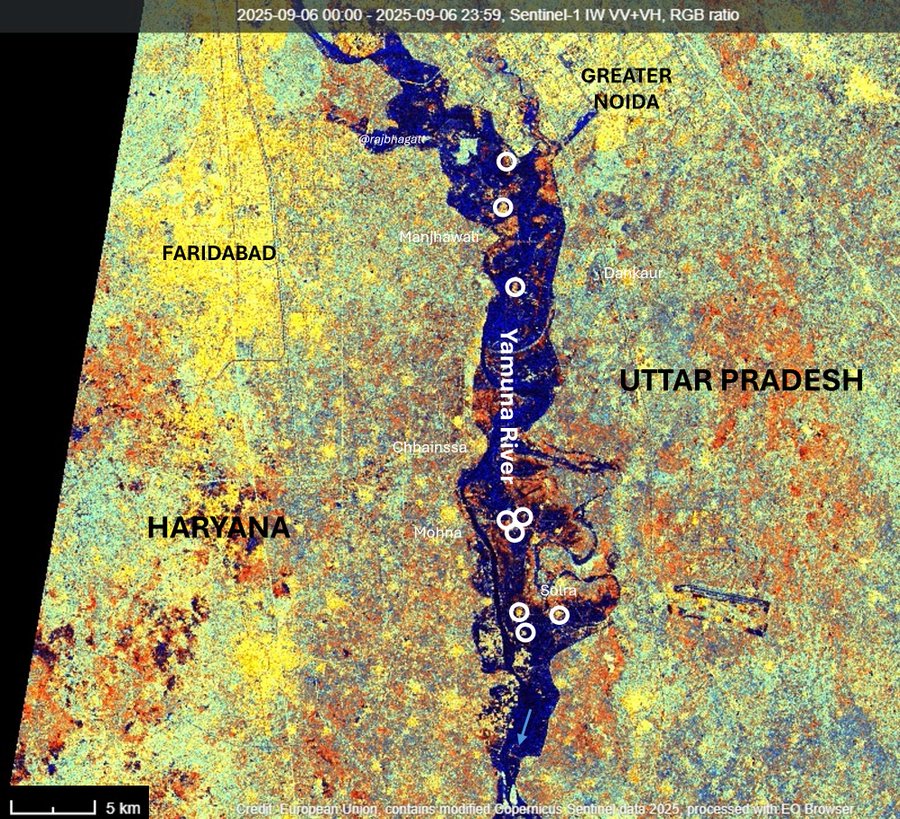
(Feature Image: Sept. 06, satellite image showing Yamuna flood spread downstream Delhi. Credit: Raj Bhagat P)
During South West Monsoon 2025, the Yamuna has witnessed one low, one medium and one high flood spells in its upper segment. On account of good rainfall in the catchment, the river also received significant flows for about one and half month from last week of July 2025 upto first week of Sept 2025. Due to this flood spells and flows the water quality in Delhi stretch of the river improved significantly, though temporarily.
The upper segment was monsoon deficit in 2024 and the peak flood discharge at Hathnikund Barrage (HKB), Yamuna Nagar was only 87,017 cusecs, that too just for one hour on Sep 26, 2024. The river received 50,000 cusecs plus discharge only for ten hours during entire season. As a result, the flood level in Delhi stretch of river could not even cross the warning level of 204.5 m and the water quality declined to alarming level during the 2024 monsoon.
The Haryana Irrigation Department has divided Yamuna floods in three categories low, medium and high. Discharges measured at HKB above 75,000 cusecs upto 1.5 lakh cusecs are termed as low flood, between 1.5 lakh to 2.5 lakh cusecs as medium flood and above 2.5 lakh cusecs as high flood. The operation of Western and Eastern Yamuna canals is closed once the hourly flood inflows cross 1 lakh cusecs volume at the HKB. Few years back the canal operation was closed after hourly inflows crossed 70,000 cusecs.
This monsoon season, the first medium flood spell in the river started on Aug. 17 when the river received 1 lakh cusecs plus discharges for 12 hours continuously with the peak volume being 1,78,996 cusecs at 16:00 hour.
Then on Aug. 29, 2025, the river witnessed a low flood spell when the discharges from HKB remained above 50,000 cusecs for about 21 hours in a row with the peak recorded as 83,774 cusecs at 16:00 hour.
The high and final flood spell in the river happened in first week of Sept. 2025 when discharges recorded at HKB continuously remained above 1 lakh cusecs for about 129 hours between 4:00 hr on Sep 1 to 12:00 hr on Sep 5, 2025 with the peak flood volume of 3,29,313 lakh cusecs at 9:00 hr on Sep 1, 2025.
The table below shares the hourly one lakh cusecs plus flood volume in river from HKB. The data is taken from Central Water Commission (CWC) Flood Forecast website. A separate file containing hourly discharges in Yamuna from HKB between June 26 & Oct 20, 2025 can be seen here.
Table 1 Details of 1 lakh cusecs+ flood volume in Yamuna at HKB
| Time | 17.08.25 | 01.09.25 | 02.09.25 | 03.09.25 | 04.09.25 | 05.09.25 |
| 01:00 hr | 2,23,729 | 1,83,839 | 1,67,650 | 1,25,014 | ||
| 02:00 hr | 2,23,054 | 1,80,060 | 1,63,994 | 1,23,906 | ||
| 03:00 hr | 2,19,018 | 1,80,060 | 1,59,756 | 1,22,802 | ||
| 04:00 hr | 1,65,512 | 2,13,677 | 1,76,360 | 1,57,957 | 1,21,152 | |
| 05:00 hr | 2,10,359 | 2,15,675 | 1,70,728 | 1,53,177 | 1,17,876 | |
| 06:00 hr | 2,38,748 | 2,07,721 | 1,68,884 | 1,48,443 | 1,14,630 | |
| 07:00 hr | 2,72,642 | 1,83,207 | 1,63,994 | 1,43,183 | 1,10,843 | |
| 08:00 hr | 3,11,029 | 1,76,307 | 1,62,779 | 1,42,604 | 1,07,172 | |
| 09:00 hr | 3,29,313 | 1,63,386 | 1,60,359 | 1,35,702 | 1,06,652 | |
| 10:00 hr | 3,21,653 | 1,51,393 | 1,58,552 | 1,33,995 | 1,04,558 | |
| 11:00 hr | 3,19,367 | 1,51,393 | 1,59,153 | 1,34,567 | 1,04,558 | |
| 12:00 hr | 3,23,180 | 1,54,958 | 1,57,951 | 1,35,702 | 1,02,996 | |
| 13:00 hr | 1,09,029 | 3,22,416 | 1,54,360 | 1,58,552 | 1,32,861 | |
| 14:00 hr | 1,04,306 | 3,03,519 | 1,45,514 | 1,61,562 | 1,31,166 | |
| 15:00 hr | 1,28,280 | 2,96,810 | 1,51,393 | 1,62,779 | 1,32,295 | |
| 16:00 hr | 1,78,996 | 2,93,848 | 1,53,767 | 1,65,211 | 1,34,563 | |
| 17:00 hr | 1,29,896 | 2,92,365 | 1,49,032 | 1,71,346 | 1,37,416 | |
| 18:00 hr | 1,19,943 | 2,63,317 | 1,42,024 | 1,74,442 | 1,38,563 | |
| 19:00 hr | 1,27,030 | 2,61,180 | 1,63,386 | 1,78,180 | 1,36,884 | |
| 20:00 hr | 1,22,937 | 2,53,394 | 1,71,346 | 1,78,806 | 1,35,702 | |
| 21:00 hr | 1,16,881 | 2,42,905 | 1,76,307 | 1,75,685 | 1,33,995 | |
| 22:00 hr | 1,08,485 | 2,41,518 | 1,80,688 | 1,73,201 | 1,31,730 | |
| 23:00 hr | 1,07,805 | 2,34,622 | 1,87,008 | 1,68,883 | 1,30,040 | |
| 24:00 hr | 1,04,309 | 2,29,834 | 1,88,281 | 1,68,883 | 1,27,229 |
Summary: The river got3 lakh cusecs+ for 7 hrs. The peak volume was 3,29,313 cusecs at 9:00 hour on 01.09.2025. 2.5 lakh cusecs+ for additional 7 hours. 2 lakh cusecs+ for additional 12 hours. 1.5 lakh cusecs+ for additional 46 hrs. 1 lakh cusecs + for additional 45 hrs.
The flood spell coincided with good rainfall spell in river adjoining districts in Haryana, Delhi and Uttar Pradesh enabling river to flow through its upper and middle segment from Yamuna Nagar to Etawah. The river also crossed highest flood levels (HFL) at least at 5 flood monitoring sites of CWC. The table below shares the peak flood level attained at 25 sites on Yamuna and its tributaries.
| SN | Site/ River | District/ State | HFL/ Date | Peak Flood Level in Sept. 2025 | -/+ old HFL |
| 1 | Meenus Khad/ Meenus | Sirmaur/ Himachal Pradesh | 735.3 m/ 10.07.2023 | 734.9 m/ 06:00 hr/ 01.09.2025 | -0.4 m |
| 734.95 m 18.08.2019 | |||||
| 2 | Meenus/ Tons | Sirmaur/ Himachal Pradesh | 730.35 m 10.07.2023 | 729.45 m/ 09:00 hr/ 01.09.2025 | -0.9 m |
| 729.02 m 18.08.2019 | |||||
| 3 | Kheri/ Giri | Sirmaur/ Himachal Pradesh | 785.8 m/ 18.08.2019 | 785.2 m/ 07:00 hr/ 01.09.2025 | -0.6 m |
| 4 | Dadahu/ Giri | Sirmaur/ Himachal Pradesh | 629.02 m/ 18.08.2019 | 628.95 m/ 07:00 hr/ 01.09.2025 | -0.07 m |
| 5 | Paonta/ Yamuna | Sirmaur/ Himachal Pradesh | 384.6 m/ 05.09.1995 | 383.6 m/ 11:00 hr/ 01.09.2025 | -1.0 m |
| 6 | Ganguwala/ Bata | Sirmaur/ Himachal Pradesh | 373.93 m/ 26.09.2024 | 371.58 m/ 10:00 hr/ 01.09.2025 | -2.35 m |
| 372.6 m/ 18.08.2019 | |||||
| 7 | Fatehgarh/ Somb | Yamuna Nagar/ Haryana | 273.75 m/ 10.07.2023 | 272.61 m/ 15:00 hr/ 31.08.2025 | -1.14 m |
| 8 | Panchkuan/ Budi Yamuna | Saharanpur/ Uttar Pradesh | 277.1 m/ 11.07.2023 | 276.36 m/ 15:00 hr/ 01.09.2025 | -0.74 m |
| 9 | Ghodopipli/ Maskara | Yamuna Nagar/ Haryana | 271.35 m/ 12.07.2023 | 270.75 m/ 20:00 hr/ 01.09.2025 | -0.6 m |
| 10 | Kalanaur/ Yamuna | Saharan-pur/ Uttar Pradesh | 268.66 m/ 09.09.2010 | 266.9 m/ 18:00 hr/ 01.09.2025 | -1.76 m |
| 11 | Karnal/ Yamuna | Karnal/ Haryana | 250.07 m/ 17.06.2013 | 248.78 m/ 22:00 hr/ 01.09.2025 | -1.29 m |
| 12 | Mawi/ Yamuna | Shamli/ Uttar Pradesh | 232.75 m/ 18.06.2013 | 232.1 m/ 14:00 hr/ 02.09.2025 | -0.65 m |
| 13 | Baghpat/ Yamuna | Baghpat/ Uttar Pradesh | 217.18 m/ 27.09.1988 | 216.34 m/ 02:00 hr/ 03.09.2025 | -0.84 m |
| 14 | Palla/ Yamuna | Delhi | 212.8 m/ 08.09.1995 | 212.26 m/ 10:00 hr/ 03.09.2025 | -0.54 m |
| 15 | Railway Bridge/ Yamuna | Delhi | 208.66 m/ 13.07.2023 | 207.48 m/ 06:00 hr/ 04.09.2025 | -1.18 m |
| 207.49 m/ 06.09.1978 | -0.01 m | ||||
| 16 | Manjhawali/ Yamuna | Faridabad/ Haryana | 194.18 m/ 14.07.2023 | 194.19 m/ 12:00 hr/ 05.09.2025 | +0.01 m |
| 193.96 m 21.08.2019 | |||||
| 17 | Mohna/ Yamuna | Faridabad/ Haryana | 192.44 m/ 14.07.2023 | 192.45 m/ 10:00 hr/ 06.09.2025 | +0.01 m |
| 192.43 m 09.09.1995 | |||||
| 18 | Rahimpur/ Yamuna | Palwal/ Haryana | 186.49 m/ 16.07.2023 | 186.41 m/ 12:00 hr/ 06.09.2025 | -0.08 m |
| 182.25 m 22.08.2019 | |||||
| 19 | Shergarh/ Yamuna | Mathura/ Uttar Pradesh | 177.32 m/ 16.07.2023 | 177.35 m/ 11:00 hr/ 07.09.2025 | +0.03 m |
| 176.19 m 30.09.2022 | |||||
| 20 | Prayagghat/ Yamuna | Mathura/ Uttar Pradesh | 169.73 m/ 08.09.1978 | 167.67 m/ 04:00 hr/ 08.09.2025 | -2.06 m |
| 21 | Gokul Barrage/ Yamuna | Mathura/ Uttar Pradesh | 166.22 m/ 17.07.2023 | 166.5 m/ 09:00 hr/ 08.09.2025 | +0.28 m |
| 166.17 m/ 26.09.2010 | |||||
| 22 | Poiyagaht/ Yamuna | Agra/ Uttar Pradesh | 154.87 m/ 09.09.1978 | 152.95 m/ 16:00 hr/ 09.09.2025 | -1.92 m |
| 23 | Jawahar Bridge/ Yamuna | Agra/ Uttar Pradesh | 154.76 m/ 09.09.1978 | 152.52 m/ 08:00 hr/ 09.09.2025 | -2.24 m |
| 24 | Bateshwar/ Yamuna | Agra/ Uttar Pradesh | 133.81 m/ 20.07.2023 | 135.02 m/ 02:00 hr/ 11.09.2025 | +1.21 m |
| 131.92 m 02.10.2022 | |||||
| 25 | Etawah/ Yamuna | Etawah/ Uttar Pradesh | 126.13 m/ 11.09.1978 | 122.93 m/ 03:00 hr/ 11.09.2025 | -3.2 m |
The flood level details for 25 monitoring sites including 8 on tributaries in upper segment and 17 on main stem of Yamuna suggest that the heavy rainfalls in Shivalik catchment of the river including Sirmaur, Yamuna Nagar and Saharanpur districts have largely contributed in the high flood spell in the river in first week of Sept. 2025.
Notably, the Sept. 2025 flood spell have again resulted in July 2023 like unusual flood situation in Delhi stretch of the river where the peak level at Delhi Railway Bridge site increased this year to 207.48 meter which is just 0.01 meter short than the historic flood levels of Sept. 1978. Again, the peak flood level remained comparatively lower at 5 monitoring sites on the river above Delhi. In this blog, SANDRP has analyzed the probable reasons behind unexpected flood levels in Delhi in Sept. 2025 despite relatively moderate discharges from HKB.
Interestingly, the peak flood levels in Sept. 2025 have been lower than July 2023 upto Delhi and higher downstream Delhi upto Etawah. The 5 sites where HFLs are breached are also downstream Delhi which coincidently were attained only in July 2023. It is worth mentioning of 16 flood monitoring sites on Yamuna between Kalanaur and Etawah, the river had attained HFL at 7 sites and except Delhi Railway Bridge the remaining 6 sites are downstream Delhi.
The table below shows the peak flood level attended at 16 flood monitoring sites on Yamuna in July 2023 and Sept. 2025 comparing the level with previous HFL and difference between peak levels in both floods.
| No. | Site/ District | HFL (m)/ Date | July 2023 Peak Level/ Time/ Date | Peak Level -/ + HFL by in July 2023 | Sept 2025 Peak Level/ Time/ Date | Peak Level -/+ HFL in Sept. 2025 | Gap in July 2023 & Sept. 2025 Peak |
| 1 | Kalanaur/ Saharanpur | 268.66 m/ 09.09.2010 | 268.00 m/ 09:00 hr/ 10.07.2023 | -0.66 m | 266.9 m/ 18:00 hr/ 01.09.2025 | -1.76 m | -1.10 m |
| 2 | Karnal | 250.07 m/ 17.06.2013 | 248.91 m/ 01:00 hr/ 11.07.2023 | -1.16 m | 248.78 m/ 22:00 hr/ 01.09.2025 | -1.29 m | -0.13 m |
| 3 | Mawi/ Shamli | 232.75 m/ 08.06.2013 | 232.30 m/ 16:00 hr/ 12.07.2023 | -0.45 m | 232.1 m/ 14:00 hr/ 02.09.2025 | -0.65 m | -0.20 m |
| 4 | Baghpat | 217.18 m/ 27.09.1988 | 216.53 m/ 01:00 hr/ 13.07.2023 | -0.65 m | 216.34 m/ 02:00 hr/ 03.09.2025 | -0.84 m | -0.19 m |
| 5 | Palla/ Delhi | 212.80 m/ 08.09.1995 | 212.55 m/ 10:00 hr/ 13.07.2023 | -0.25 m | 212.27 m/ 18 hr/ 03.09.2025 | -0.53 m | -0.28 m |
| 6 | Delhi Railway Bridge | 207.49 m 06.09.1978 | 208.66 m/ 18:00 hr 13.07.2023 | +1.17 m | 207.48 m/ 06:00 hr/ 04.09.2025 | -0.01 m | -1.16 m |
| 7 | Manjhawali/ Faridabad | 193.96 m 21.08.2019 | 194.18 m/ 13:00 hr 14.07.2023 | +0.22 m | 194.19 m/ 12:00 hr/ 05.09.2025 | +1.03 m | +0.81 m |
| 8 | Mohna/ Faridabad | 192.43 m 09.09.1995 | 192.44 m/ 23:00 hr 14.07.2023 | +0.01 m | 192.45 m/ 10:00 hr/ 06.09.2025 | +0.02 m | +0.01 m |
| 9 | Rahimpur/ Palwal | 182.25 m 22.08.2019 | 186.49 m/ 01:00 hr 16.07.2023 | +4.24 m | 186.41 m/ 12:00 hr/ 06.09.2025 | +4.16 m | +0.08 m |
| 10 | Shergarh/ Mathura | 176.19 m 30.09.2022 | 177.32 m/ 13:00 hr 16.07.2023 | +1.13 m | 177.35 m/ 11:00 hr/ 07.09.2025 | +1.16 m | +0.03 m |
| 11 | Prayag-ghat/ Mathura | 169.73 m/ 08.09.1978 | 167.35 m/ 23:00 hr 17.07.2023 | -2.38 m | 167.67 m/ 04:00 hr/ 08.09.2025 | -2.06 m | +0.32 m |
| 12 | Gokul Barrage / Mathura | 166.17 m/ 26.09.2010 | 166.22 m 23:00 hr 17.07.2023 | +0.05 m | 166.5 m/ 09:00 hr/ 08.09.2025 | +0.33 m | +0.28 m |
| 13 | Poiyagaht/ Agra | 154.87 m/ 09.09.1978 | 152.54 m/ 17:00 hr 18.07.2025 | -2.33 m | 152.95 m/ 16:00 hr/ 09.09.2025 | -1.92 m | -0.41 m |
| 14 | Jawahar Bridge/ Agra | 154.76 m/ 09.09.1978 | 152 m/ 17:00 hr 18.07.2025 | -2.76 m | 152.52 m/ 08:00 hr/ 09.09.2025 | -2.24 m | -0.52 m |
| 15 | Bateshwar/ Agra | 131.92 m 02.10.2022 | 133.81 m/ 11:00 hr 20.07.2023 | +1.89 m | 135.02 m/ 02:00 hr 11.09.2025 | +3.92 m | +2.03 m |
| 16 | Etawah/ Etawah | 126.13 m/ 11.09.1978 | 121.68 m/ 20:00 hr 20.07.2023 | -4.45 m | 122.93 m/ 03:00 hr 11.09.2025 | -3.2 m | -1.25 m |
The most curious case is of Gokul barrage where Sept. 2010 HFL was first crossed in July 2023 which is now breached in Sept. 2025.
It is strange because like Sept. 1978, the peak flood volume at HKB was above 7 lakh cusecs in Sept. 2010 too. So, the HFL attained after 7 lakh cusecs plus peak flood volume are being crossed with half of the peak flood volume in 2023 & 2025 at Gokul barrage site.
This needs to be studied whether and to what extent the concurrent rains, floodplain encroachments, construction of new bridges, siltation of riverbed and operation of barrages particularly the Wazirabad, Okhla and Gokul have been influencing the natural flooding pattern of the river downstream of Delhi as also in Delhi.
While Nem Singh a farmer of Momnathal village in Noida claims there was no flood spell in Hindon and the flood level in Sept. 2025 was lower in Yamuna than July 2023, J K Bhati a Faridabad villager across the river feels flood level higher in Sept. 2025 than July 2023 in his Amipur village which he doubts could be due obstruction created by newly operated bridge on the river in Manjhawali about 3 km downstream from his village.
As per Charan Singh, a resident of Oba village in Kosi and Nakul from Mathura town, Yamuna carried slightly more water in Sept. 2025 in comparison with July 2023. Since the flood monitoring site at Gokul is about 500 m downstream of the barrage, the breaching of HFL there in July 2023 and Sept. 2025 could be due to high discharges from the barrage. This could also be a reason behind significant flood damage in downstream villages in Mathura & Agra.
“This time the river overtopped its bank, flooded farmlands and area which remained unaffected in July 2023 floods” says Nem Singh a villager from Gadaya under Farah tehsil. Villagers also blame sand mining for river changing its course towards their village during the flood.
However, Ashwani Misra from Agra city does not feel much difference in both the last flood spells. As per him only residential areas built in lower floodplain were affected. He finds the massive siltation of riverbed and floodplain encroachments have greatly reduced the flood carrying capacity of the river. “The flood spills over its bank even with low discharges”, he says.
“The simultaneous flood spell in Utangan river could be contributing factor in significant rise in flood level and breach of 2023 HFL at Bateshwar site in Bah tehsil downstream of Agra”, says a CWC staff on the condition of anonymity. Notably, the HFL 135.02 meter dated 11.09.2025 at Bateshwar site is still 1.94 meter lower than the danger level of the 136.96 meter at the site.
There are some reports from Sonipat, Mathura and Agra which have compared Sept. 2025 flood with 1978 deluge mentioning it occurring after 47 years. However, all the villagers quoted above unanimously say that the 1978 flood spell was way far bigger than the July 2023 & Sep 2025 flood spells.
The CWC flood data also shows that the Sept. 2025 flood level stayed considerably lower at Prayag ghat in Mathura, Poiyaghat and Jawahar Bridge sites in Agra and Etawah sites where the HFL was set in 1978. In fact, of all the CWC’s flood monitoring sites upto Etawah on main stem of Yamuna, these four are the only sites where 1978 HFLs still remain unchanged.
Impact on Agriculture: The Sept. 2025 floods and riverbank erosion damaged farming lands, crops in several districts along the river in Haryana & Uttar Pradesh. In Yamuna Nagar, paddy, sugarcane and fodder crops in over 11,000 acres were affected. In Karnal about 7,500 acres of farmland were submerged. In Panipat and Sonipat standing crops on thousands of acres were damaged. Three minor breaches in embankment near Pathargarh village in Panipat were plugged timely. Riverbank erosion created safety threats for Pabnera and Bega villages in Sonipat. Jajal and Asadpur villagers in the district were shifted to safer places.
The flood engulfed over 300 acres of farmlands in Ghaziabad. Some minor breaches in Alipore embankments in Loni area were fixed in time. In Faridabad and Palwal crops on about 16,000 farmlands were inundated. These reports (1, 2, 3, 4, 5, 6, 7, 8, 9, 10, 11, 12, 13) cover impact of flood and erosion on farmlands in Sonipat, Panipat, Baghpat, Greater Noida, Palwal, Mathura, Agra. This report highlights man-made factors including riverbed mining, floodplain encroachment aggravating flood damages in Haryana and suggests riverbank afforestation, wetland restoration and climate-resilient agriculture as solutions.
Impact in & downstream of Delhi Yamuna flood attained the third highest flood level 207.48 meter in 63 years. The residential areas of Majnu ka Tila, Tibetan colony, ISBT Kashmir Gate, Civil Lines, Yamuna Bazarand crematorium at Nigambodh ghat, Geeta Colony were affected by flooding. The flood also invaded human habitations in Garhi Mandu, Usmanpur, Chilla Khadar, Badarpur Khadar and Madanpur Khadar.
Hundreds of homes were severely inundated in Vishwakarma colony of Jaitpur. About 20,000 floodplain farmers and nursery workers took refuge in relief camps. Ironically, even the flood relief camps at Yamuna Bazar and Mayur Vihar were inundated by the flood waters.
All the 10 riverfront projects faced submergence and damages. The flood spell affected the road, rail and metro transport for hours. The back flows from the drains caused severe waterlogging in areas of Burari and Batala House. This report covers impact of Sept. 2025 flood spell on the city life.
About 2500 Gitanjali colony residents in Jharoda Kalan were forced to leave their homes after a major breach in Mungeshpur drain which feeds Sahibi river known as Najafgarh drain on Sept. 2. The breach also submerged about 500 acres of farmland, parts of an industrial area in Bahadurgarh under Jhajjar district of Haryana. Heavy rains, lack of maintenance, closure of Najafgarh drain due to Yamuna floods were attributed as reasons behind the incident.
Faridabad: The Basantpur area of Faridabad was worst hit by the floods where hundreds of homes inside the embankment were inundated and about 3000 households were vacated by the administration impacting about 8000 people. The administration also declared flood danger over 14 villages and sounded flood alert for about 27 villages.
Noida: All the farmhouses built in Yamuna floodplain were severely flooded displacing about 3500 occupants from Sector 135 and several villagers were also shifted to safer places. As per locals this was fourth time in 15 years (2010, 2013, 2023 and 2025) that the river had swelled to this scale. Several of the farmhouses suffered structural damages due to the floods. This video report covers the impact of deluge on the people and farmhouses. The satellite images of flood affected areas along the river in NCR can be seen here 1, 2, 3, 4.
Mathura: The flood water entered more than two dozen colonies along the river as a result over 10,000 people were moved to safer places in Vrindavan and Mathura. The flood also affected over 50 villages in the district. The reports detailing Sept. 2025 Yamuna flood impact in Mathura can be seen here 1, 2, 3, 4, 5, 6, 8, 9.
The site of Heritage City project proposed on 753 acres of land in Raya near Mathura-Vrindavan was submerged raising concerns over potential flood damages to it during monsoon in future. The open-air cultural parks, artisan villages and planned 30 km riverfront are seen as particularly vulnerable. Officials warned that tourism infrastructure of this scale cannot be sustained on flood-prone land without robust safeguards. Following this, the Yamuna Expressway Authority asked the project consultant to undertake a detailed risk assessment to assess the impact of the flooding and determine if parts of the proposed project require to be relocated.
Agra: The flooding and water logging disrupted the daily life of thousands of people living in several colonies along the river in the city. Parts of Mehtab Bagh, Taj View point, temples and crematoria were submerged affecting the tourism activities. The flood level reached the outer wall of the Taj Mahal which had also happened in July 2023. Over 60 villages were impacted by the flood spell. A deluge in Utangan river around same time further aggravated flood situation in rural areas of the district. The ancient temples along the river in Bateshwar underwent several feet of flood water. (Reports 1, 2, 3, 4, 5, 6)
The deluge left a thick layer of silt across the 400-year-old underground chambers of Itmad-ud-Daulah as flood waters entered at least 12 underground cells, damaging several wooden doors. Even the marble fish emblem on the rear platform was completely submerged, indicating the unusually high-water levels this year as per the official from the Archaeological Survey of India (ASI). ASI records show the monument has faced similar flooding before in 1924 and in 1978 when nearly eight feet of silt accumulated in the chambers. The satellite images showing scale of flood in the river in Agra can be seen here.
Finally, it is clear that the July 2023 and Sept. 2025 flood spells in Yamuna have left several questions which needs timely answers from all respective governments. Despite moderate flood volume, the impact and damage have been profound primarily due to unchecked riverbed mining, increasing siltation, floodplain encroachment and opaque operation of barrages.
Upstream Delhi the sand mining has considerably lowered the riverbed while siltation has become a serious problem in Delhi, Mathura and Agra cities. The riverfront projects, farmhouses and colonies being built in floodplain in Delhi, Noida, Faridabad, Mathura and Agra have further ruined the flood absorption capacity of the river. It is strange that the govt is proposing heritage city and riverfront project in Mathura in active floodplain of river making them vulnerable to flood damages apart from altering the rivers flooding capacity and pattern.
The cross-sectional embankments of new bridges in active floodplain have greatly been obstructing the flood passage. The recently built bridges at Nagli in Yamuna Nagar, Shergarh Tapu in Karnal, Smallkha in Panipat, Manjhawali and Eastern Peripheral Expressway are example of such bridges which have significantly disrupted the lateral and longitudinal connectivity of the river and its floodplain.
In absence of hourly discharge data of Wazirabad, Okhla and Gokul barrages, their role in aggravating the flood situation in downstream areas is always under suspicion.
The flood spells of 2023 and 2025 have also underlined that the flood carrying capacity and flooding pattern of the Yamuna is changing due to these factors. If necessary steps are not taken to map, manage and protect the river floodplain in holistic manner and on urgent basis, the impact and damage from high floods in future is bound to be bigger and worse.
SANDRP
You may also like to see our other Yamuna flood blogs relevant and useful.
Sept 2025: Why did Yamuna Repeat July 2023 Like Flood Spell in Delhi?
Did Ichari, Vyasi Dams Influence Yamuna Floods in 2025?
July 2023 Delhi Floods: Why Unprecedented Yamuna Water Levels even at moderate releases?
