
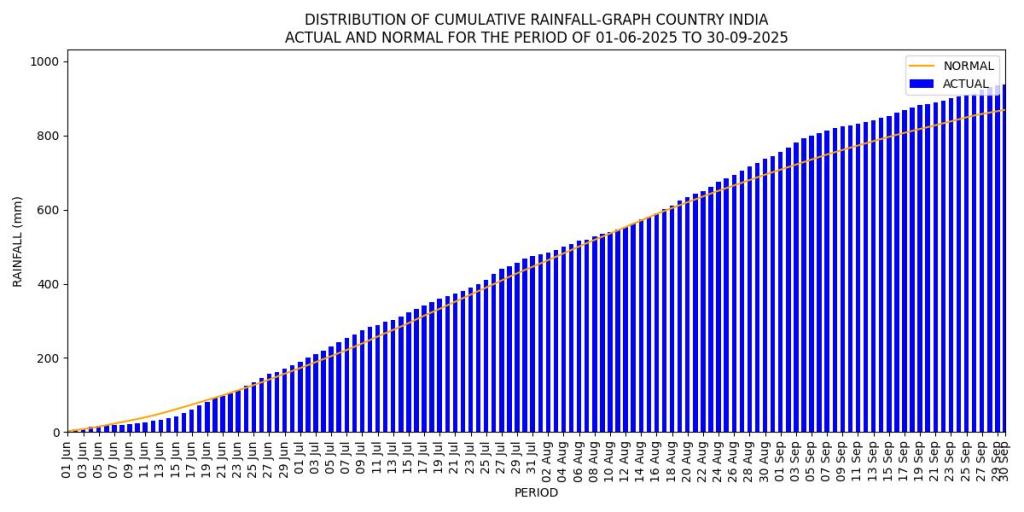
In the just concluded South West Monsoon 2025, India received 937.2 mm (934.8 mm in SW Monsoon 2024, 820 mm in SW Monsoon 2023, 925 mm in SW Monsoon 2022[i]) rainfall, about 107.9% (107.6% in 2024, 94.45 % in 2023, 106.5% in 2022) of the Normal SW Monsoon rainfall of 868.6 mm as per India Meteorological Department (IMD). This rainfall is categorised as normal rainfall. The rainfall in SW monsoon 2025 is 5th highest since 2001 and 38th highest since 1901.
In SW Monsoon 2021, the rainfall was 874.6 mm, 0.68% below normal rainfall. In SW Monsoon 2020, the rainfall was 956.7 mm, or about 8.74% above normal and in SW Monsoon 2019 it was 10.4% above normal.
Monsoon has yet to withdraw from India till Sept 30, when IMD closes its SW Monsoon record books. The monsoon after 8 am on Sept 30 will be counted in post monsoon rainfall. The monsoon is likely to take another couple of weeks to withdraw from the country and this may also delay the onset of NE Monsoon, that is active mainly in some parts of South India.
Monthly Rainfall The Month wise rainfall during the SW Monsoon 2025 was as follows.
| Month | Actual Rainfall, mm | Normal Rainfall, mm | % Departure |
| June | 180.0 | 165.3 | 108.9 |
| July | 294.3 | 280.5 | 104.9 |
| Aug | 268.8 | 254.9 | 105.5 |
| Sept | 194.1 | 167.9 | 115.6 |
| SW Monsoon 2025 | 937.2 | 868.6 | 107.9 |
Interestingly, it is for the first time in last four years that June rainfall is above normal. July and Sept rainfall has been above normal in all years from 2022 to 2025.
As we can see from the table above, the rainfall varied from over 4.9% above normal in Jun to 15.6% above normal in Sept. There has been even wider variation spatially and temporally, but we do not have an index of rainfall distribution over time and space that captures these variations. What we need is an index of rainfall that will not only capture the quantum of rainfall as it does today, but also the temporal and spatial distribution of rainfall across the monsoon and across the nation or states. This will give a better picture of the monsoon rainfall and would also help us understand how this index is changing.
Forecast Vs Actual IMD Press Release of Sept 30 2025[ii] said the forecast date for SW Monsoon onset in Kerala was 27 May 2025 and actual date was 24 May 2025, which was within the error band of +/- 4 days.
The forecast of monsoon rainfall for the country as a whole in April 2025 was 105 +/- 5% and in the end of May was 106 +/- 4%. The actual rainfall was 108%, so it is within the error margin of forecast.
The forecast vs actual situation for the different zones were as follows:
| Forecast rainfall, % of LPA | Actual Rainfall, % of LPA | % Actual Vs % Forecast Departure | |
| North West India | 108 | 127 | 19 |
| Central India | 106 | 115 | 9 |
| E & NE India | 94 | 80 | 14 |
| South India | 106 | 110 | 4 |
| Core ZOne | 106 | 122 | 16 |
LPA: Long Period Average
It is clear from the above table that the departure between forecast and actual rainfall is very significant for North West India (19%), Core Zone (16%), E & NE India (14%) and Central India (9%).
Region wise rainfall IMD divides India into four regions and reports rainfall for each of the region as follows for SW Monsoon 2025. It also provides rainfall for what it calls “Monsoon Core Zone” that includes most of the rainfed areas of India.
| Region | Actual Rainfall, mm | Normal Rainfall, mm | % departure |
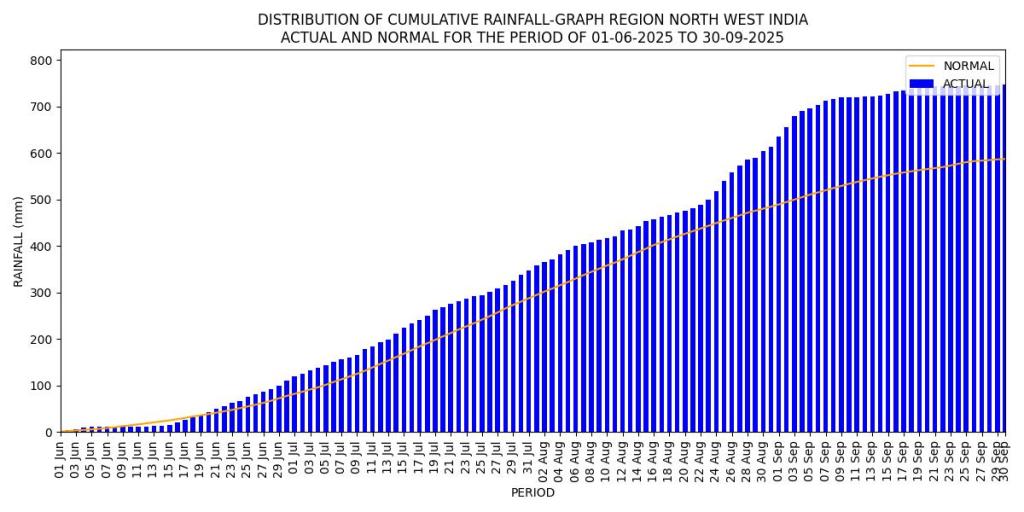
| North West India | 747.9 | 587.6 | 127 (107) |
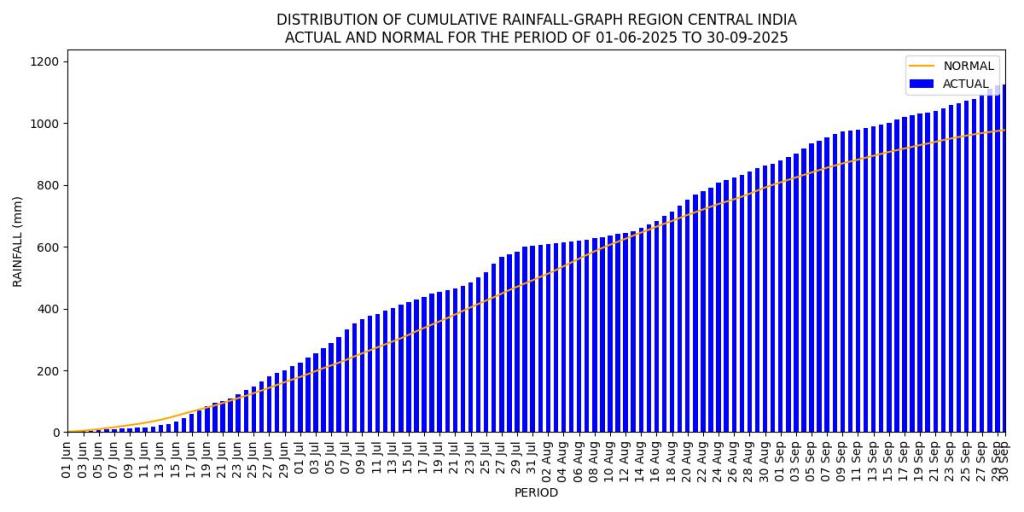
| Central India | 1125.3 | 978 | 115 (119) |
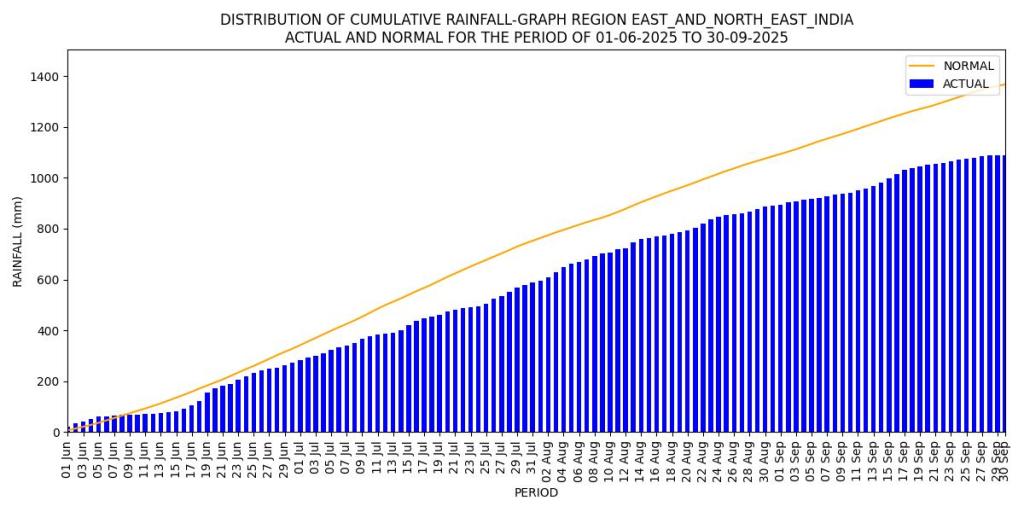
| E + NE India | 1089.9 | 1367.3 | 80 (86) |
| South India | 787.4 | 716.2 | 110 (114) |
| Monsoon Core Zone | 1015.8 | 832.2 | 122 (122) |
Note: The figures in bracket in last column are for SW Monsoon in the previous year.
It is clear from the table that the rainfall in SW Monsoon 2025 was lower than the rainfall in the SW monsoon 2024 in all zones, except the North West India, which is so much higher than it makes the all India monsoon rainfall for 2025 higher that that in 2024. It is. Also clear that E & NE India again saw below normal rainfall.
Region wise rainfall graphs The first bar chart below is for the National Rainfall figure for the SW monsoon period from June 1 to Sep 30 2025. The IMD divides the country into four regions.
As can be seen from the following graph, the East and North East India had 20% below normal for SW Monsoon 2025 (14% below normal in SW Monsoon 2024 and 18% below normal in SW Monsoon 2023). IMD chief Mrutyunjay Mohapatra said, “Rainfall over east & northeast India has been deficient in many years in recent times. There is a trend that shows that the rainfall over this region is decreasing since 2020. Studies also show that rainfall over the region has decreased in the last 20 years.” The rainfall in E and NE India this year was second lowest since 1901.
The North West India ended the SW Monsoon 2025 with huge 27% surplus (7% above normal in 2024, 1% surplus in 2023). The NW Rainfall was highest since 2001 and sixth highest since 1901.
The Central India ended the SW Monsoon 2025 with 15% above normal rainfall (19% above normal in 2024, 0% surplus or deficit in 2023).
The South Peninsular India had surplus rainfall at 10% at the end of SW Monsoon 2025 (14% above normal in 2024, 8% deficit in 2023). (Bar Graph is not available for this region on IMD Website)
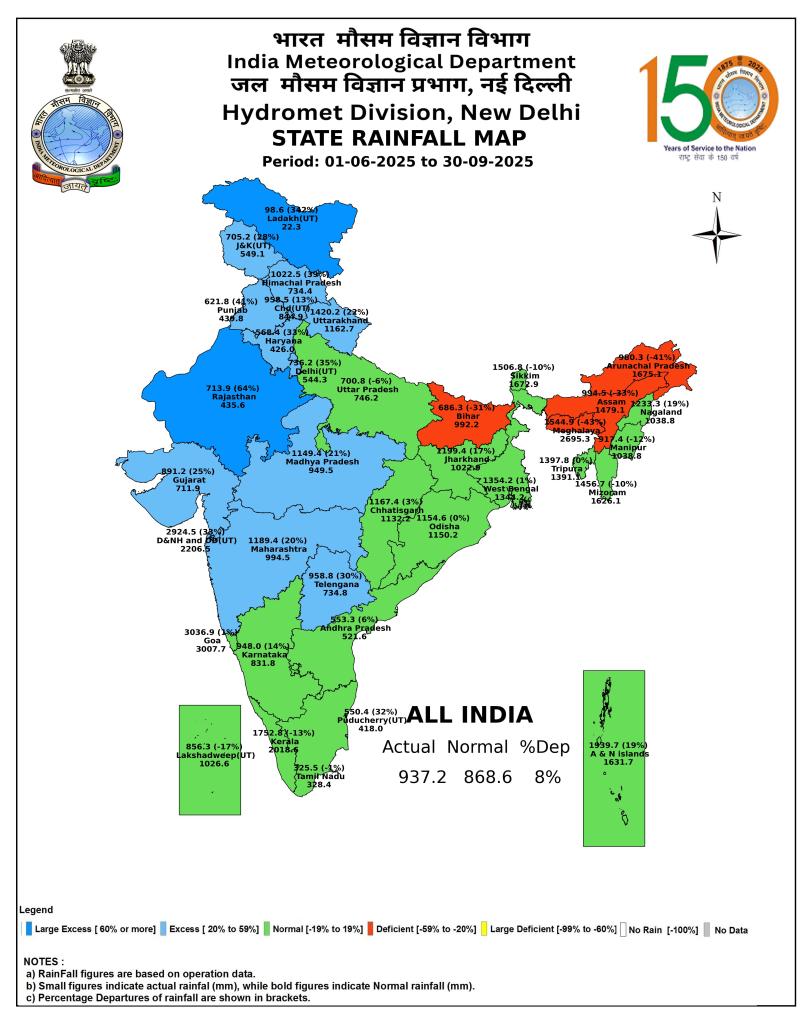
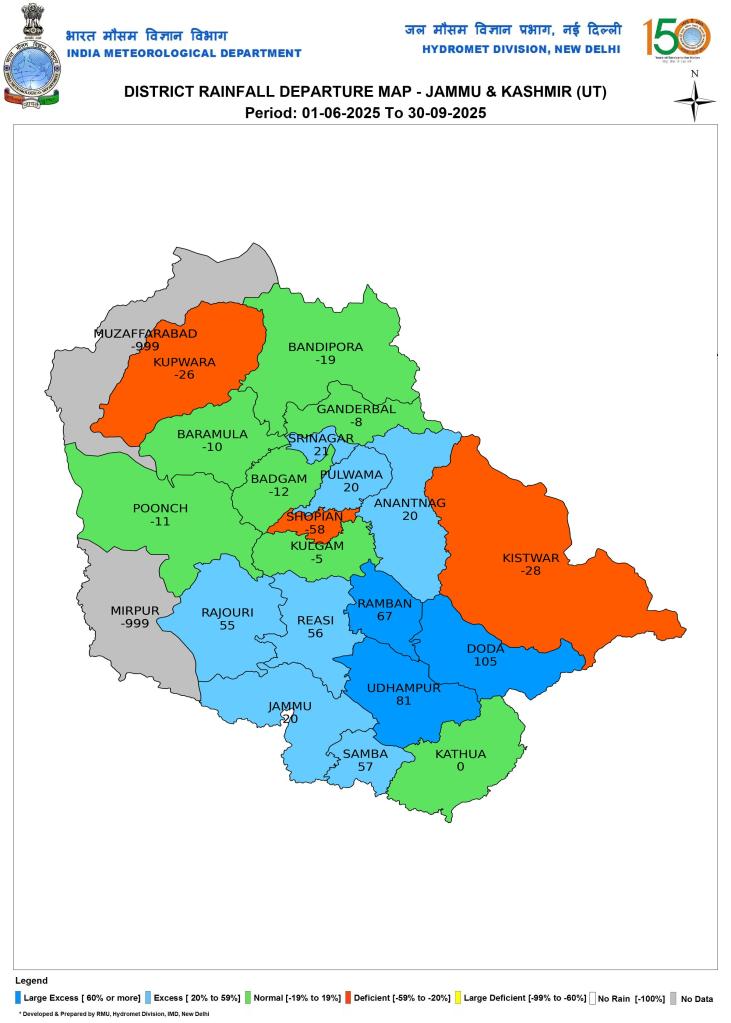
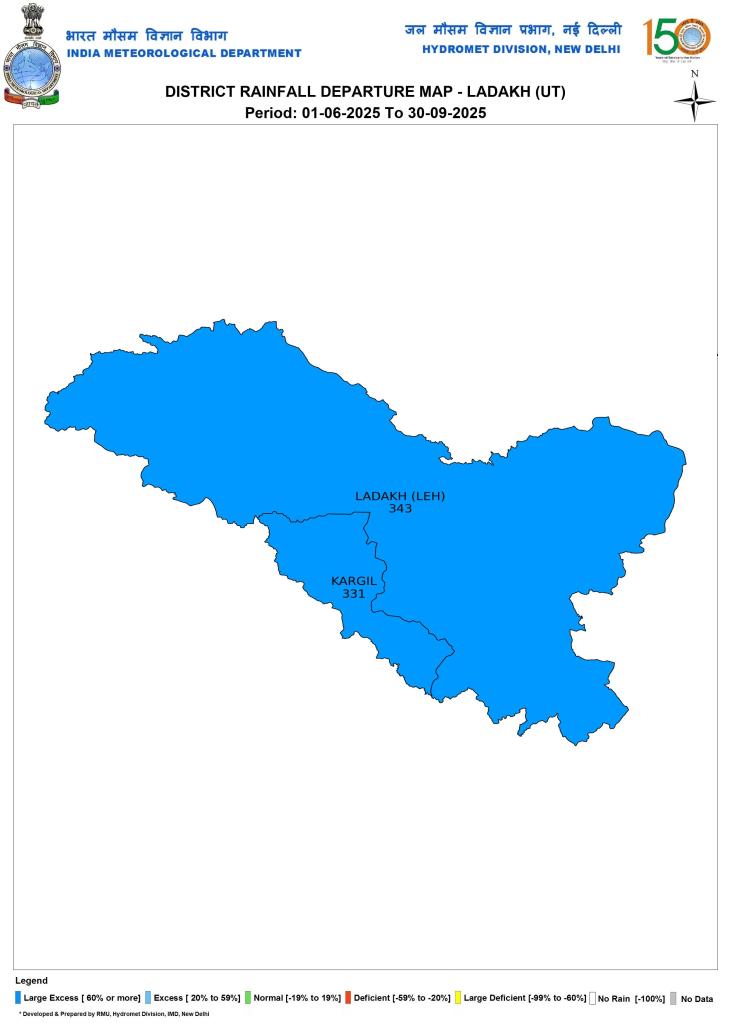
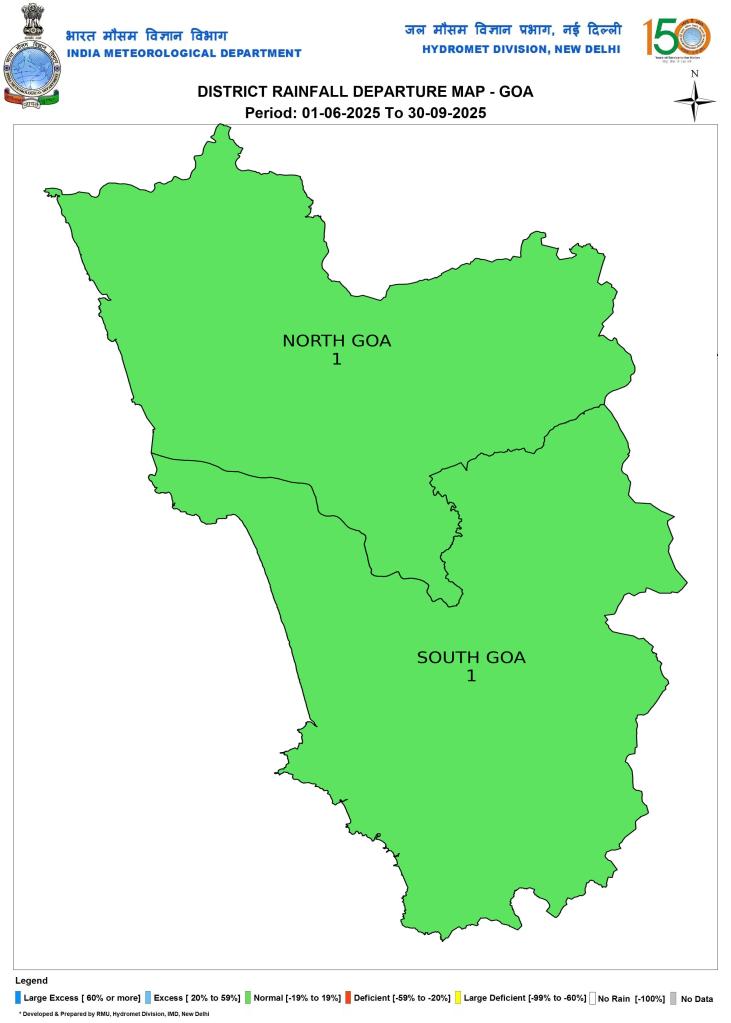
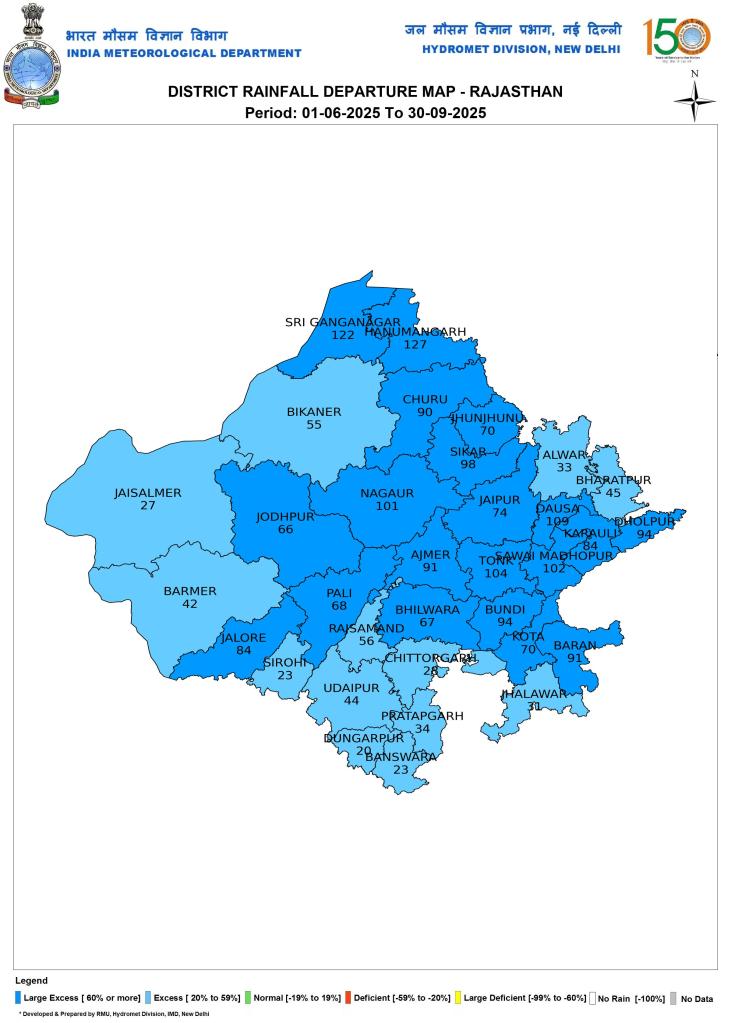
State wise Rainfall As we can see from the IMD map above, in the four month long South West Monsoon 2025, out of 35 States and Union Territories (UTs), Two (Rajasthan and Ladakh) had Large Excess, Twelve had Excess (Actual rainfall 20-59% above normal), 17 had normal (Actual rainfall 19% below normal to 19% above normal), Four (Bihar, Meghalaya, Assam, Arunachal Pradesh) had deficit (Actual rainfall 20-59% below normal rainfall) and none had Large Deficit (Actual rainfall over 60% below normal) in rainfall. Ladakh had the lowest rainfall (like in 2022-2024) at 98.6 mm and highest surplus at 342%. Goa had the highest rainfall (like in 2022-2024) at 3036.9 mm.
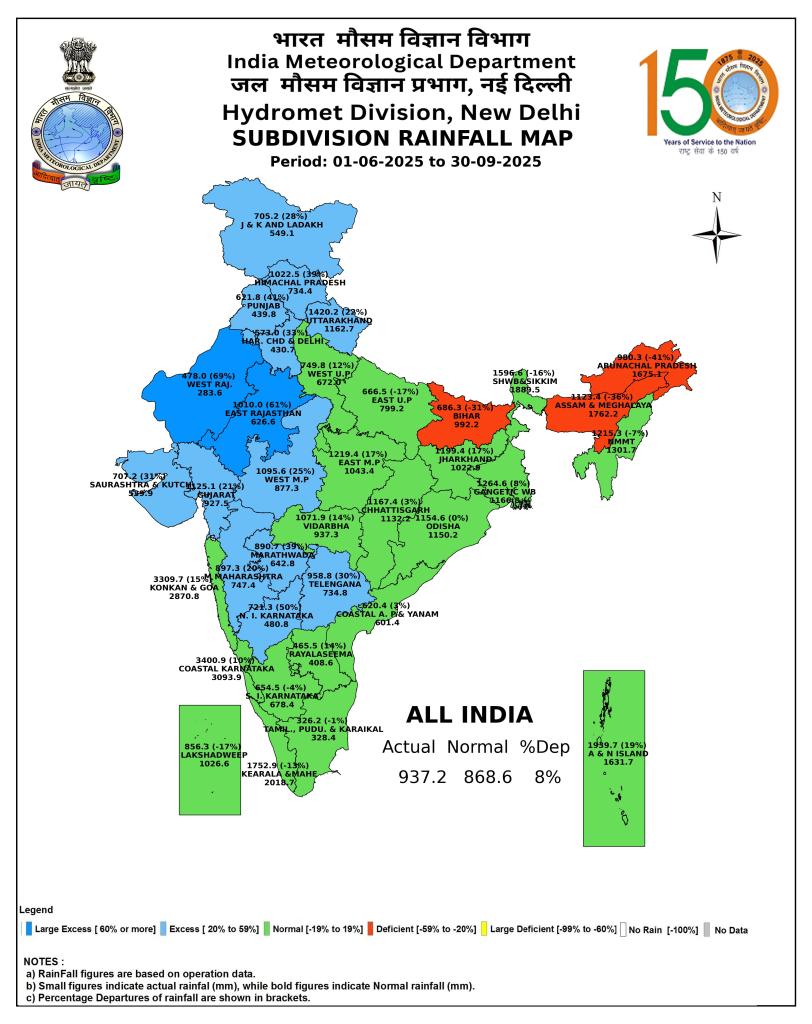
Sub Division wise rainfall IMD divides India into 37 meteorological divisions (the logic of many of them is questionable). As we can see from the IMD map of Sub Division wise rainfall above of SW Monsoon 2025, 2 sub divisions (E & W Rajasthan) had Large Excess rainfall, Twelve sub divisions had excess rainfall, 20 had Normal rainfall and 3 (Bihar, Assam-Meghalaya and Arunachal Pradesh) had deficit rainfall. Coastal Karnataka had the highest rainfall at 3400.9 mm and TN-Puducherry-Karaikal had the lowest at 328.4 mm rainfall. West Rajasthan had the highest surplus rainfall % at 69%. Arunachal Pradesh (like in 2024) had the highest deficit rainfall % at 41%.
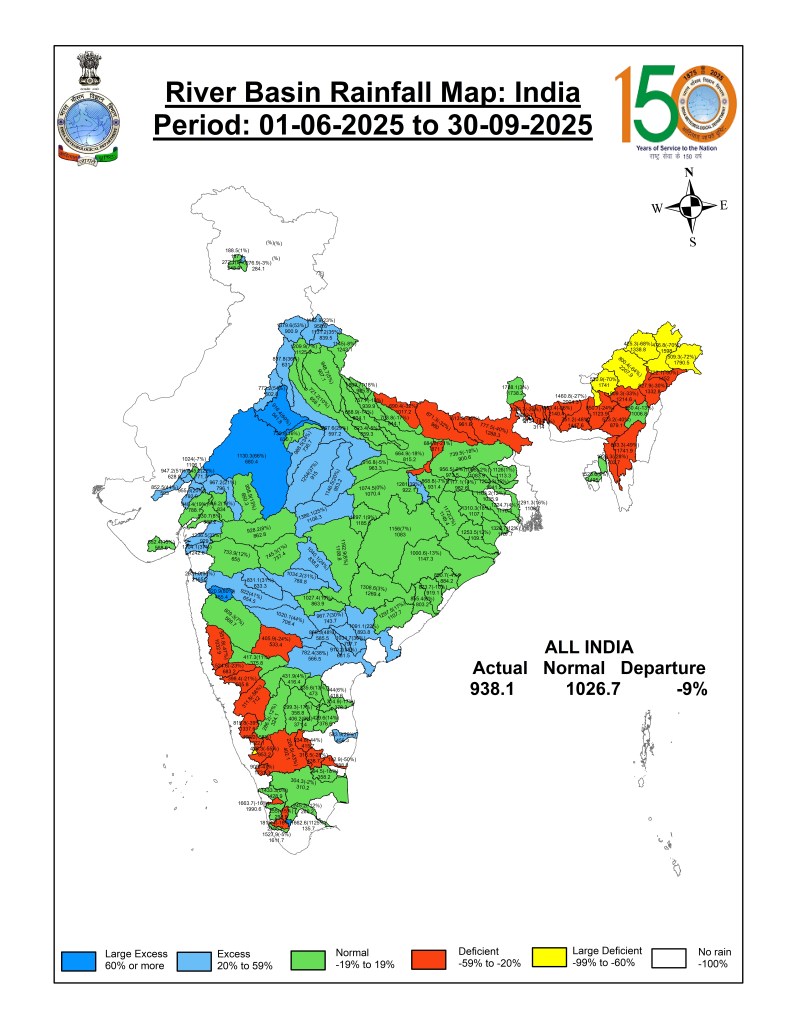
River Basin wise Rainfall As we can see from the IMD’s river basin wise rainfall map above, IMD also reports river basin wise rainfall. However, as we have been noting in the past, this reporting remains rather callous and inadequate, unfortunately, though IMD would know that it is much more important to provide accurate figures of river basin wise and sub basin wise rainfall figures.
This is clear from the map, where was can see that IMD reports NO DATA in whole of the four month long monsoon 2025 for large number of river basins. It also provides no name for any of the river basins or sub basins on the map.
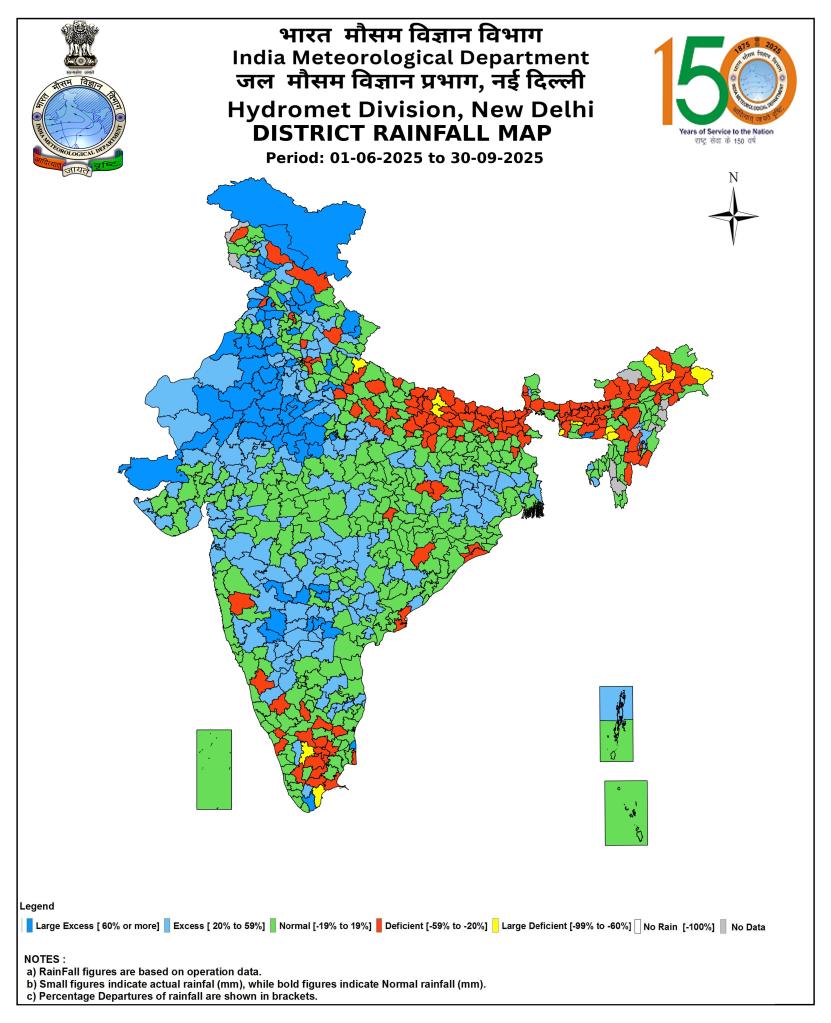
All India District wise rainfall departure map The map below provides district wise picture of rainfall at all India level.
DISTRICT WISE STATE WISE RAINFALL
NORTH INDIA: Jammu & Kashmir
Ladakh
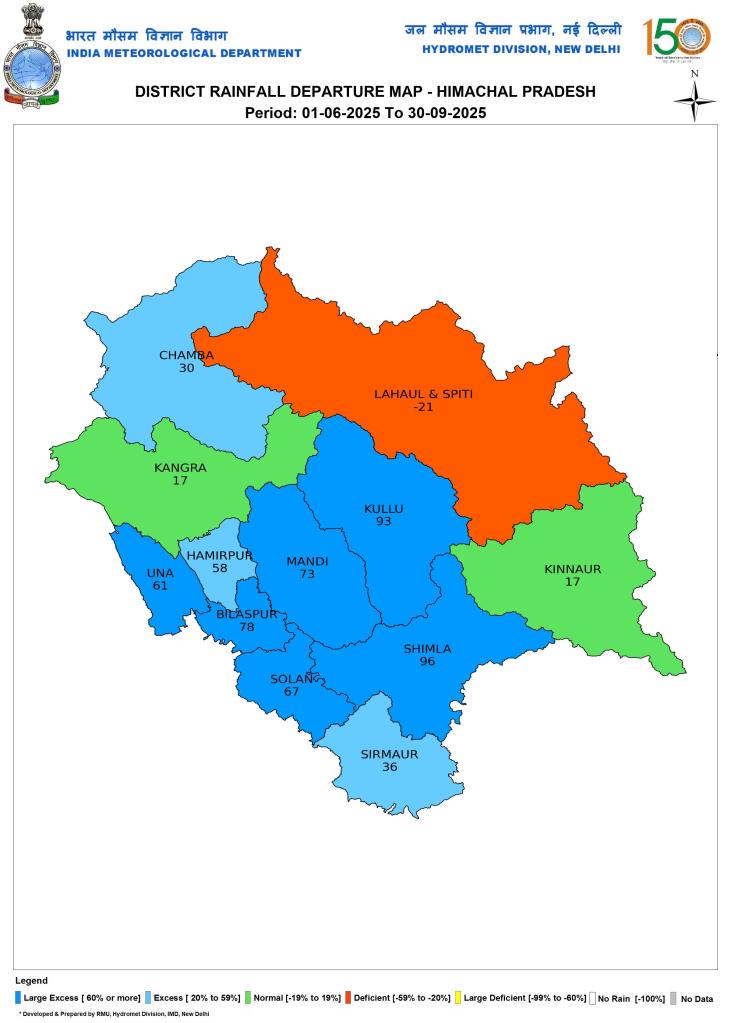
Himachal Pradesh Himachal Pradesh witnessed this year the wettest monsoon after 29 years. This year, the state recorded its 15th highest rainfall since the 1900. The highest ever rainfall that has been reported in Himachal Pradesh is 1,314 mm, which was recorded in 1922. Himachal Pradesh, this year received around 1,022 mm rain during the past three months as compared to normal rainfall of 734.4 mm during the monsoon in HP.
In June, the state recorded 34 per cent surplus rain as it recorded 135 mm rain against 101.1 mm rain, with Shimla, Mandi, Solan, Hamirpur and Sirmaur districts receiving the highest precipitation. In July, the state recorded 2 per cent rain deficit as it received 250.3 mm rain as compared to 255.9 mm. In August it received 431.3 m rain as compared to 258.6 mm normal average rain making it 68 per cent more than normal rain. September emerged as the wettest month of this year’s monsoon season as it recorded 205.7 mm rain against 120.6 mm, which was 71 per cent higher than average normal. Himachal Pradesh experienced 36 days of very heavy rainfall during the season with four days in June, eight in July, 15 in August and nine days in September.
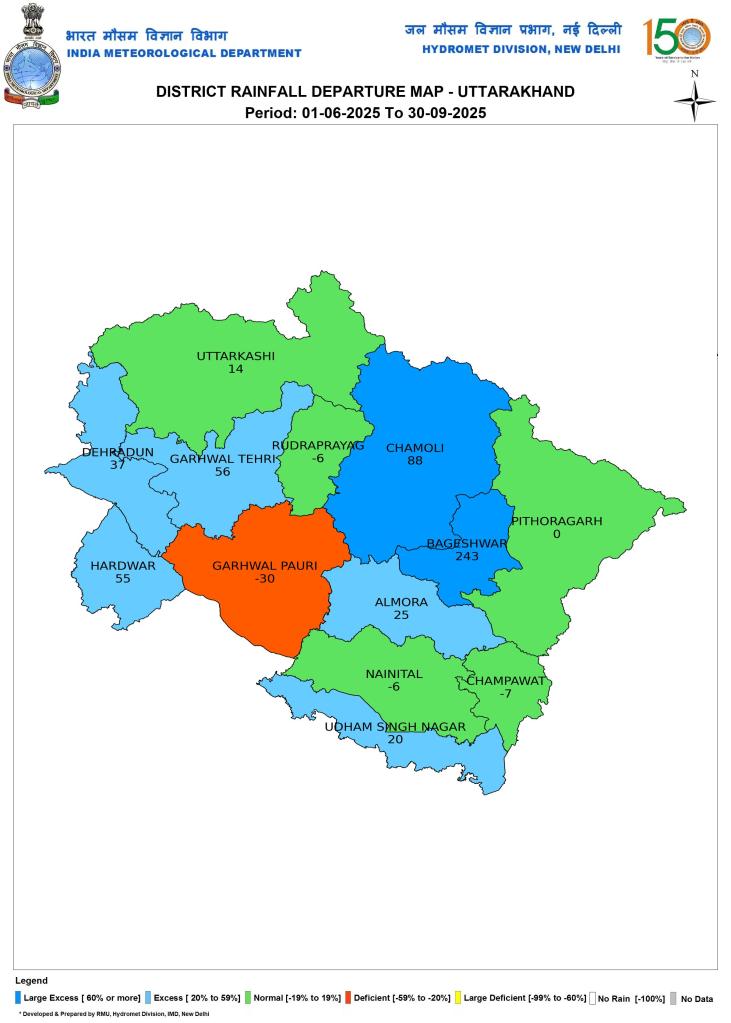
Uttarakhand
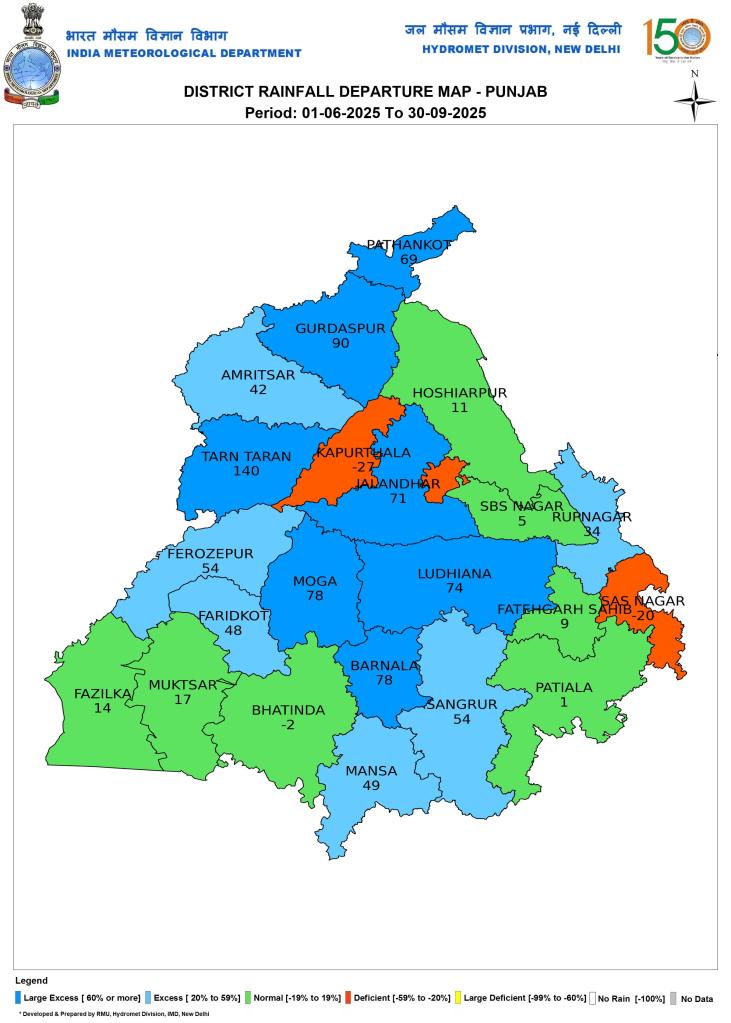
Punjab
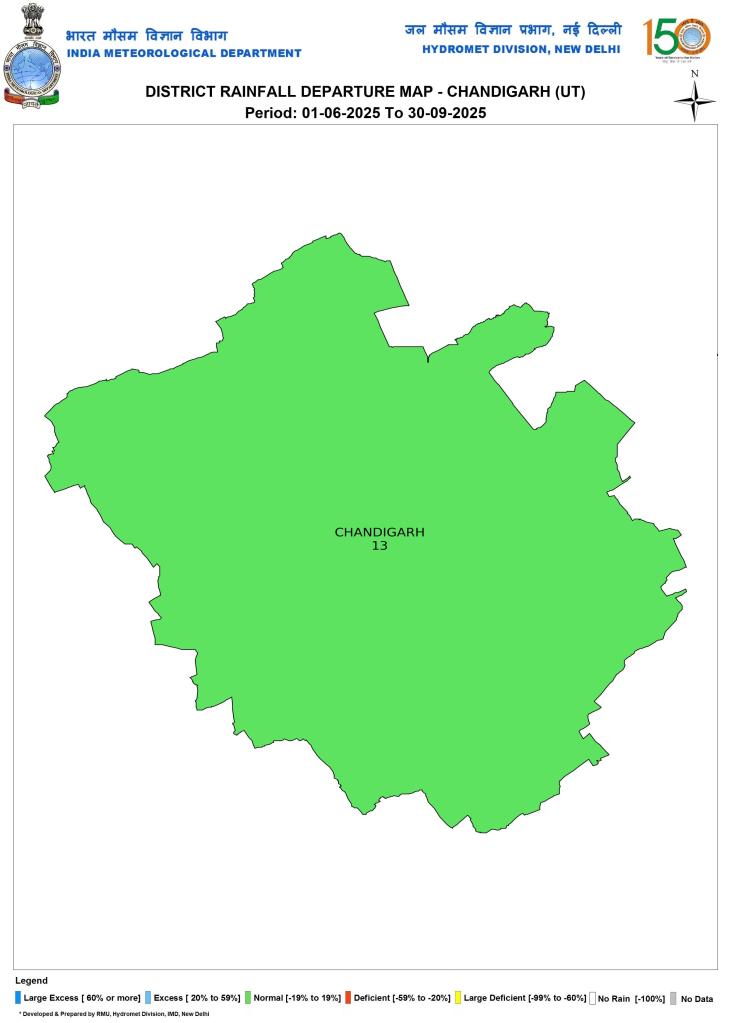
Chandigarh
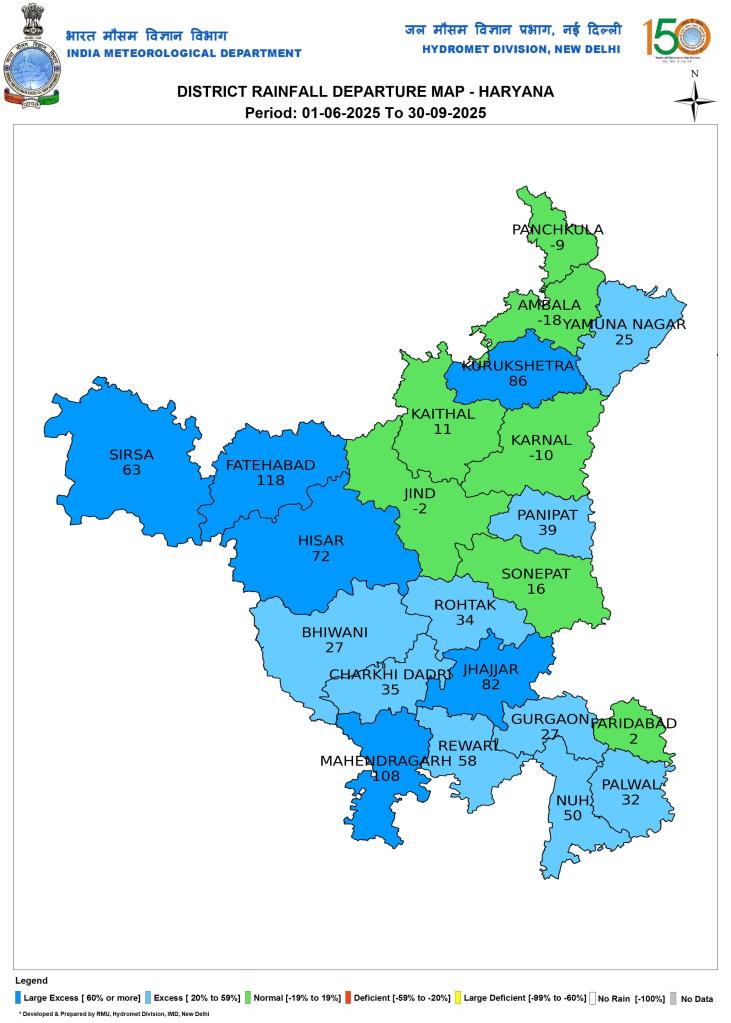
Haryana
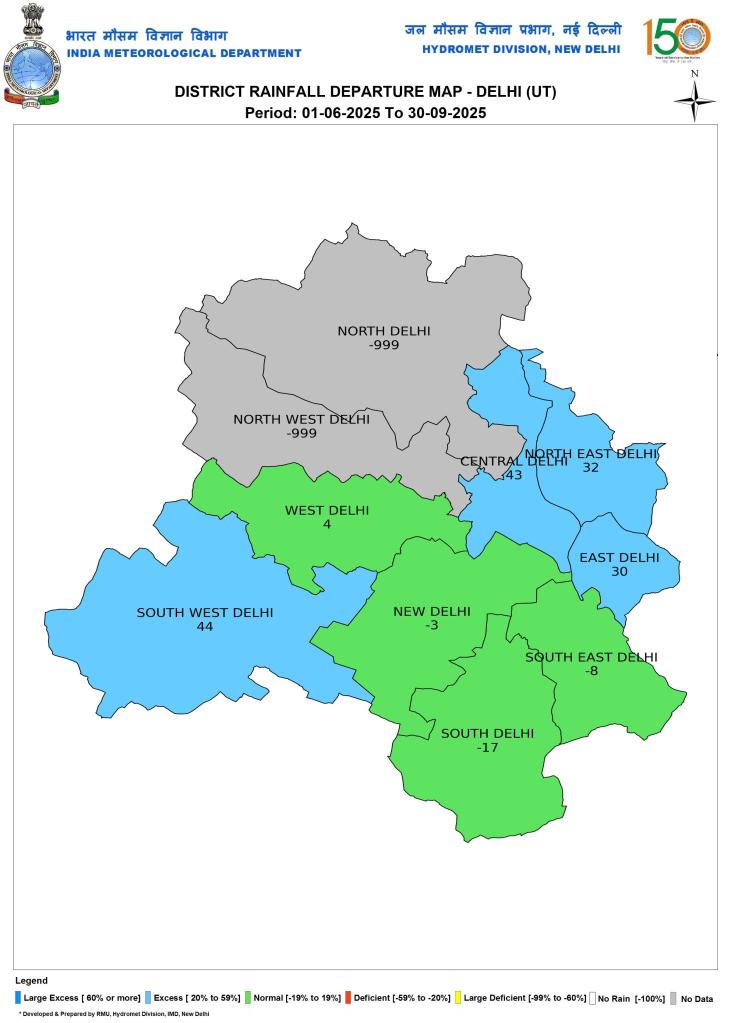
Delhi
EAST INDIA
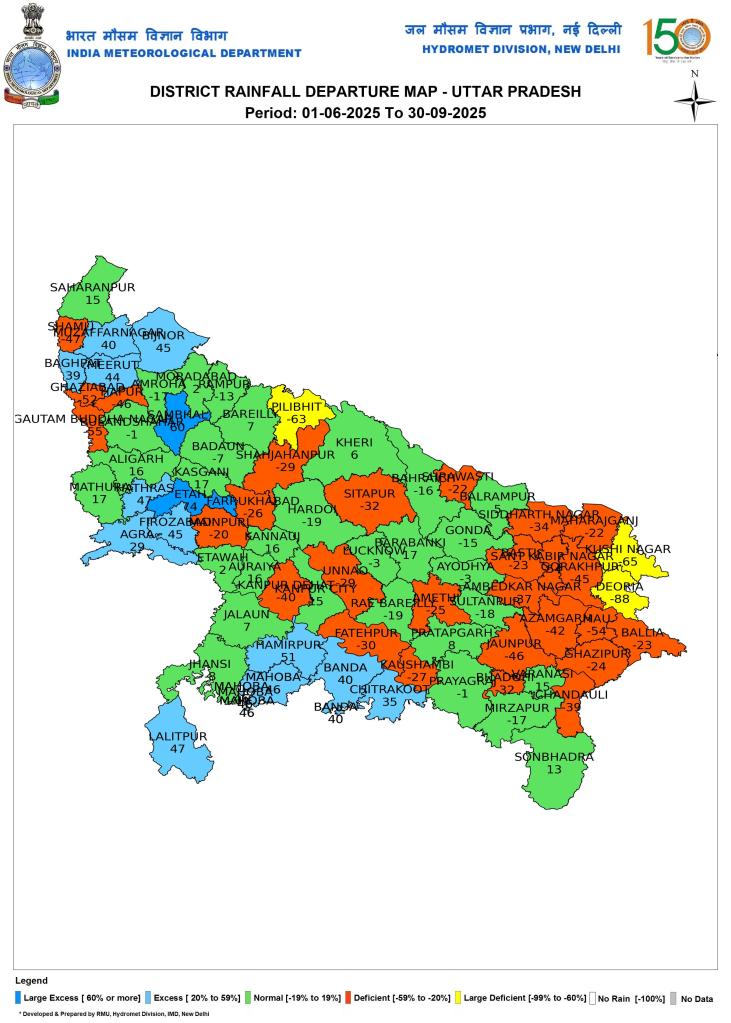
Uttar Pradesh
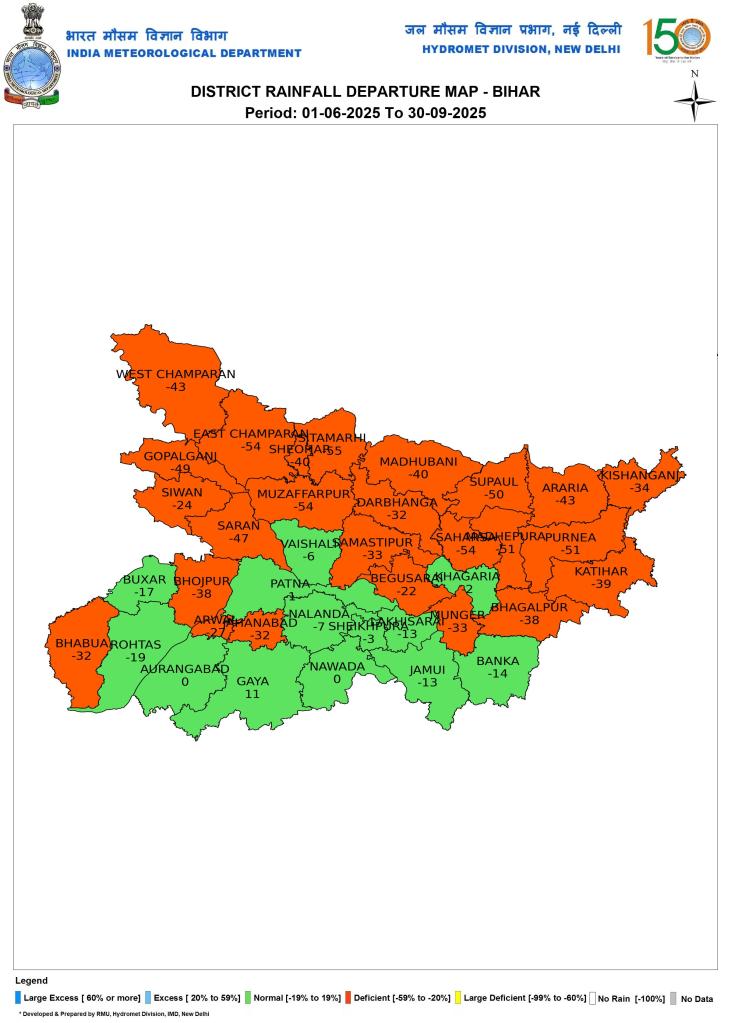
Bihar
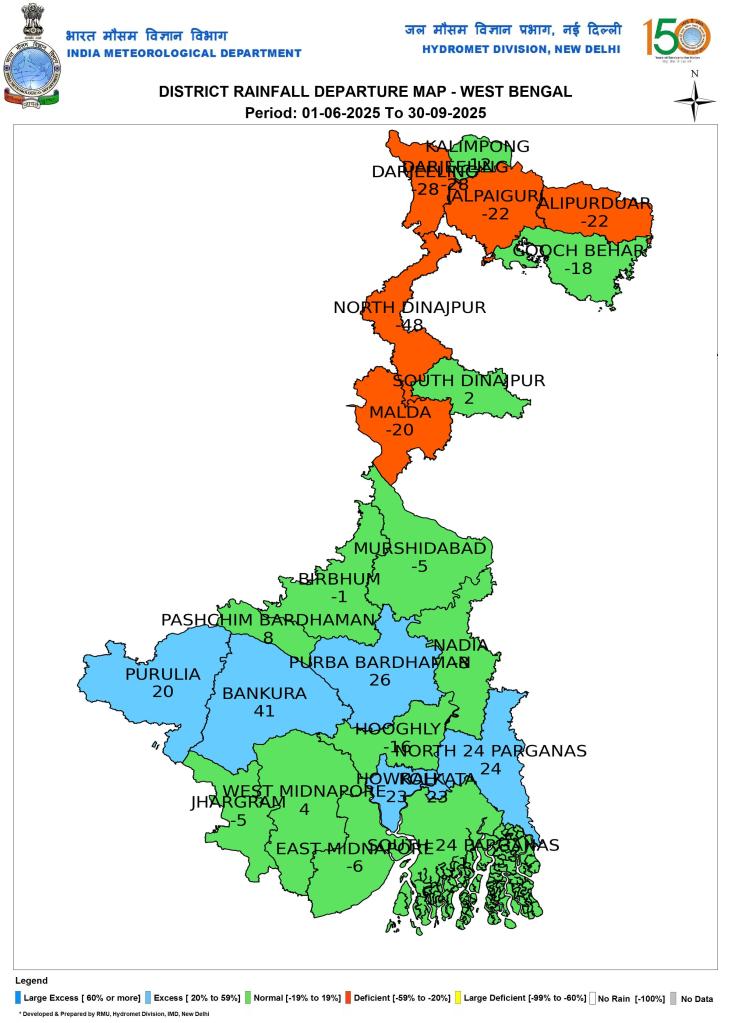
W Bengal
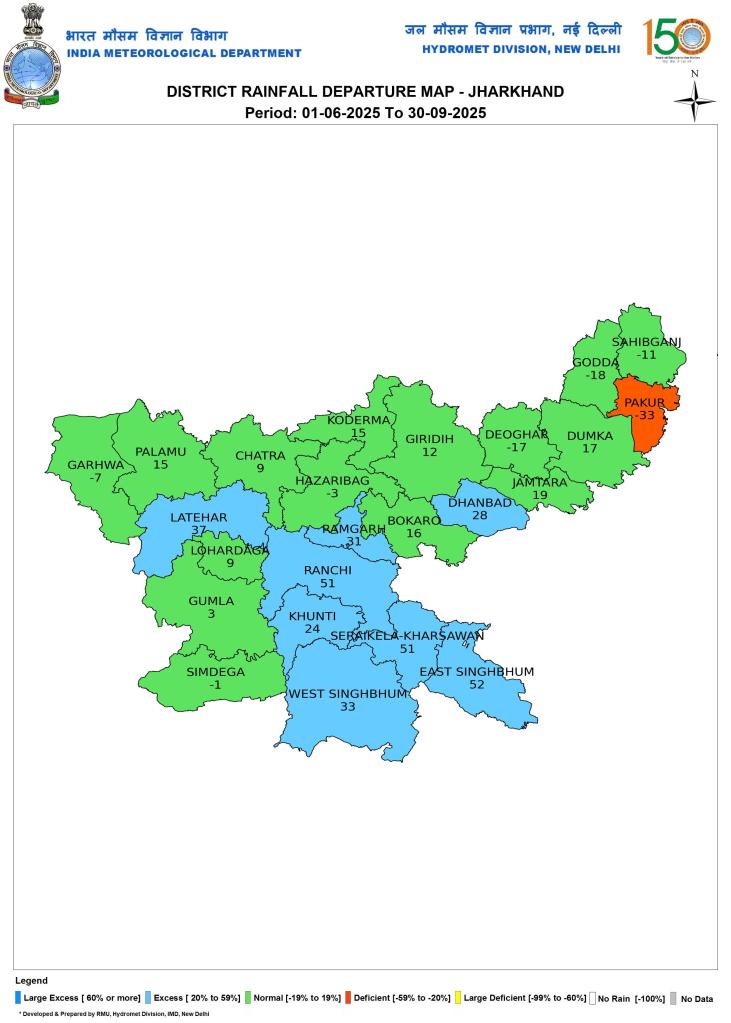
Jharkhand
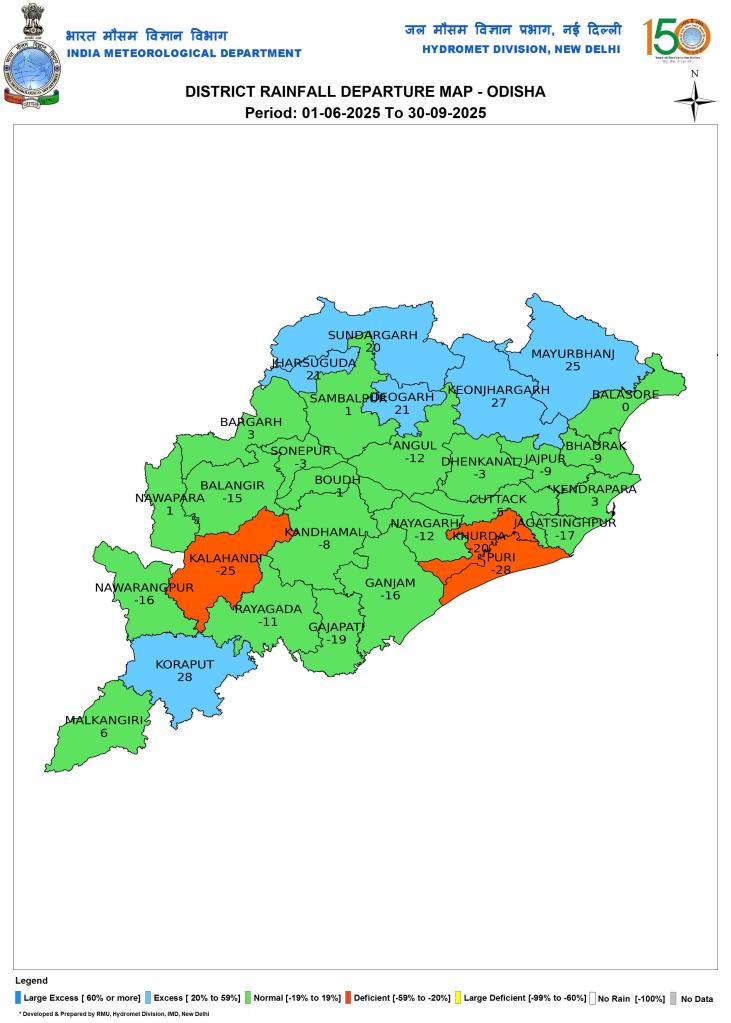
Odisha
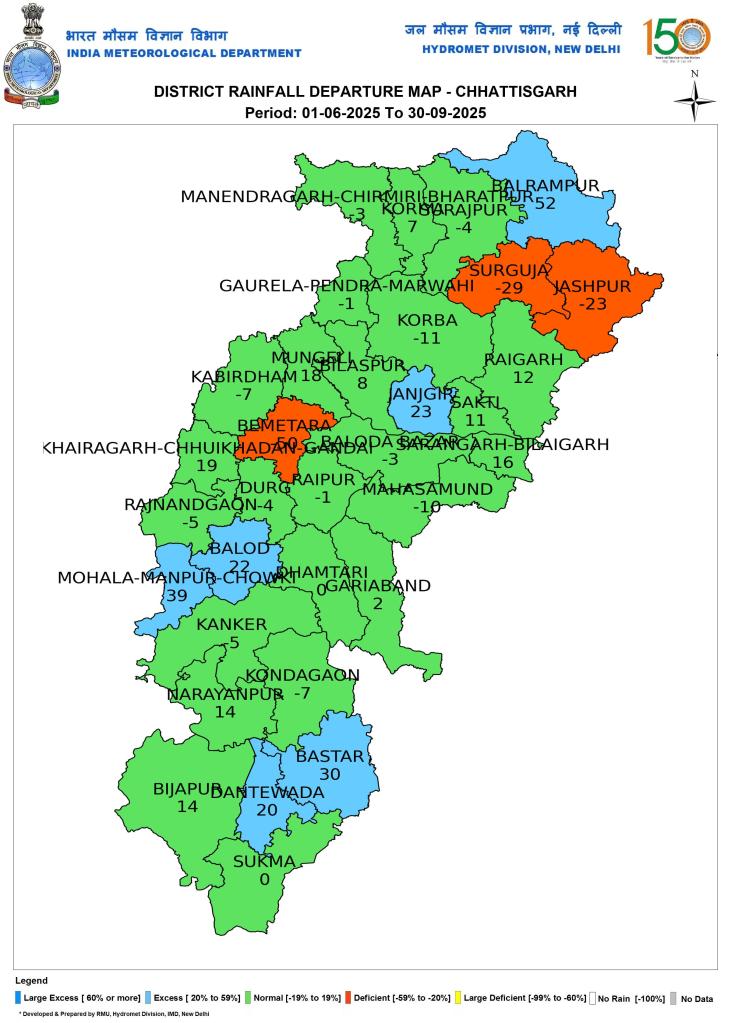
Chhattisgarh
NORTH EAST INDIA
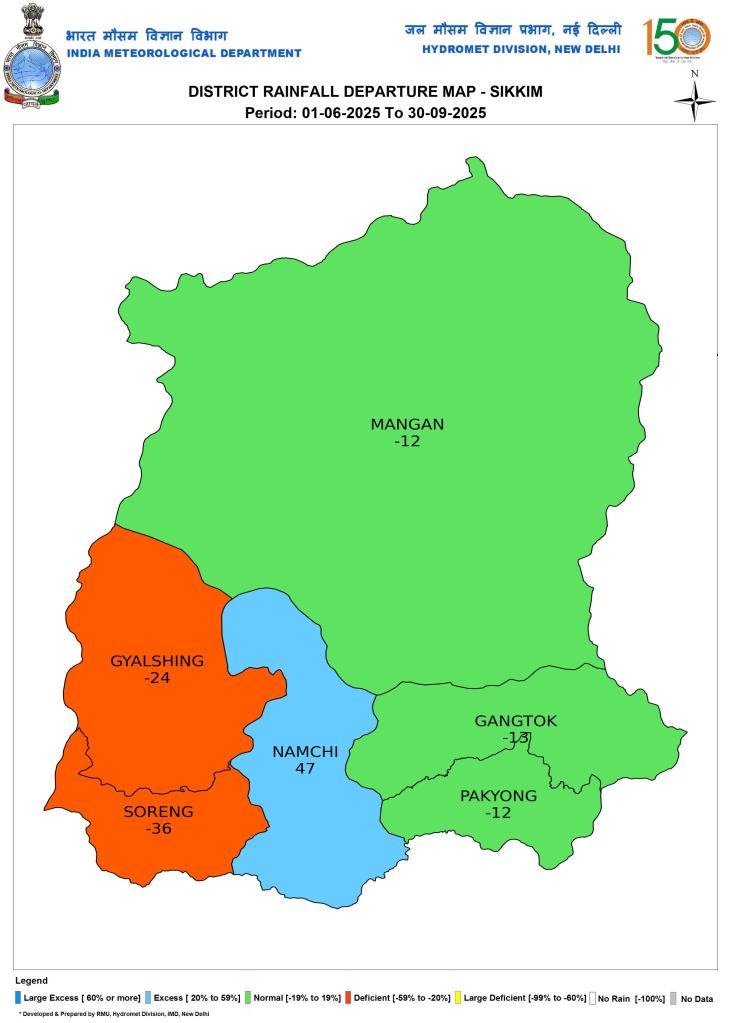
Sikkim
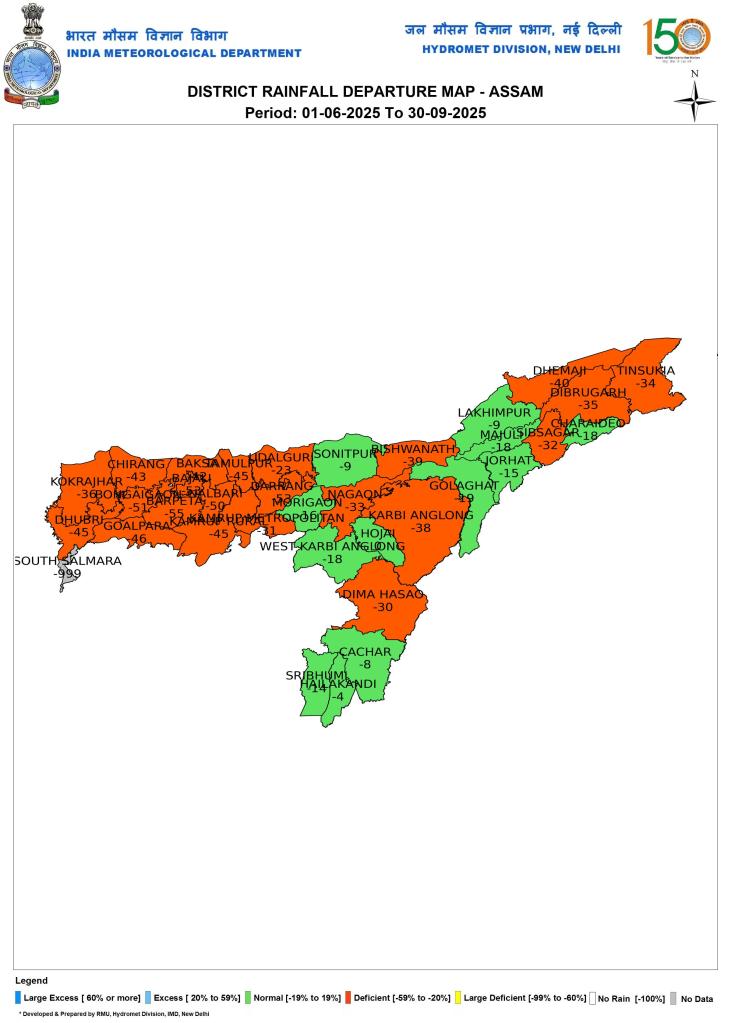
Assam
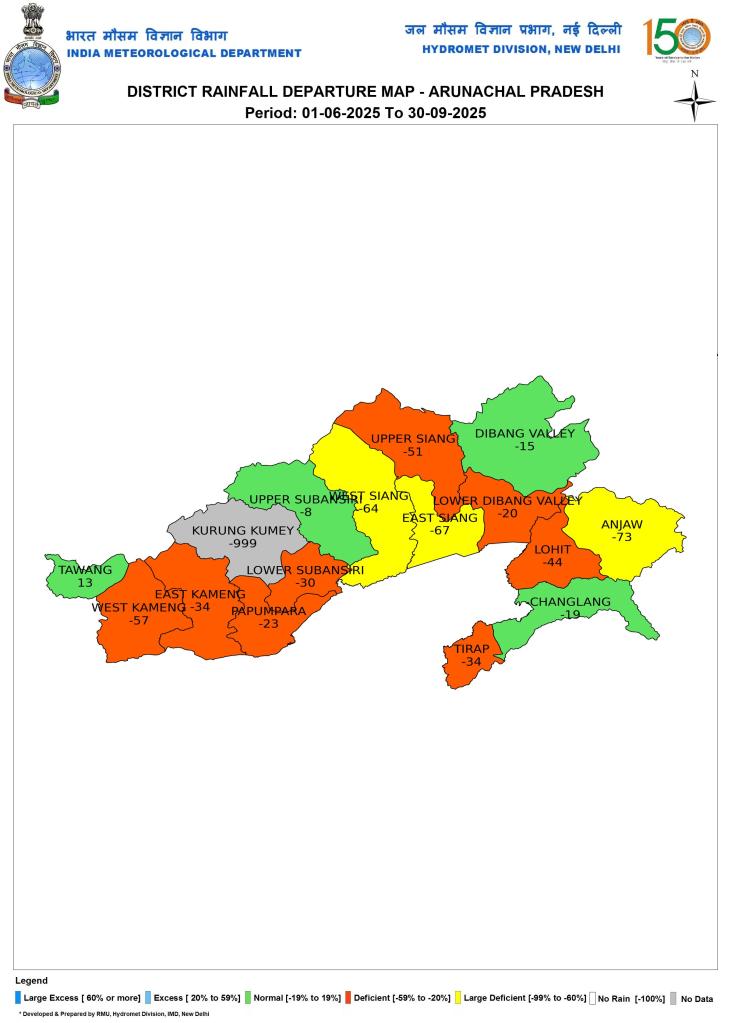
Arunachal Pradesh
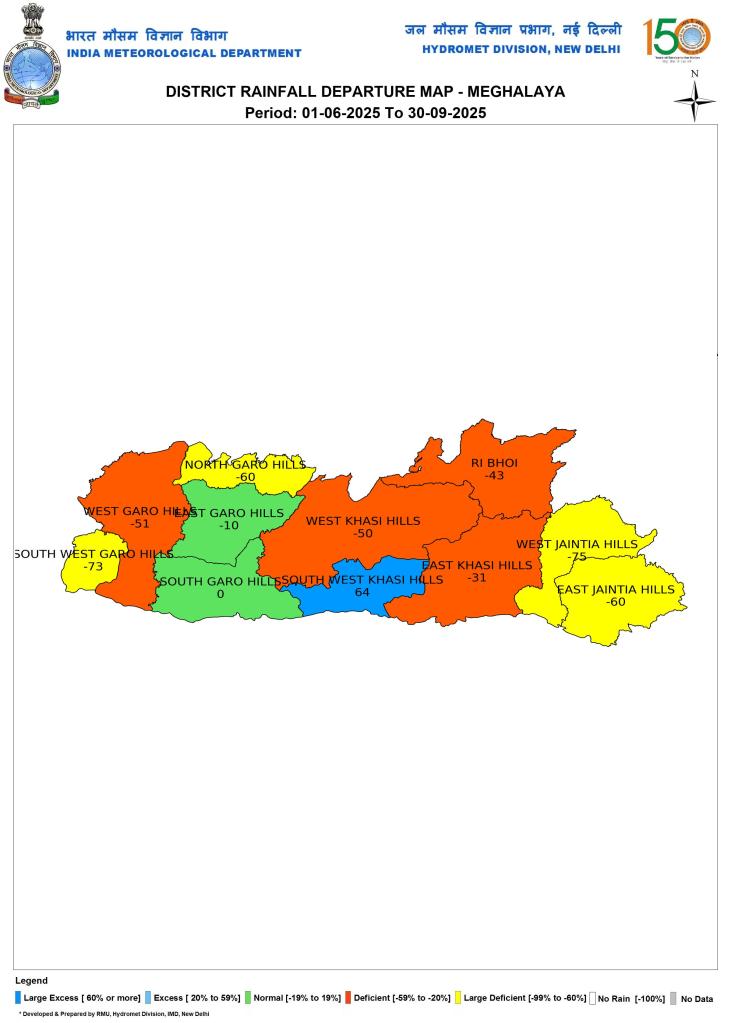
Meghalaya
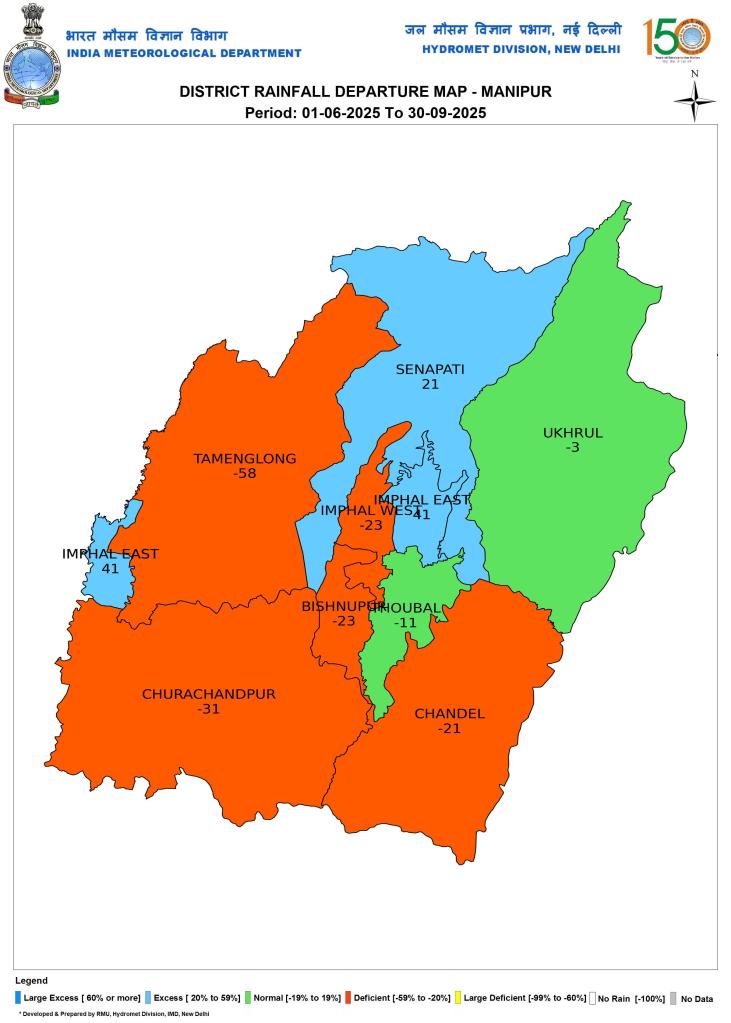
Manipur
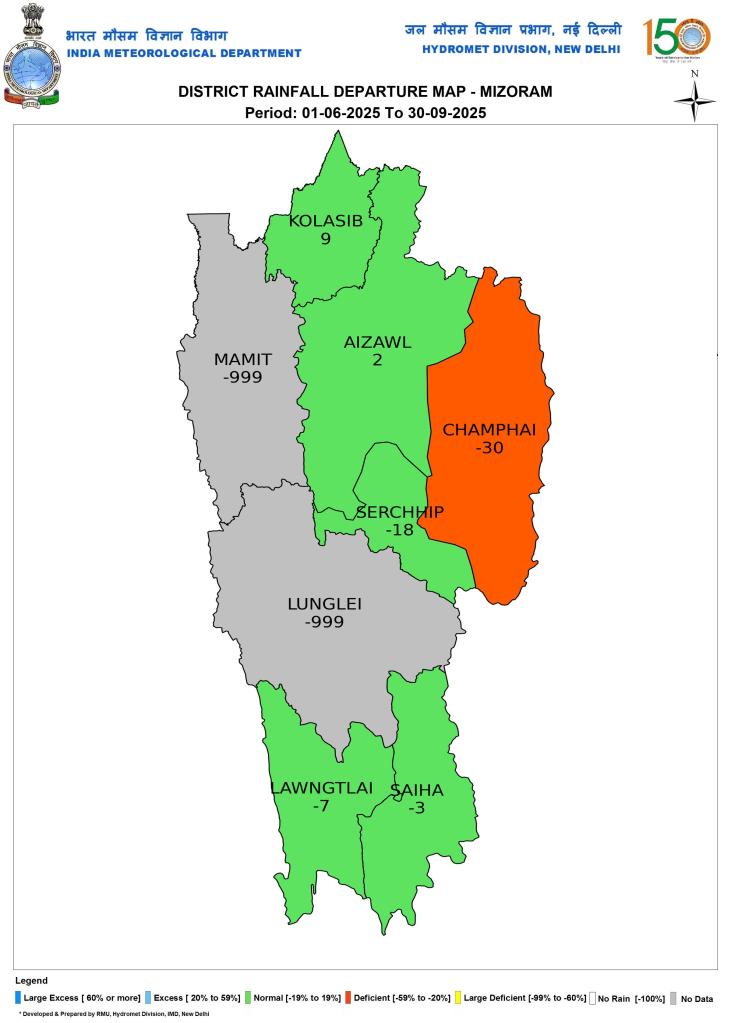
Mizoram
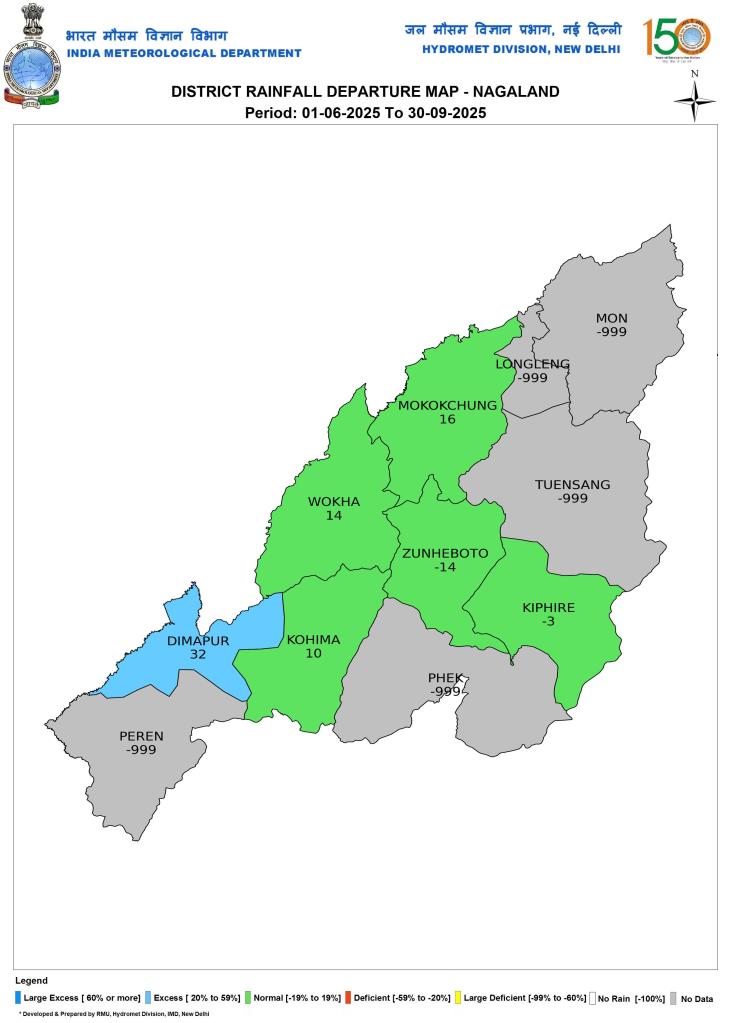
Nagaland
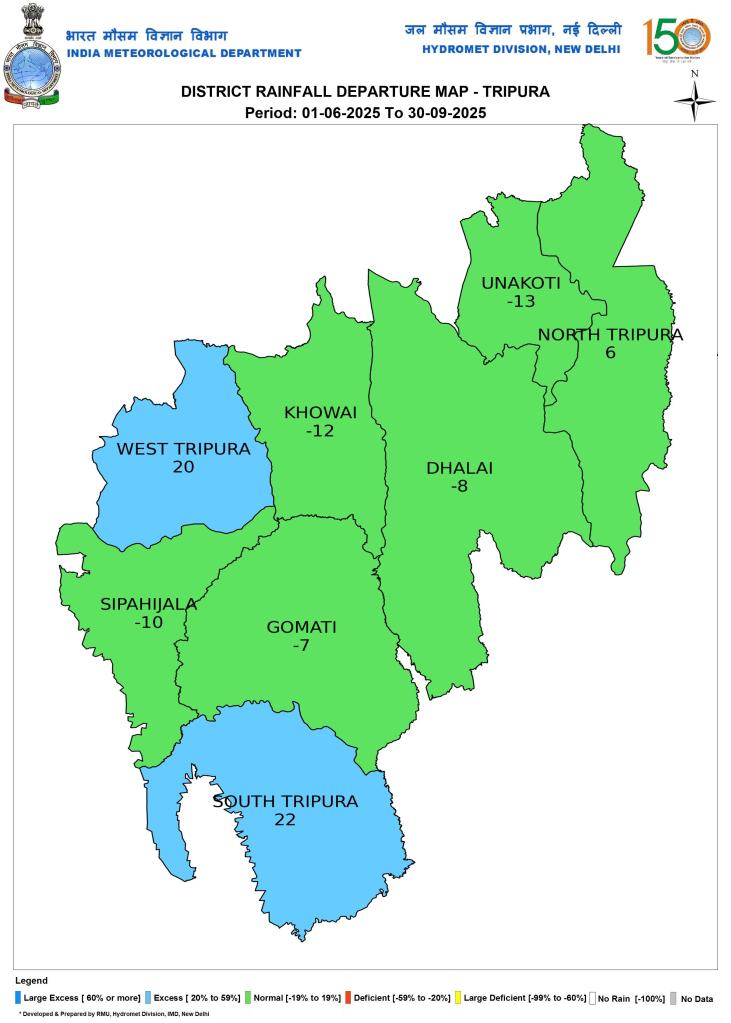
Tripura
SOUTH INDIA
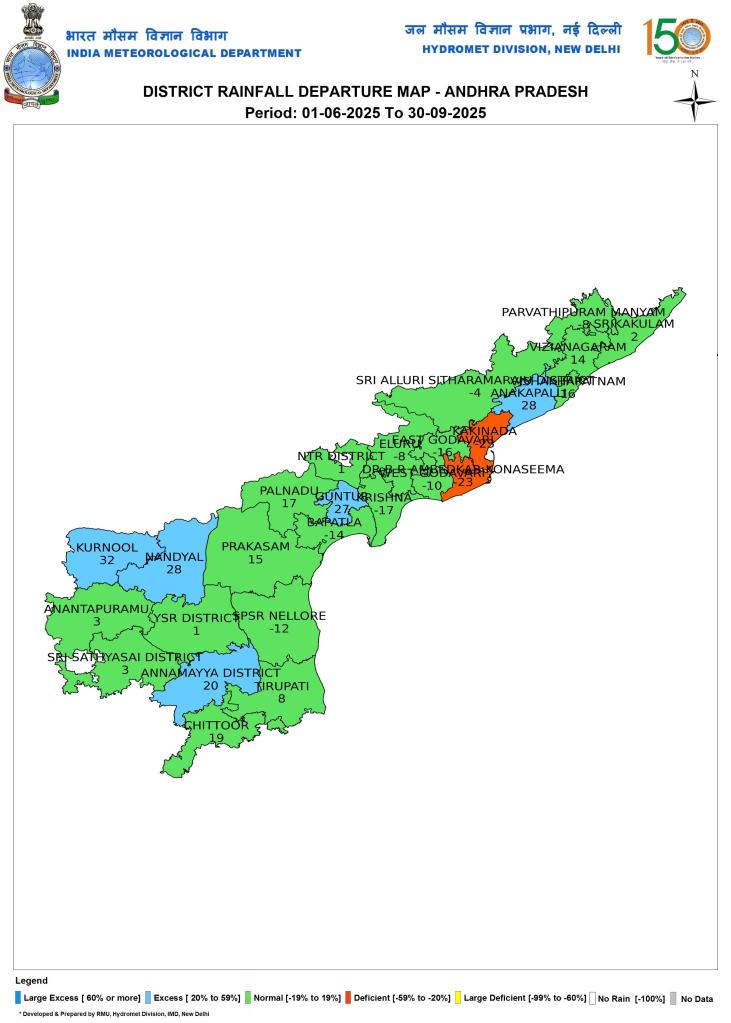
Andhra Pradesh
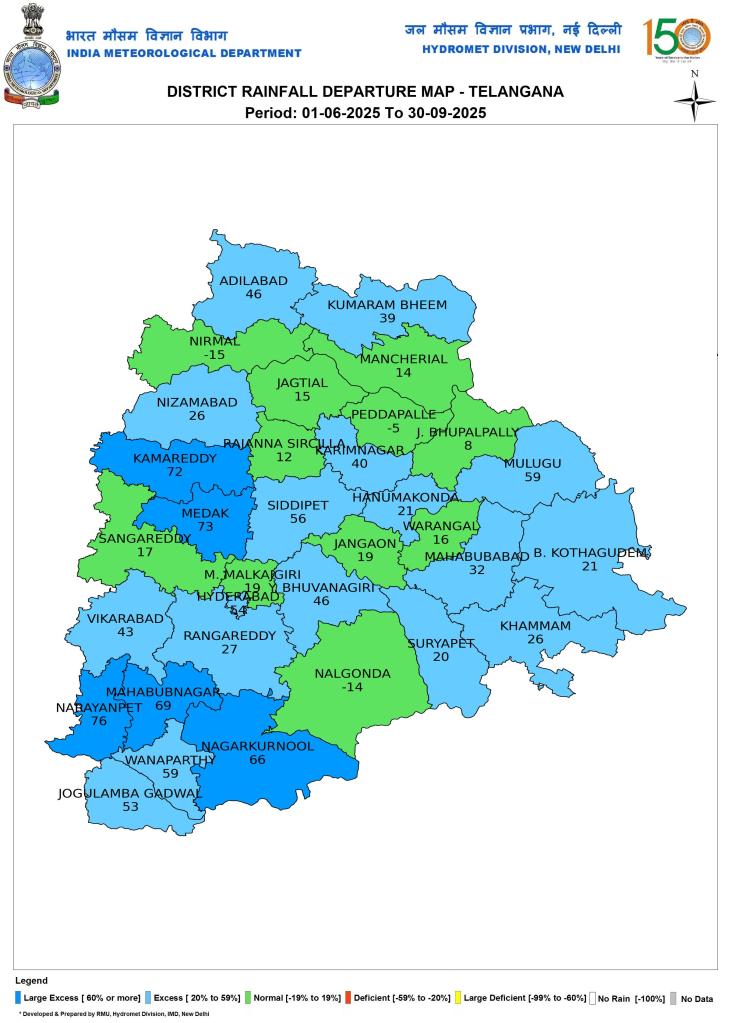
Telangana
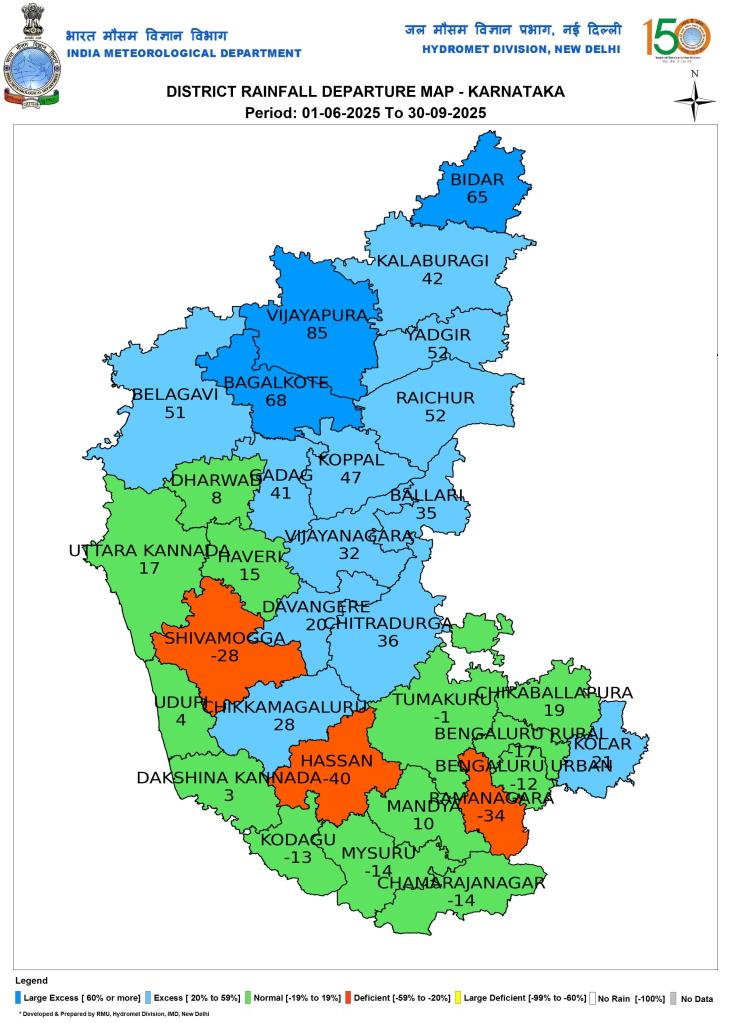
Karnataka
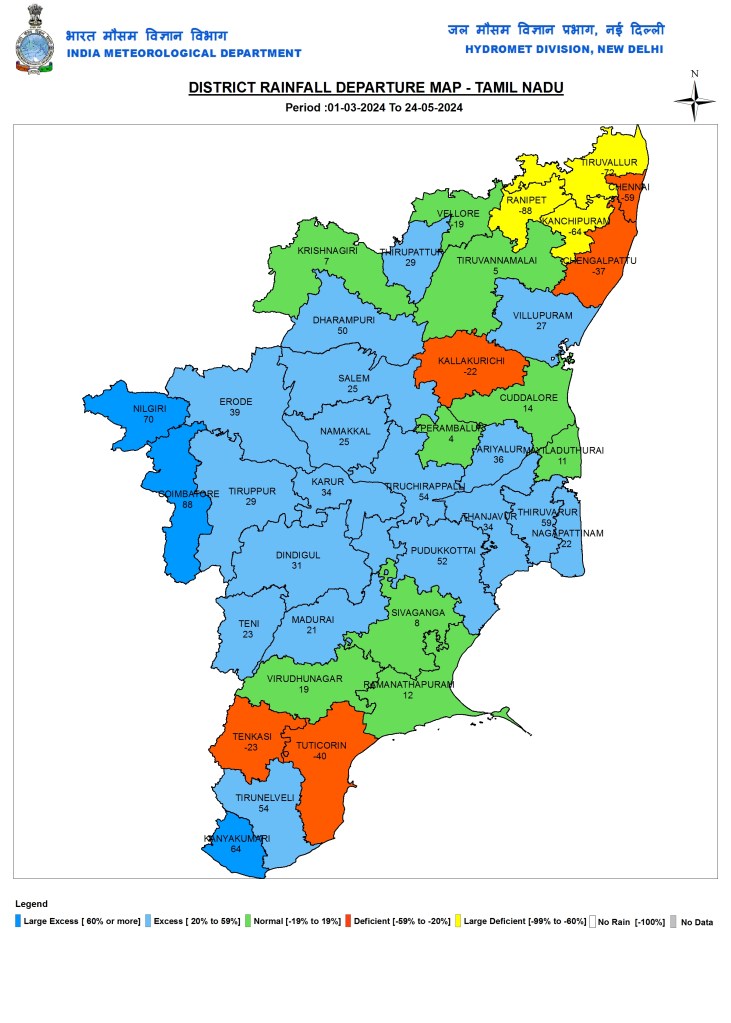
Tamil Nadu
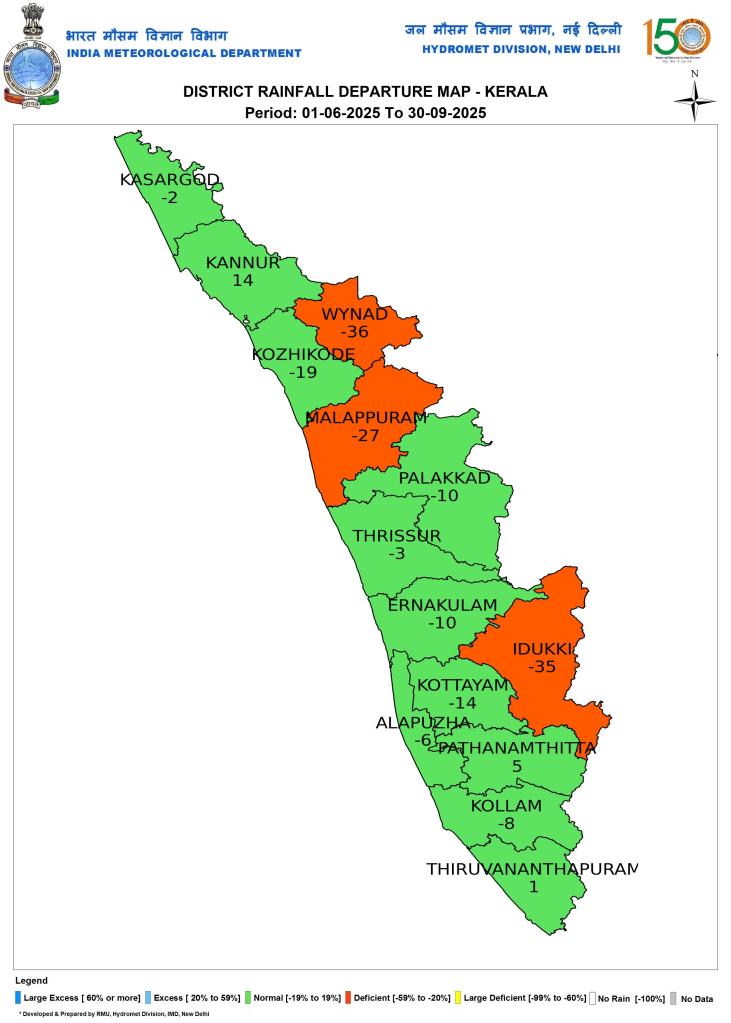
Kerala
WEST INDIA
Goa
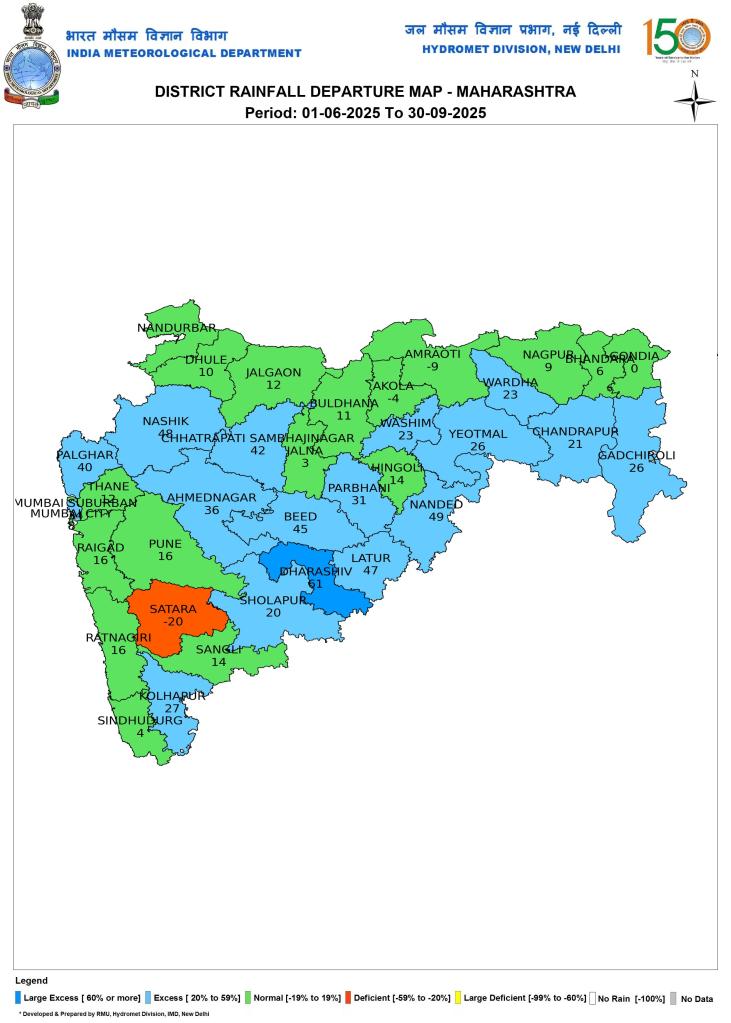
Maharashtra
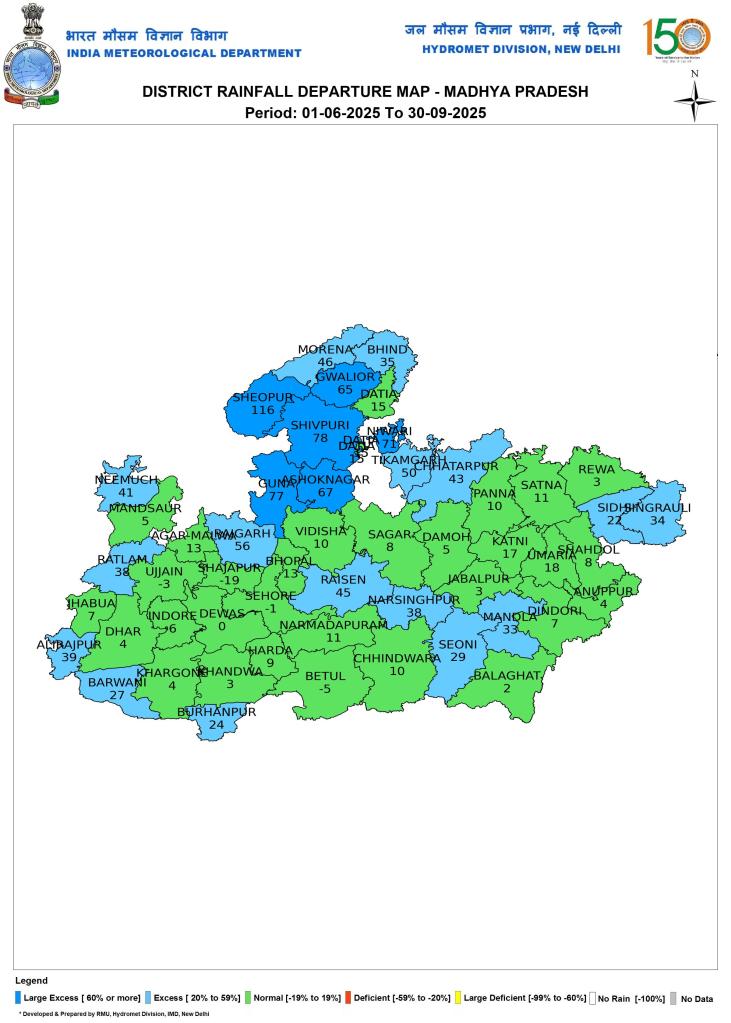
Madhya Pradesh
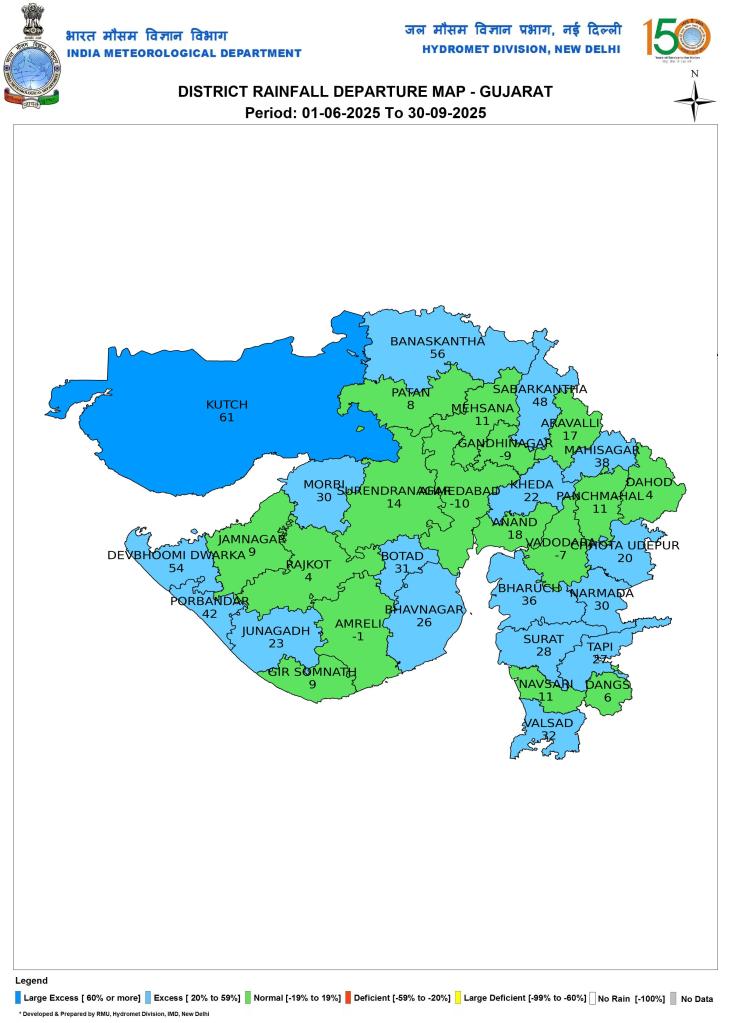
Gujarat
Rajasthan
SANDRP (ht.sandrp@gmail.com)
Relevant Links:
[i] https://sandrp.in/2022/10/01/sw-monsoon-2022-district-wise-rainfall-in-india/
[ii] https://internal.imd.gov.in/press_release/20250930_pr_4343.pdf
