Every dam can potentially help moderate floods to some extent in the downstream area. This is possible only when the dam is operated with that objective in mind. However, when the dam is NOT operated with that objective and is filled up as soon as there is water available, the same dam can in fact bring avoidable flood disaster in the downstream area.
This is exactly what has happened in Punjab ONCE AGAIN during the 2025 SW Monsoon. This has happened on numerous occasions in the past including in 1978, 1988 and 2023, for example.
The flood situation in Punjab remains grim, with the death toll rising to 43. As many as 1,948 villages are inundated, impacting 3.84 lakh people. Of these, 21,929 have been evacuated, while crops on 1.72 lakh hectares (4.32 lakh acres) have been destroyed.
Let us see how during the SW Monsoon 2025, improper operations of Bhakra dam on Sutlej, Pong dam on Beas and Ranjit Sagar dam on Ravi River significantly contributed in worsening the Punjab flood disaster, based on available information.
Bhakra – the need for accountable reservoir management: By Aug 1, Bhakra dam was already 53% full. Outflow from the Bhakra dam was on an average of 22-23000 cusecs during Aug 1-18 and increased significantly only on Aug 19-20 by opening the spillway gates for the first time in two years. (The gates could have been opened on and after Aug 10 when water level crossed 1645 ft.) By Aug 19 water level in the dam was already at 1666 ft, just 14 ft from the Full Reservoir Level (FRL) and the dam was already 80% full. The inflow during August 1-20 was 180% more than the outflow, a major reason for having greater outflow in first 20 days of Aug as the dam was already going past the prudent water storage. The outflow till Aug 20 was essentially only for power generation, which too was not optimum on many days. As a consequence, when Punjab was facing heavy rainfall in the 4th week of August, the Bhakra dam had to increase rather than decrease the outflow, thus worsening the floods in Punjab.
By Sept 2 morning, water level reached 1676.78 ft (dam 88% full) and by 6 am on Sept 3, 1677.84 ft and further up to 1678.45 ft (93% full) by Sept 3 evening.
Sub Optimal Power generation from Bhakra Hydropower stations Bhakra Left Side Power station has installed capacity of 630 MW, but one of the five units of the station was under outage throughout SW Monsoon 2025, so effective capacity was 504 MW. If this capacity is operated at full capacity, it can generate 12.1 Million Units (MU) electricity per day. At lower than FRL, the generating capacity would be lower than this figure, but if full flow is used, the difference would not be very high for the heads we can considering here. This station indeed generated at an average of 11.86 MU per day (as per Central Electricity Authority’s daily station wise power generation bulletins) during the period Aug 19 to Sept 3, when it also released water at full capacity. However, during July 31 to Aug 18, it generated at much lower 8.21 MU per day, when it did not release water at full capacity. This lower generation not only meant economic loss, but it also meant Bhakra dam was storing more water during this period which then meant the dam had to release much larger water outflows in last week of Aug and early Sept when Punjab was facing floods.
Similarly, the Bhakra Right bank power house with installed capacity of 785 MW can generate 18.84 MU per day at full capacity generation. However, its average generation during Aug 1-18 was much lower at 10.81 MU per day. During Aug 19-Sept 3, when the station started passing more water, the generation increased to much higher 18.39 MU per day and on Sept 3 it generated 19.12 MU. This not only meant that during Aug 1-18 lower generation meant economic loss, it also meant lower water outflow from the dam and greater water stored in Bhakra Dam, which then had to be released through spillway gates starting from Aug 25, when Punjab was also facing floods, worsening the flood disaster.
Was there actionable information available to increase the outflow (through power house or spillway) from Bhakra dam earlier than Aug 20? Indeed, going by IMD’s daily district wise rainfall figures, in the Bhakra catchment in Himachal Pradesh districts like Shimla, Kulu, Mandi and Bilaspur, rainfall was already very high starting from last week of July. The IMD’s regular forecasts about the impending high rainfall in Himachal Pradesh and Punjab was another separate reason for advance action in increasing releases from the Bhakra dam keeping in mind the downstream river carrying capacity. While BBMB claims that there have been several meetings of the Technical Committee to discuss flood preparedness and response, none of these discussions which have a direct bearing on public safety are available in the public domain. Agenda and minutes of all the meetings of the Technical Committee must be promptly available in public domain. Moreover, this also raises the question about the decision making process of the Technical Committee.
Pong when higher outflows contributed to floods: By Aug 1, the Pong dam was already over 60% full and by Aug 18, 85% full. Outflow from the dam increased significantly only on Aug 8 when level was already 1376.07 ft when the dam was already 83% full compared to the water storage capacity at FRL. Inflow was significantly high on Aug 1-3 and 5-6, but outflow had not increased even though dam water level was already way higher than it should have been considering prudent management. The Pong dam gates could have been opened on or after Aug 3 when water level at the dam crossed 1365 ft. Ultimately, the outflow had to cross 1 lakh cusecs from Aug 29, bringing huge floods in the downstream areas of Himachal Pradesh and Punjab as by then water level had already crossed 1393 ft on Aug 26, above the FRL of 1390 ft. Thus Pong dam ended up bringing floods into Punjab when Punjab was getting high rainfall.
Sub Optimal Power Generation from Pong The power generation at the 396 MW Hydropower station of Pong Dam was on an average 6.79 Million Units (MU) per day throughout July, when the power station can generate 9.5 MU per day if operated at full capacity. The levels being lower than FRL in July, the generation would be lower than 9.5 MU per day, but would still be significantly higher if full flow is used, which was clearly not the case. Generation was still low at 7.03 and 7.1 MU on Aug 1 and 2, it. Rose to an average of 8.46 MU per day for Aug 1-18. This sub optimal generation from July 1 till Aug 2 also mean less water outflow during the period, greater water storage and levels and increased outflow from the dam in second half of Aug and early Sept when Punjab was facing floods.
Actionable information for advance water release from the Pong Dam (through power house or spillway): High Rainfall days in Beas catchment districts Kulu (Aug 26), Mandi (July 22, 29, Aug 6), Kangra (July 30, Aug 6, 12, 17, 25-26). These, the IMD rainfall forecasts for Himachal Pradesh and the water storage level in the dam should have required the Pong dam operators to increase water outflows in advance. They did not do that. As a result, they had to start releasing large quantity of water from Aug 26 while downstream Punjab was also facing floods due to local rainfall.
All the members of the technical committee, including those from CWC and the concerned states including Punjab, Haryana, Rajasthan, Himachal Pradesh (occasionally, IMD and Punjab Agriculture dept persons are also invited) that were taking decisions about the water releases from Bhakra and Pong dams are clearly responsible for the operation of the Bhakra and Pong dams. It is claimed by BBMB officials in media reports that the rule curve of the two dams was reviewed and updated by the Central Water Commission (CWC) in 2024. This also raises questions about CWC as either the rule curve has been updated without taking into consideration the changing reality or the rule curves are not being followed. CWC in any case has a lot of explain in terms of failure of flood forecasting, no action for violations of rule curve, among other aspects.
The total inflow into the Pong reservoir from July and August 2025 was an unprecedented 9.68 billion cubic metres (BCM). This is the highest ever inflow for this period since the commissioning of dam. This is in fact another reason why outflows from the Pong dam should have been higher from July 2025 onwards.
The Himachal Pradesh Chief Minister has directed the HP Energy Department to file First Information Report (FIR) against BBMB, others for violating the dam safety norms and demanded that BBMB & others must compensate for the resultant losses. We hope this is taken to its logical conclusion and more such action is taken up in case of other such avoidable flood disasters, including by Punjab.
HP FIR Against BBMB over excess water release from Pong Dam Speaking in the Himahal Pradesh assembly, Chief Minister Sukhvinder Singh Sukhu said that continuous discharge of water from the Pong Dam on the Beas has created a flood-like situation in Fatehpur and Indora regions of Kangra district. He informed the House that an FIR was registered against the BBMB management at the Sansarpur Terrace police station in Kangra on July 26 for its alleged failure to ensure dam safety protocols. “Despite repeated devastation, including the 2023 floods, BBMB has neither compensated victims nor created safeguards. Our people are paying the price,” said the CM. Punjab government also needs to take similar action against BBMB since Punjab irrigation Minister has also alleged that BBMB’s high water releases led to floods in Punjab.
Ranjit Sagar when minister accepted the miscalculation: Outflow from the Ranjit Sagar dam on Ravi river was 9000 cusecs on Aug 24, jumped to 24000 cusecs on Aug 25, 77000 cusecs on Aug 26, 173000 cusecs on Aug 27 as by then dam level had crossed FRL and reached 527.13 m. From Aug 27, for five days, outflow was greater than inflow, which by CWC definition means dam had generated floods. Clearly, the dam ended up contributing to floods in Punjab rather than helping moderate the floods in the downstream area.
Sub Optimal Power generation at Ranjit Sagar Dam Ranjit Sagar hydropower station has installed capacity of 600 MW and can generate 14.4 MU per day at full capacity. At lower than FRL, the generating capacity would be lower than this figure, but if full flow is used, the difference would not be very high for the heads we can considering here. However, its average power generation during Aug 1 to 18 was 5.77 MU per day. This almost doubled to an average generation of 11.34 MU per day during Aug 19 to Sept 3. In fact on Sept 3, it generated at near full capacity of 14.35 MU. What all this meant that. During Aug 1-18, and to some extent even thereafter, RSD was generating at below optimum capacity and thus also releasing much lower water downstream then it would have had it operated at full capacity at the water level on those respective days. Not doing so not only meant huge economic loss, but it also mean accumulating more water in the dam, which had to be released when Punjab was facing floods.
Actionable information for advance water releases (from power house of spillway) from Ranjit Sagar dam: High rainfall days in Ravi river basin districts like Chamba (July 30, Aug 2, 6, 25-26), Kathua (Aug 11, 12, 17, 26, 27), Pathankot (Aug 2, 12, 15, 17, 24, 25, 26). But the dam authorities did not start releasing water after these high rainfall days or after the numerous IMD forecast of high rainfall in upstream areas, nor did they take into account the high water storage in the dam well before the dam filling season.
In an interview to Indian Express, Punjab Irrigation Minister said about the operation of Ranjit Sagar Dam from Aug 24: What happened was totally unexpected. No one had imagined it would be like this. All calculations were upended; flows came from the upper rivers in Himachal, as well as from the Pathankot side. So, when floodwaters from the upper reaches came down, even if less water was released from the dam, everything downstream would have been overwhelmed anyway. Moreover, if there’s any risk to the dam, then water has to be released. The dam cannot be endangered.
This is clear admission on the part of the Punjab government that they had not taken into account the rainfall that was forecast and already happening in upstream Himachal areas and also Pathankot in Punjab and had to suddenly open the dam gates on Aug 27, leading to major flood disaster in Punjab.
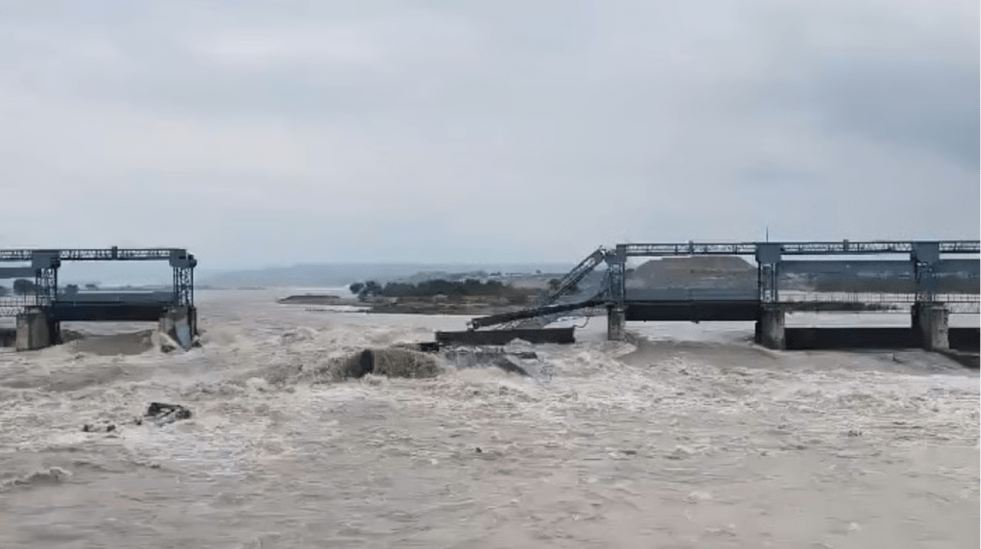
One of the direct consequences of the sudden release of over 1.7 lakh cusecs of water from the Ranjit Sagar Dam on Aug 27 was the damage to the Madhopur barrage on Ravi River and death of at least one person involved in repair of the dam. The mishap occurred reportedly due to non-opening of some of the gates of the barrage, which also raises question if the necessary dam safety protocols were being followed.
The record inflows into the three dams were driven by North India’s wettest monsoon since 2013 as per IMD. Himachal Pradesh, where most of all the three dams’ catchment area are, had 72% above-normal rainfall in August. Kulu district had 152% above normal and Mandi district had 76% above normal rainfall in Aug 2025.
There were of course other anthropogenic contributors to Punjab floods including Punjab’s far from adequate drainage system, breach of a number of embankments, encroachment on floodplains and water bodies, indiscriminate sand mining, among others.
Information required in Public Domain There is urgent need to ensure that information related to dam operations be promptly in public domain including Rule curve (updated every 3-5 years), Daily inflow, outflow, storage, names of those responsible for dam operations. Standard Operating Procedures for dam operations must include information about upstream river flows, upstream rainfall that has already happened, the forecast of rainfall in upstream and downstream catchment areas, vulnerable Glacier lakes, streams, landslide prone areas, downstream carrying capacity balance of the flood flows from downstream area rainfall. These decision supporting information should also be in public domain on daily basis and all this information must remain in archival form for at least five years.
It is also important to stress here that the need to maintain downstream river carrying capacity and also remove in timely and humanely manner those that are at risk in the downstream rivers.
It is noteworthy here that what we see in floods in Northwest India this monsoon is not just water, but mostly heavily silt laden water. This silt is making the floods more destructive and also filling up the reservoirs. The silt is coming from illegal dumping of muck created by dams and hydropower projects, roads, railways, bridges, indiscriminate sand mining. The silt generation is also increasing due to increasing landslides, high intensity rainfall, catchment degradation including degradation of forests, water bodies, wetlands, streams. All these aspects too need urgent attention and action.
We urgently need to have independent review of this disaster to understand what happened, what role played by different dams & agencies, fixing accountability, and learning lessons for future. The consequences of failure to achieve this in the past including in the case of Punjab’s 2023 flood are apparent. If we do not change now, climate change is likely to make every new disaster worse than the previous one.
Himanshu Thakkar (ht.sandrp@gmail.com)
NOTE: An edited version of this was first published at:
https://www.downtoearth.org.in/natural-disasters/mismanagement-of-three-major-dams-bhakra-pong-and-ranjit-sagar-worsened-the-2025-punjab-floods.
Post Script: Some key points shared at BBMB press conference in Chandigarh on Sep 5 2025, Press conference addressed by BBMB chairman Manoj Tripathi:
– First flood event reached Bhakra dam in last week of June, which was over 1 lakh cusecs.
– Bhakra highest level reached this season on 1679 ft on Sept 4, when the dam deflection was at its high of 1.14 (unit not mentioned).
– Bhakra PMF was revised by BBMB and hence new FRL is 1680 which earlier was technically upto 1690 ft. Pong can technically store water upto 1421 ft, but now restricted to FRL of 1390 and MWL of 1400 ft.
– BBMB refers to three weather forecasts, including from IMD, US Global Forecast System and Europe CWRF. IMD provides QPF (Quantitative Precipitation Forecast).
– The controversy about Haryana wanting additional water in April was about only 88 MCM water, which would not have made any significant difference to flood scene.
– There is no major rainfall event in catchment till Sept 15, after which there may be some large rainfall event.
– Pong level was 1301 ft before monsoon, we can go down to 1260 ft. This year we went upto 1289 ft for maintenance of some power tunnels.
– In Bhakra we are not going down to MDDL last two years due to conservative approach of the state govts.
– There is some constraint at Harike headworks where Sutlej and Beas meet, and when total flow go to 3 lakh cusecs or more due to low lying areas.
– Bhakra inflows this year were 9.11 BCM, 9.52 BCM in 2023 and 9.45 BCM in 1988.
– If there is heavy inflows in latter part of monsoon, we cannot store it.
– Highest water level in Pong this year was 1394.71 ft on Sept 5.
– Highest outflow from Bhakra was 85000 cusecs on Sept 4-5.
– Pong dam inflow this year from July 1 to Sept 5 has been record 11.7 BCM, compared to 9.52 BCM in 2023 monsoon.

Very informative article with data which must be known to wider public to hold the guilty accountable.
LikeLike
Many thanks, Sir, For sharing your thoughts and feedback. This is very encouraging and useful indeed. Keep sharing whenever appropriate.
Himanshu
LikeLike
If the public knew about the authorities’ mishaps, they wouldn’t have blamed the monsoon for this man-made disaster. The BBMB chairperson showed no accountability during the interview, failed to acknowledge his team mistakes, and offered no concrete suggestions to prevent such incidents in the future.
LikeLike