An analysis of the daily district wise rainfall data from India Meteorological Department (IMD) for India’s South West Monsoon 2025 (June-Sept rainfall was 937.2 mm, 8% above normal) shows that there were 2224 (2555 in 2024 SW Monsoon) instances when a district rainfall of a day was above 50 mm. Out of 738 districts of India, 510 districts or, about 69% of the districts experienced such high rainfall days during SW monsoon 2025.
Such high rainfall instances included 1920 instances when rainfall was 50-100 mm, 247 instances when it was 100-150 mm, 38 times it was 150-200 mm and 19 times above 200 mm.
NORTH EAST INDIA: Arunachal Pradesh The number of district days that experienced high rainfall events in Arunachal Pradesh in each of the four months of SW Monsoon 2025 is given in table below.
| Month | No of districts that had over 50 mm rainfall in at least one day in monsoon 2025 (total no of districts) | No of district days when rainfall 50-100 mm | No of district days when rainfall 100-150 mm | No of district days when rainfall 150-200 mm | No of district days when rainfall 200-250 mm | No of district days when rainfall 250+ mm | TOTAL no of dist days when rainfall over 50 mm |
| June 2025 | 13 (16) | 15 | 1 | 0 | 0 | 0 | 16 |
| July 2025 | 7 | 18 | 0 | 0 | 0 | 0 | 18 |
| Aug 2025 | 9 | 17 | 1 | 0 | 0 | 0 | 18 |
| Sept 2025 | 5 | 6 | 0 | 0 | 0 | 0 | 6 |
| SW Monsoon 2025 | 15 (16) | 56 | 2 | 0 | 0 | 0 | 58 |
In Arunachal Pradesh, the highest number of such events happened in Lower Dibang Valley (9), Papumpare (8) and Dibang Valley (8) districts. Thus three districts alone had 25 out of 58 such events in the state. East Siang, Lower Dibang Valley, Papum Pare & Tirap districts had such events in each of the four monsoon months.
Assam
| Month | No of districts that had over 50 mm rainfall in at least one day in monsoon 2025 (total no of districts) | No of district days when rainfall 50-100 mm | No of district days when rainfall 100-150 mm | No of district days when rainfall 150-200 mm | No of district days when rainfall 200-250 mm | No of district days when rainfall 250+ mm | TOTAL no of dist days when rainfall over 50 mm |
| June 2025 | 16 (35) | 18 | 1 | 2 | 1 | 1 | 23 |
| July 2025 | 18 | 26 | 2 | 0 | 0 | 0 | 28 |
| Aug 2025 | 23 | 33 | 2 | 0 | 0 | 0 | 35 |
| Sept 2025 | 15 | 24 | 0 | 0 | 0 | 0 | 24 |
| SW Monsoon 2025 | 30 (35) | 101 | 5 | 2 | 1 | 1 | 110 |
The highest number of such instances happened in Chirang (10) and Lakhimpur (9). Barpeta, Chirang, Bongaigaon, Jorhat, Lakhimpur, Udalgiri and Kokrajhar had such instances in all four monsoon months.
Meghalaya
| Month | No of districts that had over 50 mm rainfall in at least one day in monsoon 2025 (total no of districts) | No of district days when rainfall 50-100 mm | No of district days when rainfall 100-150 mm | No of district days when rainfall 150-200 mm | No of district days when rainfall 200-250 mm | No of district days when rainfall 250+ mm | TOTAL no of dist days when rainfall over 50 mm |
| June 2025 | 7 (11) | 14 | 3 | 2 | 1 | 0 | 20 |
| July 2025 | 6 | 13 | 1 | 0 | 0 | 0 | 14 |
| Aug 2025 | 7 | 27 | 4 | 1 | 0 | 0 | 32 |
| Sept 2025 | 5 | 9 | 1 | 1 | 0 | 0 | 11 |
| SW Monsoon 2025 | 8 (11) | 63 | 9 | 4 | 1 | 0 | 77 |
East Jaintia Hills (15), E Khasi Hills (16) and SW Khasi Hills (16) had the highest number of such instances. East Garo Hills, S Garo Hills, SW Khasi Hills and E Khasi Hills had such instances in all four monsoon months.
Nagaland
| Month | No of districts that had over 50 mm rainfall in at least one day in monsoon 2025 (total no of districts) | No of district days when rainfall 50-100 mm | No of district days when rainfall 100-150 mm | No of district days when rainfall 150-200 mm | No of district days when rainfall 200-250 mm | No of district days when rainfall 250+ mm | TOTAL no of dist days when rainfall over 50 mm |
| June 2025 | 3 (11) | 3 | 0 | 0 | 0 | 0 | 3 |
| July 2025 | 5 | 9 | 0 | 0 | 0 | 0 | 9 |
| Aug 2025 | 2 | 3 | 0 | 0 | 0 | 0 | 3 |
| Sept 2025 | 3 | 4 | 0 | 0 | 0 | 0 | 4 |
| SW Monsoon 2025 | 7 (11) | 19 | 0 | 0 | 0 | 0 | 19 |
Mokokchung (like in 2024) had the highest number of such instances at 7 and was the only district that had such instances in all four monsoon months.
Manipur
| Month | No of districts that had over 50 mm rainfall in at least one day in monsoon 2025 (total no of districts) | No of district days when rainfall 50-100 mm | No of district days when rainfall 100-150 mm | No of district days when rainfall 150-200 mm | No of district days when rainfall 200+ mm | TOTAL no of dist days when rainfall over 50 mm |
| June 2025 | 6 (9) | 7 | 1 | 0 | 0 | 8 |
| July 2025 | 1 | 1 | 0 | 0 | 0 | 1 |
| Aug 2025 | 3 | 6 | 0 | 0 | 0 | 5 |
| Sept 2025 | 5 | 5 | 0 | 0 | 0 | 0 |
| SW Monsoon 2025 | 8 (9) | 19 | 1 | 0 | 0 | 20 |
Tamenglong (8), like in 2024, had the highest no of such instances, followed by Chandel (3).
Mizoram
| Month | No of districts that had over 50 mm rainfall in at least one day in monsoon 2025 (total no of districts) | No of district days when rainfall 50-100 mm | No of district days when rainfall 100-150 mm | No of district days when rainfall 150-200 mm | No of district days when rainfall 150-200 mm | No of district days when rainfall 200+ mm | TOTAL no of dist days when rainfall over 50 mm |
| June 2025 | 5 (8) | 13 | 1 | 0 | 0 | 0 | 14 |
| July 2025 | 6 | 10 | 0 | 0 | 0 | 0 | 10 |
| Aug 2025 | 3 | 5 | 0 | 0 | 0 | 0 | 5 |
| Sept 2025 | 3 | 4 | 0 | 0 | 0 | 0 | 4 |
| SW Monsoon 2025 | 6 (8) | 32 | 1 | 0 | 0 | 0 | 33 |
Aizwal (6), Kolasib (11), Saiha (7) had the highest, 24 of the 33 High Rainfall District Day instances of Mizoram in SW Monsoon 2025. Kolasib and Saiha had such instances in all the four months of SW monsoon 2025.
Tripura
| Month | No of districts that had over 50 mm rainfall in at least one day in monsoon 2025 (total no of districts) | No of district days when rainfall 50-100 mm | No of district days when rainfall 100-150 mm | No of district days when rainfall 150-200 mm | No of district days when rainfall 150-200 mm | No of district days when rainfall 200+ mm | TOTAL no of dist days when rainfall over 50 mm |
| June 2025 | 6 (8) | 5 | 4 | 1 | 0 | 0 | 10 |
| July 2025 | 6 | 12 | 1 | 0 | 0 | 1 | 14 |
| Aug 2025 | 6 | 9 | 0 | 0 | 0 | 0 | 9 |
| Sept 2025 | 6 | 10 | 0 | 0 | 0 | 0 | 10 |
| SW Monsoon 2025 | 8 (8) | 36 | 5 | 1 | 0 | 1 | 43 |
All 8 districts had one or more instances in SW Monsoon 2025 when rainfall was over 50 mm in a day. S Tripura had the highest no of district days (9) when daily rainfall exceeded 50 mm. Dhalai, S Tripura and West Tripura had such instances in all four monsoon months.
Sikkim
| Month | No of districts that had over 50 mm rainfall in at least one day in monsoon 2025 (total no of districts) | No of district days when rainfall 50-100 mm | No of district days when rainfall 100-150 mm | No of district days when rainfall 150-200 mm | No of district days when rainfall 200-250 mm | No of district days when rainfall 250+ mm | TOTAL no of dist days when rainfall over 50 mm |
| June 2025 | 2 (6) | 3 | 0 | 0 | 0 | 0 | 3 |
| July 2025 | 5 | 7 | 2 | 0 | 0 | 0 | 9 |
| Aug 2025 | 4 | 8 | 0 | 0 | 0 | 0 | 8 |
| Sept 2025 | 4 | 11 | 0 | 0 | 0 | 0 | 11 |
| SW Monsoon 2025 | 6 (6) | 29 | 2 | 0 | 0 | 0 | 31 |
Namchi district had the highest number of high rainfall events (11). None of the districts had a high rainfall day in each of the four monsoon months.
North East India The figures of High Rainfall district days for the SW Monsoon 2025 for North East India states are given in the table blow.
| State | Districts that had over 50 mm rainfall at least on one day in Monsoon 2024 (Total no of districts) | No of district days when rainfall 50-100 mm | No of district days when Rainfall 100-150 mm | No of district days when Rainfall 150-200 | No of district days when Rainfall 200-250 | No of district days when Rainfall over 250 mm | Total no of district days when rainfall over 50 mm |
| Arunachal Pradesh | 15 (16) | 56 | 2 | 0 | 0 | 0 | 58 |
| Assam | 30 (35) | 101 | 5 | 2 | 1 | 1 | 110 |
| Meghalaya | 8 (11) | 63 | 9 | 4 | 1 | 0 | 77 |
| Nagaland | 7 (11) | 19 | 0 | 0 | 0 | 0 | 19 |
| Manipur | 8 (9) | 19 | 1 | 0 | 0 | 0 | 20 |
| Mizoram | 6 (8) | 32 | 1 | 0 | 0 | 0 | 33 |
| Tripura | 8 (8) | 36 | 5 | 1 | 0 | 1 | 43 |
| Sikkim | 6 (6) | 29 | 2 | 0 | 0 | 0 | 31 |
| North East India | 88 (104) | 355 | 25 | 7 | 2 | 2 | 391 (523) |
So more than 85% of the districts in North East India had high rainfall day during SW Monsoon 2025, compared to 85% in 2024 & 2023, 88% in 2022 and 80% in 2021, even in an year when most of NE India had below normal rainfall. Monthwise distribution of such days in NE India was as follows.
| Month | No of districts that had over 50 mm rainfall in at least one day in monsoon 2025 (total no of districts) | No of district days when rainfall 50-100 mm | No of district days when rainfall 100-150 mm | No of district days when rainfall 150-200 mm | No of district days when rainfall 200-250 mm | No of district days when rainfall 250+ mm | TOTAL no of dist days when rainfall over 50 mm |
| June 2025 | 58 (104) | 78 | 11 | 5 | 2 | 1 | 97 |
| July 2025 | 54 | 96 | 6 | 0 | 0 | 1 | 103 |
| Aug 2025 | 57 | 108 | 7 | 1 | 0 | 0 | 116 |
| Sept 2025 | 38 | 73 | 1 | 1 | 0 | 0 | 75 |
| SW Monsoon 2025 | 88/104 | 355 | 25 | 7 | 2 | 2 | 391 |
EAST INDIA: West Bengal
| Month | No of districts that had over 50 mm rainfall in at least one day in monsoon 2025 (total no of districts) | No of district days when rainfall 50-100 mm | No of district days when rainfall 100-150 mm | No of district days when rainfall 150-200 mm | No of district days when rainfall 200-250 mm | No of district days when rainfall 250+ mm | TOTAL no of dist days when rainfall over 50 mm |
| June 2025 | 15 (23) | 19 | 3 | 2 | 0 | 0 | 24 |
| July 2025 | 16 | 29 | 3 | 0 | 0 | 0 | 32 |
| Aug 2025 | 14 | 26 | 2 | 1 | 0 | 0 | 29 |
| Sept 2025 | 12 | 18 | 3 | 0 | 0 | 0 | 21 |
| SW Monsoon 2025 | 23 (23) | 92 | 11 | 3 | 0 | 0 | 106 (179) |
All 23 districts of W Bengal had high rainfall days in Monsoon 2025, as was also the case in 2024. Alipurduar (11), Jalpaiguri (11), Cooch Behar (12) and Darjeeling (9) had the highest number of high rainfall days in Monsoon 2025. Alipurduar, Cooch Behar, Jalpaiguri, Darjeeling and Kalimpong had such days in each of the four monsoon months.
Odisha
| Month | No of districts that had over 50 mm rainfall in at least one day in monsoon 2025 (total no of districts) | No of district days when rainfall 50-100 mm | No of district days when rainfall 100-150 mm | No of district days when rainfall 150-200 mm | No of district days when rainfall 200-250 mm | No of district days when rainfall 250+ mm | TOTAL no of dist days when rainfall over 50 mm |
| June 2025 | 8 (30) | 10 | 1 | 0 | 0 | 0 | 11 |
| July 2025 | 13 | 20 | 0 | 0 | 0 | 0 | 20 |
| Aug 2025 | 7 | 8 | 1 | 0 | 0 | 0 | 9 |
| Sept 2025 | 12 | 12 | 2 | 0 | 0 | 0 | 14 |
| SW Monsoon 2025 | 23 (30) | 50 | 4 | 0 | 0 | 0 | 54 (75) |
Deogarh is the only district where there were high rainfall days in each of four monsoon months. Deogarh and Koraput were the only district with highest number of such incidents (5 each) during SW Monsoon 2025.
Jharkhand
| Month | No of districts that had over 50 mm rainfall in at least one day in monsoon 2025 (total no of districts) | No of district days when rainfall 50-100 mm | No of district days when rainfall 100-150 mm | No of district days when rainfall 150-200 mm | No of district days when rainfall 200-250 mm | No of district days when rainfall 250+ mm | TOTAL no of dist days when rainfall over 50 mm |
| June 2025 | 14 (24) | 15 | 9 | 4 | 1 | 0 | 29 |
| July 2025 | 18 | 29 | 3 | 0 | 0 | 0 | 32 |
| Aug 2025 | 11 | 11 | 2 | 0 | 0 | 0 | 13 |
| Sept 2025 | 1 | 2 | 0 | 0 | 0 | 0 | 2 |
| SW Monsoon 2025 | 21 (24) | 57 | 14 | 4 | 1 | 0 | 76 (87) |
E Singhbhum dist of Jharkhand had the highest (7) number of district days when rainfall exceeded 50 mm during SW Monsoon 2025. 27 of the 76 instances of High Rainfall dist days in SW Monsoon 2025 occurred during June 18-20, out of which June 19 was the rainiest day in Jharkhand, when the sole instance of rainfall exceeding 200 in Saraikela Kharsawan dist and four other instances when rainfall in a district exceeded 150 mm in a day, all occurred on June 19. Similarly 10 such instances occurred during Aug 22-24.
Bihar
| Month | No of districts that had over 50 mm rainfall in at least one day in monsoon 2025 (total no of districts) | No of district days when rainfall 50-100 mm | No of district days when rainfall 100-150 mm | No of district days when rainfall 150-200 mm | No of district days when rainfall 150-200 mm | No of district days when rainfall 200+ mm | TOTAL no of dist days when rainfall over 50 mm |
| June 2025 | 2 (38) | 2 | 0 | 0 | 0 | 0 | 2 |
| July 2025 | 16 | 16 | 1 | 0 | 0 | 0 | 17 |
| Aug 2025 | 16 | 19 | 0 | 0 | 0 | 0 | 19 |
| Sept 2025 | 2 | 1 | 1 | 0 | 0 | 0 | 2 |
| SW Monsoon 2025 | 26 (38) | 38 | 2 | 0 | 0 | 0 | 40 (66) |
Bihar had 31% below normal rainfall in SW Monsoon 2025 (after 19% below normal in SW Monsoon 2024, 23% below normal rainfall in SW Monsoon 2023, 31% below normal in SW Monsoon 2022). Kishanganj (like in case of SW Monsoon 2024 and 2023) had the highest number of high rainfall days at 7 (8 in 2024, 7 in 2023). The only districts with a rainfall in a day exceeding 100 mm were Khagaria (July 20), Kishanganj (Sept 20). There were 12 high rainfall dist days during Aug 2-4 2025.
Uttar Pradesh
| Month | No of districts that had over 50 mm rainfall in at least one day in monsoon 2025 (total no of districts) | No of district days when rainfall 50-100 mm | No of district days when rainfall 100-150 mm | No of district days when rainfall 150-200 mm | No of district days when rainfall 200-250 mm | No of district days when rainfall 250+ mm | TOTAL no of dist days when rainfall over 50 mm |
| June 2025 | 14 (75) | 14 | 1 | 0 | 0 | 0 | 15 |
| July 2025 | 21 | 28 | 5 | 1 | 0 | 0 | 34 |
| Aug 2025 | 34 | 51 | 4 | 1 | 0 | 0 | 56 |
| Sept 2025 | 23 | 21 | 3 | 0 | 0 | 0 | 24 |
| SW Monsoon 2025 | 52 (75) | 114 | 13 | 2 | 0 | 0 | 129 (189) |
Chitrakoot, Lalitpur and Moradabad districts had the highest number of such instances (6 each). Banda and Bijnor were the only districts during SW Monsoon 2025 that had over 150 mm rainfall in a day. During Aug 2-6, there were 29 instances when dist rainfall was over 50 mm in a day during SW Monsoon 2025. Similarly there were 17 instances when dist rainfall was over 50 mm in a day during Sept 1-4.
EAST INDIA
| State | Districts that had over 50 mm rainfall at least on one day in SW Monsoon 2025 (Total no of districts) | No of district days when rainfall 50-100 mm | No of district days when Rainfall 100-150 mm | No of district days when Rainfall 150-200 | No of district days when Rainfall 200-250 mm | No of district days when Rainfall over 250 mm | Total no of district days when rainfall over 50 mm |
| W Bengal | 23 (23) | 92 | 11 | 3 | 0 | 0 | 106 |
| Odisha | 23 (30) | 50 | 4 | 0 | 0 | 0 | 54 |
| Jharkhand | 21 (24) | 57 | 14 | 4 | 1 | 0 | 76 |
| Bihar | 26 (38) | 38 | 2 | 0 | 0 | 0 | 40 |
| UP | 52 (75) | 114 | 13 | 2 | 0 | 0 | 129 |
| East India | 145 (190) | 351 | 44 | 9 | 1 | 0 | 405 (596) |
So over 76.3% (82.6% in SW Monsoon 2024, 76% in SW monsoon 2023, 77% in 2022 and 89% in 2021) of districts in East India had high rainfall days in SW Monsoon 2025.
| Month | No of districts that had over 50 mm rainfall in at least one day in monsoon 2025 (total no of districts) | No of district days when rainfall 50-100 mm | No of district days when rainfall 100-150 mm | No of district days when rainfall 150-200 mm | No of district days when rainfall 200-250 mm | No of district days when rainfall 250+ mm | TOTAL no of dist days when rainfall over 50 mm |
| June 2025 | 53 (190) | 60 | 14 | 6 | 1 | 0 | 81 |
| July 2025 | 84 | 122 | 12 | 1 | 0 | 0 | 135 |
| Aug 2025 | 82 | 115 | 9 | 2 | 0 | 0 | 126 |
| Sept 2025 | 50 | 54 | 9 | 0 | 0 | 0 | 63 |
| SW Monsoon 2025 | 145/190 | 351 | 44 | 9 | 1 | 0 | 405 |
NORTH INDIA: Uttarakhand
| Month | No of districts that had over 50 mm rainfall in at least one day in monsoon 2025 (total no of districts) | No of district days when rainfall 50-100 mm | No of district days when rainfall 100-150 mm | No of district days when rainfall 150-200 mm | No of district days when rainfall 200-250 mm | No of district days when rainfall 250+ mm | TOTAL no of dist days when rainfall over 50 mm |
| June 2025 | 6 (13) | 10 | 0 | 0 | 0 | 0 | 10 |
| July 2025 | 9 | 13 | 0 | 0 | 0 | 0 | 13 |
| Aug 2025 | 13 | 27 | 6 | 0 | 0 | 0 | 33 |
| Sept 2025 | 9 | 17 | 2 | 0 | 0 | 0 | 19 |
| SW Monsoon 2025 | 13 (13) | 67 | 8 | 0 | 0 | 0 | 75 (57) |
Uttarakhand had the highest number of high rainfall district days this year in last five years. While there were 42 such instances in 2021, 45 in 2022, 62 in 2023 and 57 in 2024 monsoon.
Bageshwar, Dehradun and Tehri Garhwal disricts had high rainfall days in all the four monsoon months in SW Mosoon 2025. Bageshwar had the highest number of such days at sixteen (Bageshwar also had the highest such days in in 2024 at 12, 2022 at 12 and in 2021 at nine), followed by Dehradun and Haridwar (9 each).
Haryana
| Month | No of districts that had over 50 mm rainfall in at least one day in monsoon 2025 (total no of districts) | No of district days when rainfall 50-100 mm | No of district days when rainfall 100-150 mm | No of district days when rainfall 150-200 mm | No of district days when rainfall 200-250 mm | No of district days when rainfall 250+ mm | TOTAL no of dist days when rainfall over 50 mm |
| June 2025 | 1 (22) | 1 | 0 | 0 | 0 | 0 | 1 |
| July 2025 | 6 | 7 | 0 | 0 | 0 | 0 | 7 |
| Aug 2025 | 2 | 1 | 1 | 0 | 0 | 0 | 2 |
| Sept 2025 | 13 | 15 | 0 | 0 | 0 | 0 | 15 |
| SW Monsoon 2025 | 18 (22) | 24 | 1 | 0 | 0 | 0 | 25 (16) |
This is the 2nd lowest number for Haryana in last five years. In 2021 monsoon, Haryana had 46 high rainfall district days, that came down in 2022 monsoon to 32 and to 36 in 2023 and 16 in 2024. Only Fatehabad had a day rainfall exceeding 100 mm, on Aug 25 2025. In fact 15 of the 25 High Rainfall district days for Haryana for SW Monsoon 2025 happened on Sep 1-4 2025. Panchkula district had the highest 34) high rainfall days.
Chandigarh Chandigarh had four high rainfall days (June 29-30, Aug 9 and Sept 1) during SW Monsoon 2025.
Delhi
| Month | No of districts that had over 50 mm rainfall in at least one day in monsoon 2025 (total no of districts) | No of district days when rainfall 50-100 mm | No of district days when rainfall 100-150 mm | No of district days when rainfall 150-200 mm | No of district days when rainfall 200-250 mm | No of district days when rainfall 250+ mm | TOTAL no of dist days when rainfall over 50 mm |
| June 2025 | 0 (10) | 0 | 0 | 0 | 0 | 0 | 0 |
| July 2025 | 5 | 7 | 1 | 0 | 0 | 0 | 8 |
| Aug 2025 | 4 | 7 | 1 | 0 | 0 | 0 | 8 |
| Sept 2025 | 2 | 2 | 0 | 0 | 0 | 0 | 2 |
| SW Monsoon 2025 | 6 (10) | 16 | 2 | 0 | 0 | 0 | 18 (23) |
The number of district days when rainfall exceeded 50 mm in a day were 42 in 2021 monsoon, has dropped to almost half at 23 each in 2024, 2023 and 2022 monsoon and further down to 18 in 2025 monsoon, lowest in last five years.
Central Delhi district in Delhi State had the highest number (5) of high rainfall days in SW Monsoon 2025, same as that for North Delhi in SW Monsoon 2024, while South East Delhi had 4 this year. North Delhi had Zero such days in SW Monsoon 2025.
Punjab
| Month | No of districts that had over 50 mm rainfall in at least one day in monsoon 2025 (total no of districts) | No of district days when rainfall 50-100 mm | No of district days when rainfall 100-150 mm | No of district days when rainfall 150-200 mm | No of district days when rainfall 200-250 mm | No of district days when rainfall 250+ mm | TOTAL no of dist days when rainfall over 50 mm |
| June 2025 | 0 (22) | 0 | 0 | 0 | 0 | 0 | 0 |
| July 2025 | 5 | 5 | 0 | 0 | 0 | 0 | 0 |
| Aug 2025 | 13 | 20 | 3 | 0 | 0 | 0 | 23 |
| Sept 2025 | 11 | 11 | 3 | 0 | 0 | 0 | 14 |
| SW Monsoon 2025 | 17 (22) | 36 | 6 | 0 | 0 | 0 | 42 (17) |
The number of high rainfall district days in Punjab in SW Monsoon 2025 were at 42, highest in last five year, up from 17 in 2024, 32 in 2023, 31 in 2022 and 27 in 2021.
Pathankot, like in SW monsoon 2024, had the highest number (9, up from 6 in 2024) of high rainfall district days in SW monsoon 2025. SAS Nagar (Kapurthala in 2021 monsoon) had the highest number (4) of high rainfall days among all the Punjab districts both in 2023 and 2022. Sept 1-3 was the highest rainfall phase in Punjab during 2025, during which phase 14 of state’s 42 high rainfall district days occurred.
Himachal Pradesh
| Month | No of districts that had over 50 mm rainfall in at least one day in monsoon 2025 (total no of districts) | No of district days when rainfall 50-100 mm | No of district days when rainfall 100-150 mm | No of district days when rainfall 150-200 mm | No of district days when rainfall 200-250 mm | No of district days when rainfall 250+ mm | TOTAL no of dist days when rainfall over 50 mm |
| June 2025 | 4 (12) | 5 | 0 | 0 | 0 | 0 | 5 |
| July 2025 | 6 | 15 | 1 | 0 | 0 | 0 | 16 |
| Aug 2025 | 9 | 24 | 2 | 0 | 1 | 0 | 27 |
| Sept 2025 | 10 | 10 | 1 | 1 | 0 | 0 | 12 |
| SW Monsoon 2025 | 10 (12) | 54 | 4 | 1 | 1 | 0 | 60 (25) |
The total of high rainfall district days in HP has massively gone up in SW Monsoon 2025 to 60 from 25 in 2024, 21 in 2022 and 17 in 2021. In 2023, the numbers were highest in five years at 65.
Una district had the highest number of high rainfall days among HP districts in SW monsoon 2025 at 11 (it was Kangra in 2024 at 6, Sirmour in 2021 with 5 such instances and Kangra in 2022 with six, Mandi in 2023 with 11), followed by Mandi and Kangra having Nine such days each.
Jammu & Kashmir
| Month | No of districts that had over 50 mm rainfall in at least one day in monsoon 2024 (total no of districts) | No of district days when rainfall 50-100 mm | No of district days when rainfall 100-150 mm | No of district days when rainfall 150-200 mm | No of district days when rainfall 200-250 mm | No of district days when rainfall 250+ mm | TOTAL no of dist days when rainfall over 50 mm |
| June 2024 | 2 (20) | 3 | 0 | 0 | 0 | 0 | 3 |
| July 2024 | 6 | 7 | 4 | 0 | 0 | 0 | 11 |
| Aug 2024 | 11 | 21 | 7 | 0 | 3 | 0 | 31 |
| Sept 2024 | 9 | 6 | 3 | 1 | 1 | 0 | 11 |
| SW Monsoon 2024 | 12 (20) | 37 | 14 | 1 | 4 | 0 | 56 (24) |
The number of high rainfall events in J&K in SW Monsoon 2025 was 56, compared to 50 in 2022 and 30 in 2023, 24 in 2024. Reasi district had the highest, at 11 high rainfall district days in SW Monsoon 2025 (Reasi had the highest such number in 2022 and 2021 Monsoon at 8 & 6; Samba in 2023, Jammu and Kathua in 2024).
Ladakh The two districts of Ladakh had no high rainfall days in SW monsoon 2025 like every year.
NORTH INDIA
| State/ Union Territory | Districts that had over 50 mm rainfall at least on one day in SW Monsoon 2025 (Total no of districts) | No of district days when rainfall 50-100 mm | No of district days when Rainfall 100-150 mm | No of district days when Rainfall 150-200 | No of district days when Rainfall 200-250 | No of district days when Rainfall over 250 mm | Total no of district days when rainfall over 50 mm |
| Uttarakhand | 13 (13) | 67 | 8 | 0 | 0 | 0 | 75 |
| Haryana | 18 (22) | 24 | 1 | 0 | 0 | 0 | 25 |
| Chandigarh | 1 (1) | 4 | 0 | 0 | 0 | 0 | 4 |
| Delhi | 6 (10) | 16 | 2 | 0 | 0 | 0 | 18 |
| Punjab | 17 (22) | 36 | 6 | 0 | 0 | 0 | 42 |
| Himachal P | 10 (12) | 54 | 4 | 1 | 1 | 0 | 60 |
| J & Kashmir | 12 (20) | 37 | 14 | 1 | 4 | 0 | 56 |
| Ladakh | 0 (2) | 0 | 0 | 0 | 0 | 0 | |
| North India | 77 (102) | 238 | 35 | 2 | 5 | 0 | 280 (163) |
| Month | No of districts that had over 50 mm rainfall in at least one day in monsoon 2025 (total no of districts) | No of district days when rainfall 50-100 mm | No of district days when rainfall 100-150 mm | No of district days when rainfall 150-200 mm | No of district days when rainfall 200-250 mm | No of district days when rainfall 250+ mm | TOTAL no of dist days when rainfall over 50 mm |
| June 2025 | 14 (102) | 21 | 0 | 0 | 0 | 0 | 21 |
| July 2025 | 37 | 54 | 6 | 0 | 0 | 0 | 60 |
| Aug 2025 | 53 | 101 | 20 | 0 | 4 | 0 | 125 |
| Sept 2025 | 55 | 62 | 9 | 2 | 1 | 0 | 74 |
| SW Monsoon 2025 | 77/102 | 238 | 35 | 2 | 5 | 0 | 280 |
WEST INDIA: Rajasthan
| Month | No of districts that had over 50 mm rainfall in at least one day in monsoon 2025 (total no of districts) | No of district days when rainfall 50-100 mm | No of district days when rainfall 100-150 mm | No of district days when rainfall 150-200 mm | No of district days when rainfall 200-250 mm | No of district days when rainfall 250+ mm | TOTAL no of dist days when rainfall over 50 mm |
| June 2025 | 9 (33) | 10 | 0 | 0 | 0 | 0 | 10 |
| July 2025 | 20 | 35 | 7 | 0 | 0 | 0 | 42 |
| Aug 2025 | 15 | 19 | 3 | 0 | 1 | 0 | 23 |
| Sept 2025 | 11 | 12 | 1 | 0 | 0 | 0 | 13 |
| SW Monsoon 2025 | 28 (33) | 76 | 11 | 0 | 1 | 0 | 88 (85) |
Baran, Kota and Sawai Madhopur (Pratapgarh and Sawai Madhopur in 2024, Sirohi in 2023 & 2022 and Baran in 2021) districts had the highest number of high rainfall days at 7 each among all the districts of Rajasthan. Aug 22-26 had the highest number of high rainfall days in Rajasthan, with 18 high rainfall district days on just these dates.
Madhya Pradesh
| Month | No of districts that had over 50 mm rainfall in at least one day in monsoon 2025 (total no of districts) | No of district days when rainfall 50-100 mm | No of district days when rainfall 100-150 mm | No of district days when rainfall 150-200 mm | No of district days when rainfall 200-250 mm | No of district days when rainfall 250+ mm | TOTAL no of dist days when rainfall over 50 mm |
| June 2025 | 10 (52) | 14 | 2 | 0 | 0 | 0 | 16 |
| July 2025 | 44 | 105 | 23 | 4 | 0 | 0 | 132 |
| Aug 2025 | 13 | 15 | 0 | 0 | 0 | 0 | 15 |
| Sept 2025 | 14 | 14 | 3 | 0 | 0 | 0 | 17 |
| SW Monsoon 2025 | 49 (52) | 148 | 28 | 4 | 0 | 0 | 180 (171) |
Sheopur had the highest number of high rainfall days in SW Monsoon 2025 (Alirajpur (8) and Sheopur (7) in 2024; Burhanpur, Narshimapura and Seoni in 2023; Bhopal and Narmadapuram in 2022 with eleven each and Guna in 2021 had 8 such days). The three district that did not have ANY high rainfall days in MP during 2025 monsoon are Bhind, Dhar and Khandwa. It is striking that 73.33% of MP’s high rainfall days were in July 2025, far fewer days were there in June, Aug and Sept. This is certainly very unusual.
Diu, Daman, Dadar & Nagarhaveli
| Month | No of districts that had over 50 mm rainfall in at least one day in monsoon 2025 (total no of districts) | No of district days when rainfall 50-100 mm | No of district days when rainfall 100-150 mm | No of district days when rainfall 150-200 mm | No of district days when rainfall 200-250 mm | No of district days when rainfall 250+ mm | TOTAL no of dist days when rainfall over 50 mm |
| June 2025 | 2 (3) | 7 | 3 | 1 | 0 | 0 | 11 |
| July 2025 | 2 | 5 | 1 | 0 | 0 | 0 | 6 |
| Aug 2025 | 3 | 6 | 3 | 1 | 0 | 0 | 10 |
| Sept 2025 | 3 | 8 | 0 | 0 | 1 | 1 | 10 |
| SW Monsoon 2025 | 3 (3) | 26 | 7 | 2 | 1 | 1 | 37 (33) |
Gujarat
| Month | No of districts that had over 50 mm rainfall in at least one day in monsoon 2025 (total no of districts) | No of district days when rainfall 50-100 mm | No of district days when rainfall 100-150 mm | No of district days when rainfall 150-200 mm | No of district days when rainfall 200-250 mm | No of district days when rainfall 250+ mm | TOTAL no of dist days when rainfall over 50 mm |
| June 2025 | 26 (33) | 39 | 8 | 1 | 2 | 0 | 50 |
| July 2025 | 19 | 27 | 2 | 0 | 0 | 0 | 29 |
| Aug 2025 | 14 | 15 | 4 | 2 | 0 | 0 | 21 |
| Sept 2025 | 24 | 36 | 4 | 0 | 0 | 0 | 40 |
| SW Monsoon 2025 | 33 (33) | 117 | 18 | 3 | 2 | 0 | 140 (188) |
Gujarat state had 25% above normal rainfall in SW Monsoon 2025, compared to 48% surplus in 2024, 18% surplus in 2023 and 27% surplus in 2022. So number of high rainfall district days have gone down to 140 from 188 in 2024, 98 in 2023 and 137 in 2022. Interestingly, all 33 districts of the state had no high rainfall district days in SW Monsoon 2025. Surprisingly, June and not July or Aug had the highest number of high rainfall days.
Valsad had the highest number of such days at 14, followed by Dangs (11), Surat (9) and Tapi (9). Only Dangs and Botad had a day with rainfall over 250 mm, on June 19 and June 17 respectively.
Goa
| Month | No of districts that had over 50 mm rainfall in at least one day in monsoon 2025 (total no of districts) | No of district days when rainfall 50-100 mm | No of district days when rainfall 100-150 mm | No of district days when rainfall 150-200 mm | No of district days when rainfall 200-250 mm | No of district days when rainfall 250+ mm | TOTAL no of dist days when rainfall over 50 mm |
| June 2025 | 2 (2) | 7 | 2 | 0 | 0 | 0 | 9 |
| July 2025 | 2 | 14 | 2 | 1 | 0 | 0 | 17 |
| Aug 2025 | 2 | 10 | 1 | 1 | 0 | 0 | 12 |
| Sept 2025 | 0 | 0 | 0 | 0 | 0 | 0 | 0 |
| SW Monsoon 2025 | 2 (2) | 31 | 5 | 2 | 0 | 0 | 38 (61) |
During SW Monsoon 2025, Goa had 1% above normal monsoon, compared to 46% above normal rainfall in 2024, 12% above normal in 2023 and 8% below normal in 2022. This is also reflected in decrease in the number of high rainfall days to 38 in 2025 from 61 in 2024, 35 in 2022, 48 in 2023. About half the number of High Rainfall district days occurred in July 2025, like in July 2024.
Maharashtra
| Month | No of districts that had over 50 mm rainfall in at least one day in monsoon 2025 (total no of districts) | No of district days when rainfall 50-100 mm | No of district days when rainfall 100-150 mm | No of district days when rainfall 150-200 mm | No of district days when rainfall 200-250 mm | No of district days when rainfall 250+ mm | TOTAL no of dist days when rainfall over 50 mm |
| June 2025 | 11 (36) | 29 | 8 | 0 | 0 | 0 | 37 |
| July 2025 | 15 | 46 | 9 | 0 | 0 | 0 | 55 |
| Aug 2025 | 20 | 41 | 10 | 6 | 3 | 0 | 60 |
| Sept 2025 | 20 | 40 | 4 | 1 | 0 | 0 | 45 |
| SW Monsoon 2025 | 31 (36) | 156 | 31 | 7 | 3 | 0 | 197 (225) |
SW Monsoon 2025 rainfall in Maharashtra was 20% above normal, compared to 26% above normal in 2024, 3% below normal in 2023 and 23% above normal in 2022. This is also reflected in number of instances of high rainfall events in 2025 (197) compared to those in 2024 (225), 2023 (177) and 2022 (205). 134 (161 in 2024 and 134 in 2023) of the 197 instances given in table above happened in Konkan districts with highest number of such instances in Raigarh and Ratnagiri (24 each). Outside Konkan, the highest number of high rainfall events in SW Monsoon 2024 happened in Gadchiroli (7) and Kolhapur (6), like in case of 2024 and 2023.
Chhattisgarh
| Month | No of districts that had over 50 mm rainfall in at least one day in monsoon 2025 (total no of districts) | No of district days when rainfall 50-100 mm | No of district days when rainfall 100-150 mm | No of district days when rainfall 150-200 mm | No of district days when rainfall 200-250 mm | No of district days when rainfall 250+ mm | TOTAL no of dist days when rainfall over 50 mm |
| June 2025 | 4 (33) | 5 | 0 | 0 | 0 | 0 | 5 |
| July 2025 | 25 | 52 | 1 | 0 | 0 | 0 | 53 |
| Aug 2025 | 8 | 13 | 3 | 0 | 0 | 0 | 16 |
| Sept 2025 | 16 | 21 | 1 | 0 | 0 | 0 | 22 |
| SW Monsoon 2025 | 29 (33) | 91 | 5 | 0 | 0 | 0 | (110) |
The rainfall in Chhattisgarh in SW Monsoon 2025 was 3% above normal, compared to 9% above normal in 2024, 4% below normal in 2023 and 13% above normal in 2022. The number of instances of high rainfall event are thus 96 in SW Monsoon 2025 compared to 110 in 2024, 90 in 2023 and 110 in 2022. Mohala Manpur Chowki district had the highest number of such instances at 7.
WEST INDIA
| State | Districts that had over 50 mm rainfall at least on one day in SW Monsoon 2025 (Total no of districts) | No of district days when rainfall 50-100 mm | No of district days when Rainfall 100-150 mm | No of district days when Rainfall 150-200 | No of district days when Rainfall 200-250 | No of district days when Rainfall over 250 mm | Total no of district days when rainfall over 50 mm |
| Rajasthan | 28 (33) | 76 | 11 | 0 | 1 | 0 | 88 |
| Madhya Pradesh | 49 (52) | 148 | 28 | 4 | 0 | 0 | 180 |
| Diu Daman, Dadra Nagahaveli | 3 (3) | 26 | 7 | 2 | 1 | 1 | 37 |
| Gujarat | 33 (33) | 117 | 18 | 3 | 2 | 0 | 140 |
| Goa | 2 (2) | 31 | 5 | 2 | 0 | 0 | 38 |
| Maharashtra | 31 (36) | 156 | 31 | 7 | 3 | 0 | 197 |
| Chhattisgarh | 29 (33) | 91 | 5 | 0 | 0 | 0 | 96 |
| West India | 175 (192) | 645 (659) | 105 (173) | 18 (27) | 7 (7) | 1 (7) | 776 (873) |
The SW Monsoon 2025 thus had 776 high rainfall district days in West India compared to 873 in 2024, 649 in 2023, 793 in 2022 and 598 in 2021.
| Month | No of districts that had over 50 mm rainfall in at least one day in monsoon 2025 (total no of districts) | No of district days when rainfall 50-100 mm | No of district days when rainfall 100-150 mm | No of district days when rainfall 150-200 mm | No of district days when rainfall 200-250 mm | No of district days when rainfall 250+ mm | TOTAL no of dist days when rainfall over 50 mm |
| June 2025 | 64 (192) | 111 | 23 | 2 | 2 | 0 | 138 |
| July 2025 | 127 | 284 | 45 | 5 | 0 | 0 | 334 |
| Aug 2025 | 75 | 119 | 24 | 10 | 4 | 0 | 157 |
| Sept 2025 | 88 | 131 | 13 | 1 | 1 | 1 | 147 |
| SW Monsoon 2025 | 175/192 | 645 | 105 | 18 | 7 | 1 | 776 |
SOUTH INDIA: Andhra Pradesh
| Month | No of districts that had over 50 mm rainfall in at least one day in monsoon 2025 (total no of districts) | No of district days when rainfall 50-100 mm | No of district days when rainfall 100-150 mm | No of district days when rainfall 150-200 mm | No of district days when rainfall 200-250 mm | No of district days when rainfall 250+ mm | TOTAL no of dist days when rainfall over 50 mm |
| June 2025 | 0 (26) | 0 | 0 | 0 | 0 | 0 | 0 |
| July 2025 | 0 | 0 | 0 | 0 | 0 | 0 | 0 |
| Aug 2025 | 12 | 12 | 5 | 0 | 0 | 0 | 17 |
| Sept 2025 | 2 | 2 | 0 | 0 | 0 | 0 | 2 |
| SW Monsoon 2025 | 13 (26) | 14 | 5 | 0 | 0 | 0 | 19 (47) |
The number of high rainfall days in Andhra Pradesh in SW Monsoon 2025 is at 19, compared to 47 in 2024, 18 in 2023, 4 in 2022 and 7 in 2021. Andhra Pradesh rainfall in SW Monsoon 2025 was 6% above normal. NTR district had the highest number (3) of high rainfall district days.
Telangana
| Month | No of districts that had over 50 mm rainfall in at least one day in monsoon 2025 (total no of districts) | No of district days when rainfall 50-100 mm | No of district days when rainfall 100-150 mm | No of district days when rainfall 150-200 mm | No of district days when rainfall 200-250 mm | No of district days when rainfall 250+ mm | TOTAL no of dist days when rainfall over 50 mm |
| June 2025 | 1 (33) | 1 | 0 | 0 | 0 | 0 | 1 |
| July 2025 | 8 | 10 | 1 | 0 | 0 | 0 | 11 |
| Aug 2025 | 29 | 54 | 8 | 0 | 1 | 0 | 63 |
| Sept 2025 | 15 | 19 | 0 | 0 | 0 | 0 | 19 |
| SW Monsoon 2025 | 30 (33) | 84 | 9 | 0 | 1 | 0 | 94 (84) |
Telangana rainfall in SW Monsoon 2025 was 30% above normal (27% above normal in 2024). Rainfall was 15% above normal in SW Monsoon 2023 and yet the number of high rainfall district days in 2023 (108) were much higher than those in SW Monsoon 2025 (94) and 2024 (84).
Tamil Nadu
| Month | No of districts that had over 50 mm rainfall in at least one day in monsoon 2025 (total no of districts) | No of district days when rainfall 50-100 mm | No of district days when rainfall 100-150 mm | No of district days when rainfall 150-200 mm | No of district days when rainfall 200-250 mm | No of district days when rainfall 250+ mm | TOTAL no of dist days when rainfall over 50 mm |
| June 2025 | 0 (38) | 0 | 0 | 0 | 0 | 0 | 0 |
| July 2025 | 0 | 0 | 0 | 0 | 0 | 0 | 0 |
| Aug 2025 | 6 | 8 | 0 | 0 | 0 | 0 | 8 |
| Sept 2025 | 7 | 6 | 1 | 0 | 0 | 0 | 7 |
| SW Monsoon 2025 | 11 (38) | 14 | 1 | 0 | 0 | 0 | 15 (13) |
Rainfall in Tamil Nadu in SW Monsoon 2025 was 1% below normal, compared to 18% above normal in 2924, 8% above normal in 2023.
Puducherry
| Month | No of districts that had over 50 mm rainfall in at least one day in monsoon 2025 (total no of districts) | No of district days when rainfall 50-100 mm | No of district days when rainfall 100-150 mm | No of district days when rainfall 150-200 mm | No of district days when rainfall 200-250 mm | No of district days when rainfall 250+ mm | TOTAL no of dist days when rainfall over 50 mm |
| June 2025 | 2 (4) | 9 | 0 | 0 | 0 | 0 | 9 |
| July 2025 | 2 | 5 | 1 | 0 | 0 | 0 | 6 |
| Aug 2025 | 3 | 3 | 3 | 0 | 0 | 0 | 6 |
| Sept 2025 | 2 | 4 | 0 | 0 | 0 | 0 | 4 |
| SW Monsoon 2025 | 4 (4) | 21 | 4 | 0 | 0 | 0 | 25 (25) |
Puducherry in SW Monsoon 2025 had 32% above normal (19% above normal in 2024) rainfall with Mahe district having by far the highest rainfall at 2490.4 mm, 3% above normal rainfall. The Highest surplus % was for Puducherry district at 49%.
Karnataka
| Month | No of districts that had over 50 mm rainfall in at least one day in monsoon 2025 (total no of districts) | No of district days when rainfall 50-100 mm | No of district days when rainfall 100-150 mm | No of district days when rainfall 150-200 mm | No of district days when rainfall 200-250 mm | No of district days when rainfall 250+ mm | TOTAL no of dist days when rainfall over 50 mm |
| June 2025 | 7 (31) | 20 | 6 | 1 | 0 | 0 | 27 |
| July 2025 | 5 | 42 | 1 | 1 | 0 | 0 | 44 |
| Aug 2025 | 12 | 27 | 1 | 0 | 0 | 0 | 28 |
| Sept 2025 | 9 | 9 | 0 | 0 | 0 | 0 | 9 |
| SW Monsoon 2025 | 21 (31) | 98 | 8 | 2 | 0 | 0 | 108 (119, 61, 143) |
Karnataka had 14% (11% in 2024) above normal rainfall in SW Monsoon 2025, but the number of high rainfall district days have reduced in 2025 compared to the same in 2024. Interestingly, the number of high rainfall district days are highest in July 2025 in SW Monsoon 2025, but the number of district covered in July 2025 (5) are the least among the months in SW Monsoon 2025.
Kerala
| Month | No of districts that had over 50 mm rainfall in at least one day in monsoon 2025 (total no of districts) | No of district days when rainfall 50-100 mm | No of district days when rainfall 100-150 mm | No of district days when rainfall 150-200 mm | No of district days when rainfall 200-250 mm | No of district days when rainfall 250+ mm | TOTAL no of dist days when rainfall over 50 mm |
| June 2025 | 13 (14) | 38 | 3 | 0 | 0 | 0 | 41 |
| July 2025 | 10 | 21 | 3 | 0 | 0 | 0 | 24 |
| Aug 2025 | 5 | 9 | 2 | 0 | 0 | 0 | 11 |
| Sept 2025 | 4 | 3 | 1 | 0 | 0 | 0 | 4 |
| SW Monsoon 2025 | 14 (14) | 71 | 9 | 0 | 0 | 0 | 80 (93, 91) |
Kerala rainfall in SW Monsoon 2025 was 13% below normal (14% in 2024), similar to the case in 2022 monsoon when rainfall was 13% below normal. In 2023 SW Monsoon, rainfall in Kerala was even lower at 34% below normal.
Andaman & Nicobar Islands
| Month | No of districts that had over 50 mm rainfall in at least one day in monsoon 2025 (total no of districts) | No of district days when rainfall 50-100 mm | No of district days when rainfall 100-150 mm | No of district days when rainfall 150-200 mm | No of district days when rainfall 200-250 mm | No of district days when rainfall 250+ mm | TOTAL no of dist days when rainfall over 50 mm |
| June 2025 | 3 (3) | 8 | 2 | 0 | 0 | 0 | 10 |
| July 2025 | 1 | 1 | 0 | 0 | 0 | 0 | 1 |
| Aug 2025 | 3 | 6 | 0 | 0 | 0 | 0 | 6 |
| Sept 2025 | 3 | 13 | 0 | 0 | 0 | 0 | 13 |
| SW Monsoon 2025 | 3 (3) | 28 | 2 | 0 | 0 | 0 | 30 (33, 33) |
Lakshadweep Islands
| Month | No of districts that had over 50 mm rainfall in at least one day in monsoon 2025 (total no of districts) | No of district days when rainfall 50-100 mm | No of district days when rainfall 100-150 mm | No of district days when rainfall 150-200 mm | No of district days when rainfall 200-250 mm | No of district days when rainfall 250+ mm | TOTAL no of dist days when rainfall over 50 mm |
| June 2025 | 0 (1) | 0 | 0 | 0 | 0 | 0 | 0 |
| July 2025 | 0 | 0 | 0 | 0 | 0 | 0 | 0 |
| Aug 2025 | 1 | 1 | 0 | 0 | 0 | 0 | 1 |
| Sept 2025 | 0 | 0 | 0 | 0 | 0 | 0 | 0 |
| SW Monsoon 2025 | 1 (1) | 1 | 0 | 0 | 0 | 0 | 1 (6) |
SOUTH INDIA In the table below we have given total number of high rainfall district day figures for each of the states in South India and for South India as a region.
| State | Districts that had over 50 mm rainfall at least on one day in SW Monsoon 2025 (Total no of districts) | No of district days when rainfall 50-100 mm | No of district days when Rainfall 100-150 mm | No of district days when Rainfall 150-200 | No of district days when Rainfall 200-250 | No of district days when Rainfall over 250 mm | Total no of district days when rainfall over 50 mm |
| Andhra Pradesh | 13 (26) | 14 | 5 | 0 | 0 | 0 | 19 |
| Telangana | 30 (33) | 84 | 9 | 0 | 1 | 0 | 94 |
| Tamil Nadu | 11 (38) | 14 | 1 | 0 | 0 | 0 | 15 |
| Puducherry | 4 (4) | 21 | 4 | 0 | 0 | 0 | 25 |
| Karnataka | 21 (31) | 98 | 8 | 2 | 0 | 0 | 108 |
| Kerala | 14 (14) | 71 | 9 | 0 | 0 | 0 | 80 |
| Lakshadweep | 1 (1)1 | 1 | 0 | 0 | 0 | 0 | 1 |
| Andaman & Nicobar | 3 (3) | 28 | 2 | 0 | 0 | 0 | 30 |
| South India | 99 (150) | 331 | 38 | 2 | 1 | 0 | 372 (400, 306, 435) |
In the table below we have given total number of high rainfall district day figures for each of the monsoon months during SW Monsoon 2025 and total for SW Monsoon 2025 for South India as a region.
| Month | No of districts that had over 50 mm rainfall in at least one day in monsoon 2025 (total no of districts) | No of district days when rainfall 50-100 mm | No of district days when rainfall 100-150 mm | No of district days when rainfall 150-200 mm | No of district days when rainfall 200-250 mm | No of district days when rainfall 250+ mm | TOTAL no of dist days when rainfall over 50 mm |
| June 2025 | 26 (150) | 76 | 11 | 1 | 0 | 0 | 88 |
| July 2025 | 26 | 79 | 6 | 1 | 0 | 0 | 86 |
| Aug 2025 | 71 | 120 | 19 | 0 | 1 | 0 | 140 |
| Sept 2025 | 42 | 56 | 2 | 0 | 0 | 0 | 58 |
| SW Monsoon 2025 | 99 | 331 | 38 | 2 | 1 | 0 | 372 |
INDIA In the table below we have given number of high rainfall instances in each of the five regions of India during SW Monsoon 2025 and total for India.
| Region | Districts that had over 50 mm rainfall at least on one day in SW Monsoon 2025 (Total no of districts) | No of district days when rainfall 50-100 mm | No of district days when Rainfall 100-150 mm | No of district days when Rainfall 150-200 | No of district days when Rainfall 200-250 | No of district days when Rainfall over 250 mm | Total no of district days when rainfall over 50 mm |
| North East | 88 (104) | 355 | 25 | 7 | 2 | 2 | 391 |
| East | 145 (190) | 351 | 44 | 9 | 1 | 0 | 405 |
| North | 77 (102) | 238 | 35 | 2 | 5 | 0 | 280 |
| West | 175 (192) | 645 | 105 | 18 | 7 | 1 | 776 |
| South | 99 (150) | 331 | 38 | 2 | 1 | 0 | 372 |
| INDIA | 510 (738) | 1920 | 247 | 38 | 16 | 3 | 2224 (2555, 2176, 2377) |
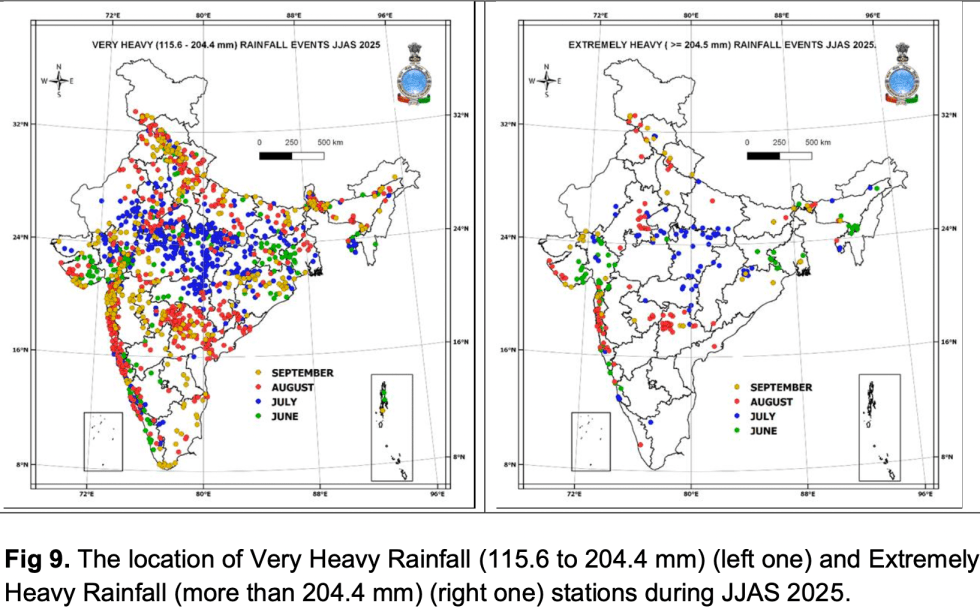
The High rainfall events in 2020-2025 SW monsoon cross India as per India Meteorological department are as follows. Their definition of such events are different: Very Heavy Rainfall (VHR) 115.6-204.5 mm and Extremely Heavy Rainfall (EHR) above 204.5 mm in a day at any station. Map from IMD Press Release of Sept 30 2025 depicting the location of such events in 2025 SW monsoon is given below.
| 2020 (956.7 mm) | 2021 (874.6 mm) | 2022 (925 mm) | 2023 (820 mm) | 2024 (934.8 mm) | |||||||||||
| VHR | EHR | Total | VHR | EHR | Total | VHR | EHR | Total | VHR | EHR | Total | VHR | EHR | Total | |
| Jun | 262 | 36 | 298 | 277 | 35 | 312 | 237 | 80 | 317 | 429 | 65 | 494 | 284 | 51 | 335 |
| Jul | 447 | 90 | 537 | 638 | 121 | 759 | 829 | 131 | 960 | 1113 | 205 | 1318 | 1059 | 194 | 1253 |
| Aug | 1008 | 272 | 1173 | 272 | 28 | 300 | 577 | 63 | 640 | 402 | 66 | 468 | 762 | 132 | 894 |
| Sep | 308 | 61 | 369 | 449 | 89 | 538 | 231 | 22 | 253 | 377 | 85 | 462 | 527 | 96 | 623 |
| Total | 1912 | 341 | 2253 | 1636 | 273 | 1909 | 1874 | 296 | 2176 | 2321 | 421 | 2792 | 2632 | 473 | 3105 |

| 2025 (937.2 mm) | |||
| VHR | EHR | Total | |
| Jun | 432 | 70 | 502 |
| Jul | 673 | 84 | 757 |
| Aug | 692 | 108 | 800 |
| Sep | 312 | 41 | 353 |
| Total | 2109 | 303 | 2412 |
In the table above the figures in the bracket with the year is the SW Monsoon rainfall of those respective years. Here we can see that even though the highest rainfall in these six years was in 2020 at 956.7 mm, the highest number of Very High and Extremely Rainfall and their total have all been the highest for 2024 when the SW Monsoon rainfall at 934.8 mm was lower than that in 2020. This is possibly an indication of increasing intensification of rainfall pattern with changing climate.
The figures of Very High and Extremely High Rainfall frequency in SW Monsoon are several times higher than those of 100-200 mm and 200+ mm rainfall in our district wise rainfall figures since the former figures are station wise whereas the latter are the average of all stations in any district.
SANDRP (ht.sandrp@gmail.com)
