An analysis of the daily district wise rainfall data from India Meteorological Department (IMD) for July 2025 shows that there were 718 (down from 914 in July 2024, 855 in July 2023, 809 in July 2022 and almost same as 717 in July 2021) instances when district rainfall of a day was above 50 mm. Such high rainfall instances included 635 (down from 730 in July 2024, 660 in July 2023, 663 in July 2022, up from 595 in July 2021) instances when rainfall was 50-100 mm, 75 (143 in July 2024, 149 in July 2023, 107 in July 2022, 98 in July 2021) instances when it was 100-150 mm, 7 (27 in July 2024, 34 in July 2023, 28 in July 2022, 17 in July 2021) times when it was 150-200 mm and just 1 (14 in July 2024, 12 in July 2023, 16 in July 2022 and 7 in July 2021) time when rainfall in July 2025 when rainfall was above 200 mm.
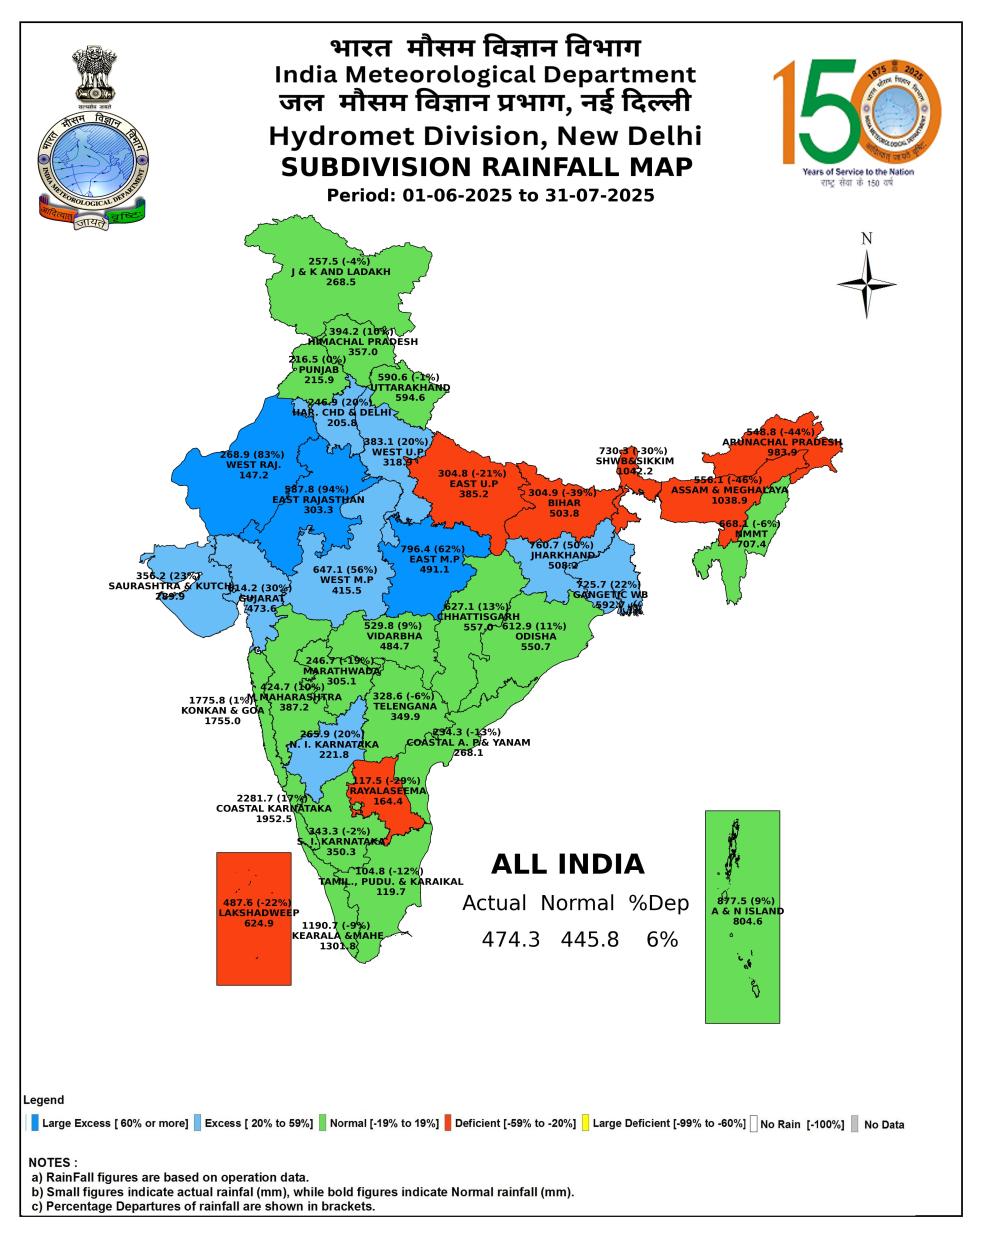
As noted in earlier article[i], the July 2025 rainfall all over India was 4.9% above normal.
Out of 738 districts of India, 328 districts or about 44.4 % (43.6% in July 2024, 44.4% in July 2023, 44.8% in July 2022) of the districts experienced rainfall over 50 mm at least one day in July 2025. There were of course many districts that had more than one such high rainfall days in July 2024. The highest number of such instances in July 2024 were seen in Madhya Pradesh (132), followed by Mah (55) and Chhattisgarh (53).
The distribution of number of high rainfall events in various rainfall ranges (50-100 mm, 100-150 mm, 150-200 mm, 200-250 mm and above 250 mm) for July 2021 to 2025 can be seen in following table.
| July 2021 | July 2022 | July 2023 | July 2024 | July 2025 | |
| 50-100 mm | 595 | 663 | 660 | 730 | 635 |
| 100-150 mm | 98 | 107 | 149 | 143 | 75 |
| 150-200 mm | 17 | 23 | 34 | 27 | 7 |
| Over 200 mm | 7 | 16 | 12 | 14 | 1 |
| TOTAL | 717 | 809 | 855 | 914 | 718 |
| July All India rainfall, mm | 266.1 | 327.7 | 318.4 | 306.6 | 294.3 |
As we can see from the table above, number of high rainfall district days for July 2025 is the lowest in last four years as the was the lowest for July 2025 compared to July rainfall in last four years.
| July 2021 | July 2022 | July 2023 | July 2024 | July 2025 | |
| North East | 77 | 95 | 117 | 155 | 103 |
| East | 161 | 58 | 96 | 157 | 135 |
| North | 111 | 78 | 144 | 47 | 60 |
| West | 221 | 376 | 298 | 368 | 334 |
| South | 147 | 224 | 200 | 187 | 86 |
| No of districts that had such instances | 357/ 694 | 315/ 703 | 318/ 717 | 318/729 | 328/738 |
Among the five regions of India (North, South, East, West and North East), in July 2025, West India again, like in each July in last five years, had the highest number of such instances at 334, followed by East India (135) and North East India (103). North India in July 2025, like in July 2024 and 2021, had the least such instances.
In the sections below we give the distribution of high rainfall district days in region and each state within each region.
North East India
| State | Districts that had over 50 mm rainfall at least on one day in July 2025 (Total no of districts) | No of district days when rainfall 50-100 mm | No of district days when Rainfall 100-150 mm | No of district days when Rainfall 150-200 | No of district days when Rainfall 200-250 mm | No of district days when Rainfall over 250 mm | Total no of district days when rainfall over 50 mm |
| Arunachal Pradesh | 7 (16) | 18 | 0 | 0 | 0 | 0 | 18 |
| Assam | 18 (35) | 26 | 2 | 0 | 0 | 0 | 28 |
| Meghalaya | 6 (11) | 13 | 1 | 0 | 0 | 0 | 14 |
| Nagaland | 5 (11) | 9 | 0 | 0 | 0 | 0 | 9 |
| Manipur | 1 (9) | 1 | 0 | 0 | 0 | 0 | 1 |
| Mizoram | 6 (8) | 10 | 0 | 0 | 0 | 0 | 10 |
| Tripura | 6 (8) | 12 | 1 | 0 | 0 | 1 | 14 |
| Sikkim | 5 (6) | 7 | 2 | 0 | 0 | 0 | 9 |
| North East India | 54 (104) | 96 | 6 | 0 | 0 | 1 | 103 |
East India
| State | Districts that had over 50 mm rainfall at least on one day in July 2025 (Total no of districts) | No of district days when rainfall 50-100 mm | No of district days when Rainfall 100-150 mm | No of district days when Rainfall 150-200 | No of district days when Rainfall 200-250 mm | No of district days when Rainfall over 250 mm | Total no of district days when rainfall over 50 mm |
| W Bengal | 16 (23) | 29 | 3 | 0 | 0 | 0 | 32 |
| Odisha | 13 (30) | 20 | 0 | 0 | 0 | 0 | 20 |
| Jharkhand | 18 (24) | 29 | 3 | 0 | 0 | 0 | 32 |
| Bihar | 16 (38) | 16 | 1 | 0 | 0 | 0 | 17 |
| Uttar Pradesh | 21 (75) | 28 | 5 | 1 | 0 | 0 | 34 |
| East India | 84 (190) | 122 | 12 | 1 | 0 | 0 | 135 |
North India
| State/ Union Territory | Districts that had over 50 mm rainfall at least on one day in July 2025 (Total no of districts) | No of district days when rainfall 50-100 mm | No of district days when Rainfall 100-150 mm | No of district days when Rainfall 150-200 | No of district days when Rainfall 200-250 mm | No of district days when Rainfall over 250 mm | Total no of district days when rainfall over 50 mm |
| Uttarakhand | 9 (13) | 13 | 0 | 0 | 0 | 0 | 13 |
| Haryana | 6 (22) | 7 | 0 | 0 | 0 | 0 | 7 |
| Chandigarh | 0 (1) | 0 | 0 | 0 | 0 | 0 | 0 |
| Delhi | 5 (10) | 7 | 1 | 0 | 0 | 0 | 8 |
| Punjab | 5 (22) | 5 | 0 | 0 | 0 | 0 | 5 |
| Himachal Pradesh | 6 (12) | 15 | 1 | 0 | 0 | 0 | 16 |
| Jammu & Kashmir | 6 (20) | 7 | 4 | 0 | 0 | 0 | 11 |
| Ladakh | 0 (2) | 0 | 0 | 0 | 0 | 0 | 0 |
| North India | 37 (102) | 54 | 6 | 0 | 0 | 0 | 60 |
West India
| State | Districts that had over 50 mm rainfall at least on one day in July 2025 (Total no of districts) | No of district days when rainfall 50-100 mm | No of district days when Rainfall 100-150 mm | No of district days when Rainfall 150-200 | No of district days when Rainfall 200-250 mm | No of district days when Rainfall over 250 mm | Total no of district days when rainfall over 50 mm |
| Rajasthan | 20 (33) | 35 | 7 | 0 | 0 | 0 | 42 |
| Madhya Pradesh | 44 (52) | 105 | 23 | 4 | 0 | 0 | 132 |
| Diu, Daman, Dadra-NagarH | 2 (3) | 5 | 1 | 0 | 0 | 0 | 6 |
| Gujarat | 19 (33) | 27 | 2 | 0 | 0 | 0 | 29 |
| Goa | 2 (2) | 14 | 2 | 1 | 0 | 0 | 17 |
| Maharashtra | 15 (36) | 46 | 9 | 0 | 0 | 0 | 55 |
| Chhattisgarh | 25 (33) | 52 | 1 | 0 | 0 | 0 | 53 |
| West India | 127 (192) | 284 | 45 | 5 | 0 | 0 | 334 |
South India
| State | Districts that had over 50 mm rainfall at least on one day in July 2025 (Total no of districts) | No of district days when rainfall 50-100 mm | No of district days when Rainfall 100-150 mm | No of district days when Rainfall 150-200 | No of district days when Rainfall over 200 mm | No of district days when Rainfall over 200 mm | Total no of district days when rainfall over 50 mm |
| Andhra Pradesh | 0 (26) | 0 | 0 | 0 | 0 | 0 | 0 |
| Telangana | 8 (33) | 10 | 1 | 0 | 0 | 0 | 11 |
| Tamil Nadu | 0 (38) | 0 | 0 | 0 | 0 | 0 | 0 |
| Puducherry | 2 (4) | 5 | 1 | 0 | 0 | 0 | 6 |
| Karnataka | 5 (31) | 42 | 1 | 1 | 0 | 0 | 44 |
| Kerala | 10 (14) | 21 | 3 | 0 | 0 | 0 | 24 |
| Lakshadweep | 0 (1) | 0 | 0 | 0 | 0 | 0 | 0 |
| Andaman & Nicobar | 1 (3) | 1 | 0 | 0 | 0 | 0 | 1 |
| South India | 26 (150) | 79 | 6 | 1 | 0 | 0 | 86 |
INDIA In the table below we have tabulated the figures for high rainfall district days in July 2025 for each region.
| Region | Districts that had over 50 mm rainfall at least on one day in June 2025/Total no of districts | No of district days when rainfall 50-100 mm | No of district days when Rainfall 100-150 mm | No of district days when Rainfall 150-200 | No of district days when Rainfall 200-250 mm | No of district days when Rainfall over 250 mm | Total no of district days when rainfall over 50 mm |
| North East | 54/ 104 | 96 | 6 | 0 | 0 | 1 | 103 |
| East | 84/ 190 | 122 | 12 | 1 | 0 | 0 | 135 |
| North | 37/ 102 | 54 | 6 | 0 | 0 | 0 | 60 |
| West | 127/ 192 | 284 | 45 | 5 | 0 | 0 | 334 |
| South | 26/ 150 | 79 | 6 | 1 | 0 | 0 | 86 |
| INDIA | 328/ 738 | 635 | 75 | 7 | 0 | 1 | 718 |
SANDRP (ht.sandrp@gmail.com)
[i] https://sandrp.in/2025/08/01/june-july-2025-district-wise-rainfall-in-in-indias-sw-monsoon/
