
Guest Article by: J.Harsha
Introduction: In August, 2018, devastated floods occurred in the southern Indian state of Kerala that led to widespread death and destruction to livelihoods. One of the worst affected basins was Periyar River Basin (PRB). While investigating the role of dams in the devastating floods, an article titled, “Role of dams on the floods of August 2018 in Periyar River Basin, Kerala” by Sudheer et al., (2019) was first published in the Current Science1 Journal brought out by Indian Academy of Sciences, Bengaluru, India on 10th March 2019. The journal article by Sudheer et al., (2019) adopts hydrological model to investigate the role of dams in the occurrence of floods in PRB and concludes that dams had less or little role in the occurrence of floods in comparison to the natural reasons. However, when the article was reviewed, it was found that the authors Sudheer et al., (2019) had made fallacious assumptions, errors in their methodology, adopted poor data quality and they have arrived at erroneous inferences and conclusions such as exonerating the role of dams in Kerala floods but indicting the nature as the cause of floods. This review article therefore, using RS & GIS (Remote Sensing and Geographical Information System) techniques challenges their inferences that is based on fallacious assumptions, accumulated errors in their methodology and the poor data quality fed into the hydrological model.
The review article was submitted to Current Science but after keeping the rebuttal idle for more than six to seven months, Current Science abruptly communicated refusal to publish. Current Science did not conduct any peer-review, it did not share any of the refereed comments, it did not invite any rejoinder from the authors Sudheer et al., (2019) and none of the queries raised in the review article against the assumptions, methodologies and poor data quality adopted by Sudheer et al., (2019) were responded. Any journal that boasts itself as reputed scientific journal gives an opportunity for the evidence based alternate views/critique made against any article published in that journal. This is part of the evidence-based argumentation and scientific inquiry. However, ironically Current Science didn’t follow any of the scientific principles and persisted with one sided view of role of dams in Kerala floods camouflaged by “science”. The minimum Current Science could have done is to allow authors Sudheer et al., (2019) to respond to at least select disagreements or challenges which however did not happen. The fact that no peer review for this review article was conducted seems to show the extent of bias and polarization that has silently crept into Indian science thus manipulating the science to further vested interests. The ultimate casualty of this manipulation of science will be the flood management of India. The details of evidence based critique of article by Sudheer et al., (2019) is elaborated in subsequent sections.
In the article published by Current Science, Sudheer et al., (2019) inter alia make following inferences:
- The reported flows at downstream locations will be insensitive to the storage status of the reservoirs, if the reservoir is filled to less than 50% of its capacity.
- The bank full discharge at L1 and L2 approximately being 3400 m3/s and 4200 m3/s, it is apparent that the reservoir operation could not have helped in avoiding the flood situation.
- A quantitative comparison indicates that the hydrologic response of the major tributaries of the Periyar River was also significant in terms of magnitude of flows, compared to the reservoir releases.
- A major share of the peak flow at L2 is contributed by the catchment area of the major tributaries, such as Perinjankutty, Muthirapuzha and Idalamalayar.
- Compared to virgin simulations, which resulted in peak flow magnitudes 8224 m3/s and 11990 m3/s at L1 and L2 respectively, the reservoirs were effective in reducing the peak flows to the scale of 2500 m3/s.
To investigate the role of dams in Kerala floods and arrive at the above mentioned inferences, the authors have adopted HEC-HMS (Hydrological Engineering Center-Hydrological Modeling System) model for runoff simulations (i.e. data is fed into HEC-HMS model), SCS-CN method to generate runoff volume in PRB, land use/land cover types of PRB derived from IRS AWiFS data of year 2010, Central Water Commission (CWC) discharge data at Neeleshwaram (identified as L2) for validation of the simulations and IMD gridded data 0.25o X 0.25o.
Following are the assumptions made by the authors while investigating the role of dams in floods of PRB:
- SCS-CN method and λ = 0.2 is valid in PRB.
- The land use/land cover in PRB derived from the data for the year 2010 is valid in 2018.
- The drainage pattern of the PRB is dendritic in nature.
- Central Water Commission (CWC) observed data at L2 is good, continuous without any data gaps and fit enough for validation of simulated data.
- Error in classification of Lateritic soils classified as HSG-D soil
Sudheer et al., (2019) have fed these fallacious assumptions along with poor river discharge data into the HEC-HMS model in order to arrive at above mentioned inferences. In the process, they have ignored the accumulation of errors and larger and larger inaccuracies in the output. The fallacious assumptions, series of errors in methods and details of bad data are scientifically reviewed in this article using the methodology of RS & GIS techniques and the same are elaborated below.
- Is SCS-CN method valid for Periyar River Basin (PRB)?
Soil Conservation Services Curve Number2 (SCS-CN) method was formerly established by Soil Conservation Services, United State Department of Agriculture (USDA) in 1954 and recorded in National Engineering Handbook (NEH-4) Section 4 in 1956 (ref-3). The method is dependent on curve number (CN) values that range from 0 to 100 corresponding to various soil, land cover, land management conditions and moisture condition. According to USDA, this method was developed based on limited set of watershed data without peer-review. But the SCS-CN method was never developed with a focus on Indian watersheds.
Sudheer et al., (2019) in their research article published in Current Science, have adopted SCS-CN method for the computation of the infiltration losses from the rainfall and deriving runoff in HEC-HMS model. The authors have adopted the parameter λ = 0.2 for Indian watershed whereas λ = 0.2 was recommended by USDA for watersheds in USA. The SCS-CN formulae used by the authors are given below.


Where P = Precipitation in mm; Q = runoff in mm, CN = Curve Number; S = Retention and Ia = Initial Abstraction = λS, where λ = 0.2 recommended by USDA for watersheds of USA.
SCS-CN method adopts value of λ equal to 0.2 for the watersheds of USA and cannot be used for watershed of Periyar River Basin (PRB). Several scholars have raised doubts over its accuracy in predicting runoff even in the watersheds of USA. The details are documented by Faizalhakim et al. (2016)4. For example: P and Q data from 307 U.S. watersheds confirm that a value of λ=0.05 is a better fit for real data as compared to 0.2. Based on another study the data from 237 U.S. watersheds, the optimal model and the best value of λ was 0.01. From an experimental watershed in Attica, Greece, it has been reported that an average best-fit λ value of 0.014 and a value of 0.037 for a sub-watershed. In 186 Australian watersheds, the suggested λ value was determined to be 0.05. Another study, in an experimental watershed in the Three Gorges area of China, found the value of λ to range between 0.010 and 0.154 with a median of 0.048. In one of the most recent studies for the selection of SCS model parameters, Yuan et al. (2014) found that λ varies from 0.01 to 0.53, and the best-fit values vary from 0.01 to 0.1 for semiarid watersheds in southeastern Arizona. Thus, different regional and climatic conditions represent different value of initial abstractions and hence it is vital that steps on determination of accurate λ value be taken to obtain better output.
According to Eli and Lamont (2010)5, many of users of SCS-CN method do not appreciate its limitations and believe that the method is fully investigated, documented and peer-reviewed since the method is developed by a respected government agency. Eli and Lamont (2010) recommend CN values are determined independently for local conditions. Just because SCS-CN method is derived by a respected government agency of USA, Sudheer et al., (2019) have blindly adopted the method in PRB.
On the contrary, Sudheer et al., (2019) haven’t showed any results of research conducted by them to prove that λ = 0.2 is suitable for Indian watersheds or at most it suits PRB before blindly adopting SCS-CN method that was developed for watersheds of USA. Just substitute in λ = 0.2 with the values of 0.05, 0.037, 0.014, 0.01, 0.1, 0.53, the HEC-HMS model gives completely diverse infiltration losses and runoff output for the very same Periyar River Basin (PRB). Therefore, the results of HEC-HMS model as a consequence of λ = 0.2 are suspect and inferences drawn from such suspected results pertaining to peak flow at L2 contributed by tributaries, bank full discharges, the comparisons between virgin simulations and role of reservoirs etc., are all distorted.
2. Whether land use/land cover for the year 2010 is valid for August 2018?
The CN value of the SCS-CN method adopted by authors to calculate the infiltration losses depends on the type and extent of land use/land cover in the river basin. In fact, the CN value is never constant even within a year due to the change in vegetation pattern between seasons that influences the quantity of infiltration into soil. Higher the forested area, larger will be the infiltration and similarly increase in the urbanization reduces infiltration. In stark contrast to the basic hydrology, authors have adopted a land use/land cover that existed in year 2010 based on IRS (Indian Remote Sensing) satellite AWiFS (Advanced Wide Field Sensor) data and extrapolated the infiltration and runoff results to the year 2018 when the unfortunate floods occurred. In other words, they have assumed stationarity of runoff processes in PRB. This is not only adoption of bad data and fallacious assumption but also an attempt to mislead the casualty of Kerala floods.

(Source: Author using ArcGIS 10.2)
As a demonstration, the vegetation cover map of PRB has been derived (Fig 1) using Landsat 8 satellite image using supervised classification in ERDAS Imagine 9.1 that shows marked difference between the overall vegetation cover of 2010 adopted by the authors. The estimated overall vegetation cover in 2019 based on supervised classification is found to be 3091 km2. Sudheer et al., (2019) do not provide any information of the estimate of overall vegetation cover or estimate of classes within vegetation for the year 2010. The very fact that SCS-CN method isn’t tested for PRB and over that adoption of land use/land cover by the authors wrongly for the year 2010 generates large error that accumulates in the output of HEC-HMS model. As HEC-HMS is a mathematic model that gives output for any data input, all the flow hydrographs derived by the authors from HEC-HMS model are therefore distorted and misleading. So, the data validity shown by Sudheer et al., (2019) based on such flow hydrographs corresponding to different reservoir storages (85%, 75%, 50% and 25%), simulated discharges of 9965 m3/s at L2, 2763 m3/s at upstream of PRB, the margin of error shown between simulated and measured discharges can only be either coincidental or manipulated.
The authors despite having affiliated to elite academic institutions have failed to develop indigenous scientific methods to find appropriate value of λ applicable to Indian watersheds.
3. Is PRB dendritic?
One of the pre-conditions or pre-requisite for adoption of HEC-HMS model for runoff simulations in river basins is that the river basins should be in possession of dendritic stream networks (HEC-HMS user’s manual, page no.8, 2016). According to Sudheer et al, (2019) HEC-HMS is a semi-distributed hydrologic model that possesses ability to perform and simulate in dendritic watershed systems. Therefore, the easiest way that the authors found a way to fit the HEC-HMS model to PRB is to declare PRB as dendritic river basin. But whether PRB is dendritic?


According to Howard6 (1967), dendritic drainage pattern appear in river basins that possess uniformly resistant crystalline rocks with a gentle regional slope at present or at the time of inception. Whether PRB is a basin with gentle slope or uniformly resistant crystalline rocks?

No substantiation have been provided by the authors to show that the PRB in fact a gentle slope basin with uniformly resistant crystalline rocks. Fig 3 shows slope map of Periyar river basin (PRB) that is located in Western Ghats region with the highest point in the basin being 2674 m above mean seas level and the lowest point being the sea level that illustrates the point that this basin is at least not a gentle sloped basin. Fig 2 clearly depicts that the basin does not possess gentle slope. This contradicts author’s claim that PRB is a dendritic basin.
Schumm7 et al (2000), point that in areas of elongated landforms with moderate to steep slopes, the parallel drainage pattern is dominant. Visual examination of the PRB in Fig 2 shows that the basin is elongated. Similarly, visual examination of the drainage pattern in Fig 3 shows that the drainage pattern more resembles parallel and rectangular pattern in different parts rather than dendritic drainage pattern.
In addition to visual examination, this author tested the steepness of the basin and elongation of the basin using quantitative factors such as relief ratio, elongation ratio based on the ratio of the long edge to short edge of the minimum bounding rectangle (MBR) and the elongation ratio based on the length of longest drainage line8. The results of relief ratio, MBR and elongation ratio are conclusive.
- Basin relief:
Basin relief = Highest Elevation – Lowest Elevation
= 2674 – 0 = 2674 m

- Elongation ratio
The length of longest drainage line is 242.77 km. The same is considered as basin length. Area of Periyar basin is 6273 km2.

= 0.37
Elongation ratio values range between 1 for a circle to 0 for a straight line. Strahler10 (1964) states that basin elongation ratios run between 0.6 and 1.0 over a wide variety of climatic and geologic types. Values close to 1.0 are typical of regions of very low relief, whereas values of 0.6-0.8 are usually associated with high relief and steep ground slope. The varying shapes of basins can be classified with the help of the index of elongation ratio, i.e. circular (0.9-0.10), oval (0.8-0.9), less elongated (0.7-0.8), elongated (0.5-0.7), and highly elongated (less than 0.5).
- Minimum Bound Rectangle (MBR):


(Where e1 = long edge and e2 is the short edge of the MBR shown in Fig.4)

(Source: Zhang and Gilbert, 2013 and Author using ArcGIS 10.2)
Hence, the evidence clearly points to the fact that Periyar river basin possesses a very high to high elongated shape with high relief thus conforming to Schumm (2000) that the basin is in possession of the parallel drainage pattern. In contrast, Sudheer et al, (2019) doesn’t provide any evidence as to how such a highly elongated basin with steep slopes can possess dendritic drainage pattern.
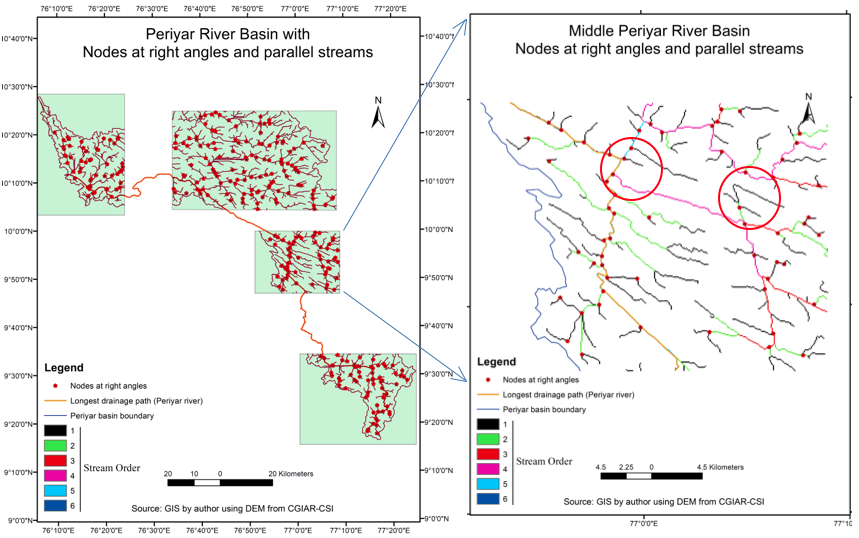
Further, Zhang and Guilbert (2013) provide geometric quantitative indicators to recognize different drainage patterns such as dendritic, parallel, trellis and rectangular patterns. According to them, average junction angle is one quantitative factor. For rectangular drainage pattern, the average junction angles in tributary streams make sharp bends almost to a right angle. Differentiation of drainage patterns has also been made based on the tributary junction angles after Abrahams and Flint11 (1983) and Ichoku and Chorowicz12 (1994) which according to them rectangular and trellis stream network show abundance of right and obtuse junction angles respectively. On sample basis, this author also checked the quantitative factor i.e. junction angle of tributaries in Periyar river basin. The calculation of the junction angle is based on the arc-cosine elaborated by Zhang and Guilbert (2013).
For a tributary joining main river at junction say P1, if points P2 and P3 are the “from” nodes of the upstream side of river and the tributary, the junction angle is computed by the law of cosines where a is the distance between P1 and P2, b is the distance between P1 and P3, and c is the distance between P2 and P3. The distances are calculated in ArcGIS 9.2.

The results shown in Fig 5 are conclusive because most of the junction angles in Periyar river basin showed either right angle or close to right angles of 91o, 82o, 99o etc., and several streams are also parallel to each other with almost equal or low junction angles on one side.
Based on above illustrations and evidence it is clear that, Sudheer et al., (2019) have declared PRB dendritic drainage basin just for the sake of fitting the basin in HEC-HMS model and generate runoff, confirming the authors’ bias towards exonerating the role of dams in Kerala floods. Therefore, simulations apart, the very basis of fitting HEC-HMS model for PRB by the authors questionable.
4. Quality of discharge data for validation of HEC-HMS simulations
Sudheer et al., (2019) have adopted the discharge data at Neeleshwaram to validate the results of HEC-HMS model. But the authors are silent on the quality of discharge data at Neeleshwaram referred as L2. This author downloaded the discharge data of Central Water Commission (CWC) at Neeleshwaram from India-WRIS. The data was analysed and the same is shown in Table 1 and Table 2. From the Table 1 and 2, it is clear that there has been no observed data for three years 1991, 1992 and 1993. For the years 2006, 2007 and 2008 computed data dominates for 74% of the data for these years, and this is a huge data gap. There is no explanation as to why there has been no observed data for the years 1991, 1992 and 1993 and similarly why the computed data dominates for the years 2006, 2007 and 2008. Only 67% data is observed and the rest is computed or no data sets (Table 2 and Table 3).
Further examination of the discharge data shows that the computed data spans across several years, several days or weeks continuously. It is not sporadic or occasional or doesn’t seem to be dictated by an emergency that prevented from taking direct observations. And conspicuously, the article keeps stoic silence with reference to the stage-discharge curve used at Neeleshwaram site (L2) or the extensive data gaps found in the discharge data at Neeleshwaram (L2). Instead, the erroneous results of HEC-HMS model are validated with bad discharge data at L2. (if this article was impartial, the authors were supposed to reveal the stage – discharge curve as well as year when cross section was assessed as it is they who are exonerating the role of dams through their hydraulic models.)


5. Lateritic soils classified as HSG-D soil is an error
Sudheer et al., (2019) in their article, state that the downstream areas of PRB is dominated by lateritic soil interspersed with alluvial soils, however they also state that poorly drained soils classified as Hydrological Soil Group or HSG-D) are mainly distributed in the downstream parts of PRB. This appears ostensibly to link it with the flooding other than dams. This is an error because lateritic soils possess excellent drainability13. That PRB is dominated by lateritic soil interspersed with alluvial soil in its downstream areas and classifying them as poorly drained soils (Hydrological Soil Group D) in the very same downstream parts is contradictory that will only influence the output of HEC-HMS model confirming the belief of authors.
Finally, the distorted results due to feeding bad data and fallacious assumptions into HEC-HMS model are all listed in Table 3 below.

6. Where are the reservoir rule curves?
The authors, in their article, do not reveal any data with respect to the reservoir rule curves for all the seventeen reservoirs of PRB. They do not provide any information whether these reservoir rule curves in fact exist; or if existing, whether they were followed by the project officials in-charge of these dams before and during floods. The article is also silent regarding the manner in which the releases from the dams were executed by the project authorities in the absence of reservoir rule curves. Further, the authors’ do not state the age of these seventeen reservoirs of PRB and the eventual loss of live storage in these reservoirs. The loss of live storage of aging large dams has severe repercussions on the operations of reservoir and attenuation of flood peaks14. This is a blind spot of the article. The only information that the authors provide is that the reservoirs were full at FRL before the onset of extreme rainfall of August that shows there was no choice left for project officials except discharge water from reservoirs. That most of the dams of Kerala were full by the end of July 2018 has been confirmed by Thakkar (2018)15.
7. Conclusions:
Hydrology like meteorology is dynamic and non-linear system. Any introduction of small errors in the hydrological models will accumulate leading to large errors and inaccuracies. With parameter λ = 0.2 applicable to watersheds in USA, the SCS-CN method distorts the infiltration losses and consequent runoff. So, it is clear that neither the authors nor possibly their affiliated elite institutions are aware about the appropriate value of λ to be adopted for Indian watersheds. RS & GIS techniques show that land use/land cover for the year 2010 that is inbuilt in SCS-CN method enlarges the error. Further, the authors accept that the gridded precipitation data used in the present study possess limitations which they also acknowledge as exorbitant due to uncertainties in gridded data. Coupled with the error in soil classification across downstream of PRB, the inaccuracies already accumulated in the final output rises to unknown proportions. All these are then fed into HEC-HMS model and the output is validated vis-à-vis poor quality of discharge data.
The study by Sudheer et al., (2019) therefore reminds the statement “Garbage in, Garbage out” made by Darrel Huff17 in 1954. The inferences drawn from such model output are highly misleading and inconsequential from scientific point of view. Hence, attributing the floods of Kerala, to the extreme rainfall, and then exonerating the role of dams based on this distorted study of Sudheer et al., (2019) is inconclusive. But what is alarming is the new trend of distorting science by authors from elite institutions in India that seemingly appear to defend the narrative of vested interests point of view of indicting nature through distortion of “science”. If such articles are accepted as truth, suppressing the reality, it can result in untold negative consequences for the future of India’s flood management. This cannot be allowed.
J Harsha (Director, Central Water Commission, Government of India, Chennai, India, Email: infoharsha@yahoo.com; Mobile: +91 9902018682)
[Views expressed in this article are personal.]
References:
- Sudheer, K.P., Murty Bhallamudi, S., Narasimhan, B., Thomas, J., M. Bindhu, V., Vema, V., & Kurian, C., Role of dams on the floods of August 2018 in Periyar River Basin, Kerala. Current Science, 2019, 116(5), 780–794. Retrieved from https://www.currentscience.ac.in/cs/Volumes/116/05/0780.pdf
- Soil Conservation Service (SCS). National Engineering Handbook, Section 4, Hydrology, (NEH-4). U.S. Department of Agriculture, Washington D. C. 1972.
- Mishra, S. K., & Singh, V., Soil conservation service curve number (SCS-CN) methodology(Vol. 42). Springer Science & Business Media. 2013.
- Faizalhakim, A.S., Nurhidayu, S and Norizah, K., SCS-Curve Number in Tropics: Is it reliable. Pertanika Journal of Scholarly Research Reviews. University Putra Malaysia Press. 2016, 2(1).
- Eli, R.N and Lamont, S.J. Curve Numbers and Urban Runoff Modeling – Application Limitations. Conference Paper. 2010.
- Howard, A.D., Drainage analysis in geologic interpretation: a summation. American Association of Petroleum Geologists Bulletin, 1961, 51, 2246-2259.
- Schumm, S.A., Dumont, J.F. and Holbrook, J.M., Active Tectonics and Alluvial Rivers. Cambridge University Press, UK. 2000.
- Zhang, L., & Guilbert, E., A Study of Variables Characterizing Drainage Patterns in River Networks. ISPRS – International Archives of the Photogrammetry, Remote Sensing and Spatial Information Sciences, 2012, XXXIX-B2(September), 29–34. https://doi.org/10.5194/isprsarchives-xxxix-b2-29-2012
- Schumm, S.A., Evolution of Drainage Systems & Slopes in Badlands at Perth Anboy, New Jersey. Bulletin of the Geological Society of America, 1956, 67.
- Strahler, A.N., Quantitative Geomorphology of Drainage Basin and Channel Network. Handbook of Applied Hydrology. 1964.
- Abrahams, A. D., and J. J. Flint., Geologic controls on the topological properties of some trellis channel networks. Geol. Soc. Am. Bull. 1983, 94, 80– 91.
- Ichoku, C., and J. Chorowicz., A numerical approach to the analysis and classification of channel network patterns. Water Resour. Res, 1994, 30, 161–174.
- Winterkorn, H.F and Chandrasekharan E. C., Laterite soils and Stabilization. High. Res. Board Bull, 1951, 44, 10-29.
- Harsha. J., Aging large dams and future water crisis. Economic and Political Weekly, 2019. 54 (26-27), 37-42.
- Thakkar. H., Role of dams in Kerala’s flood disaster. Economic and Political Weekly, 2018. 53 (38).
- Mejía, A. I., & Niemann, J. D., Identification and characterization of dendritic, parallel, pinnate, rectangular, and trellis networks based on deviations from planform self-similarity. Journal of Geophysical Research: Earth Surface, 2008, 113(2), 1–21. https://doi.org/10.1029/2007JF000781
- Huff, D. (1954). How to life with statistics?. (Illust. I.Geis). W.W.Norton & Company. USA. New York.
———————————————————————————————————————

Thank you J Harsha for your bold and scientifically sound stance.
I would like to ask K P Sudheeran and party just one question :
” Do rains flood a place BEFORE they pour down on ? ”
When they claim “dams had little role in the floods in comparison to the natural reasons ” I think they mean rains. Even the Counter affidavits by the state departments to the many PILs made much about the Record rain on 15th Aug 2018 and blamed that rain for the flood.
But the flood was in place by 10th Aug 2018. Even the CM was lamenting about it on 10th Aug 2018 calling it an ” unprecedented flood havoc” and mentions ” 27 open dams” .
( http://arsenalkerala.com/2018/08/arsenal-kerala-aims-to-raise-funds-towards-flood-relief/)
The Home Minister from Delhi visits on 12th Aug and declare 100 cr as relief .
And yet 110,000 people were in flood camps by 14th Aug as per CMs tweets.
Clearly there was a flood well before 15th Aug when that record rain hit Kerala.
So what then caused the flood? Where did all the water come from?
Because as per the MET, there were only ‘Moderate showers’ from end July to 14th Aug 2018. But we have a ‘ unprecedented flood ‘ in Kerala !
Maybe, just maybe , those ” 27 open dams” the CM was lamenting about was the cause of the flood? How much technological study do we need to verify that?
Joseph NR / Kochi
BE. Civil, M. Design, IIT Mumbai
LikeLike
Dear Joseph,
Absolutely spot on. This is exactly we at SANDRP wrote that the dams were already full and creating disaster even before the worst round of rains started.
Thanks so much for your apt and sharp observations.
Warmly,
Himanshu Thakkar
LikeLike
This is indeed fascinating piece, and very hard hitting. Raises several questions (1) Doesn’t Current Science have a peer review process and if so how come that process did not catch these errors in Sudheer et al(2) Terrible that this rejoinder was not carried by Current Science and even reasons for rejection were not given (3) I am quite – pleasantly- surprised that a serving CWC officer can make a statement like “new trend of distorting science by authors from elite institutions in India that seemingly appear to defend the narrative of vested interests point”. I think it will be very useful if you share this with Shri Sudheer and co and ask them to reply (giving Shri Harsha a chance of rejoinder).
LikeLike
Thanks a lot, Shripad. Very useful and pointed comments. I have indeed written to Shri Sudheer et al and they have agreed to send response. 🙂
Himanshu Thakkar
LikeLike
Good to see someone from CWC countering the arguments trying to justify dams operation during the Kerala floods. However, since this is a highly technical analysis, I am not competent to comment on the arguments. Hence I am sharing a few comments from a layman’s perspective.
1. I thank Sri J. Harsha for coming up with this analysis. Fully agree that distortion of facts, irrespective of whether it was intentional or not, will only deny or delay the implementation of necessary reforms in flood management.
2. I thought the note could have been a little more articulate with less reference to the name of lead author of the paper he is criticising.
3. Since the title of the article is “Role of dams in Kerala floods – distortion of facts”, a brief description of how the dams operations too could have contributed to the intensity of floods would have made this more complete.
4. A brief description of the floods at Periyar basin at the introductory part along with peak discharges from various projects in the basin would have been welcome.
I am convinced that the flaws in reservoir operations has significantly compounded the floods at Periyar basin (and at some other places too). A couple of facts remain undisputed. 1) Most of the dams were full or nearly full before the high rainfall event and consequently no or negligible flood cushion was available for flood moderation. 2) Idukki and Idamalayar reservoirs had combined peak flood discharge of 2900 cumecs. (don’t have the figures for PH discharge from Idamlayar at that time).
Volume of discharge from Kallarkutty reservoir of Neriyamangalam HEP is not known (The KSEBL narrative as well as the CWC report on Kerala floods conveniently chose not to mention releases from Kallarkutty, which receives water from three upstream projects, the Pallivasal, Shengulam and Panniyar HEPs). Given the fact that the intra-day peak discharge from Kallarkutty on the 9th of August 2018 was likely to be in the range of 1000 cumecs, the discharge during the floods could not have been lesser. However, since Kallarkutty is only a balancing reservoir and the three reservoirs in the upstream of Kallarkutty don’t have very large storage capacity, they could not have contributed significantly to flood moderation. Hence I am taking that out from the present discussion. If and when we discuss integrated river basin level reservoir management strategy, these too will have their roles.
The CWC report says the three day inflow into Idukki on 15th, 16th and 17th of August 2018 was 435 MCM. At Idukki, the flood discharge was 345 MCM and 30 MCM was utilised at the powerhouse and that water goes to the adjacent basin. This reservoir has a gross storage capacity of 1980 MCM and live storage capacity of 1460 MCM. If Idukki had 25% (of live storage capacity) flood cushion, it could have absorbed 365 MCM and the three day flood discharge would have been a meager 40 MCM. At Idamalayar, 25 percent flood cushion would have provided a space of 255 MCM against three day flood release of 199 MCM. Obviously, no release would have been needed from these reservoirs during the peak flood time on the 16th of August.
It is learned that the peak discharge at Bhoothathankettu barrage was 7700 cumecs and that at the Neeleswaram gauging station was about 9000 cumecs. A reduction of 2900 cumecs from this would have significantly reduced the flood intensity in the river basin and saved tens of thousands of people from flooding and huge material losses. It will be in the best interest of the state to acknowledge the flaws in reservoir management during the Kerala floods of August 2018 and rectify the mistakes/ drawbacks at the earlier. Having said this, one need to acknowledge that the reservoir management has improved after this experience and rule curves have been prepared for a few large reservoirs. However, smaller reservoirs too need to have rule curves and their role in delaying inevitable floods by atleast a few hours, providing vital time for prior evacuation of people. More importantly, the authorities are still reluctant to have river basin approach in reservoir management, for reasons best known to them only. Also, they have not prepared integrated reservoir management plans at multi-dam basins.
Ravi.S.P
LikeLike
Many thanks, Ravi,
You are absolutely spot on about role of dams. We at SANDRP had raised exactly this kind of issues and shown that if the dams had operated as required, than the quantum of disaster would have been much much lower, as you can see from our blog and also EPW article that Harsha refers to.
Many thanks for posting these detailed comments here, this will enrich the discussions.
Himanshu Thakkar
LikeLike
Thanks for sharing this insightful information
LikeLike