
Like previous years, 2023 too has not seen any significant governmental decisions addressing the two key problems of ongoing contamination and depletion of groundwater resources across the country. On the contrary, the new reports and studies published during the year indicate some areas reaching depletion tipping points, land subsidence and climate change impacts compounding the situation.
This first part of yearend overview through top ten developments highlights the status of existing and emerging problems related to groundwater in India. The second and third parts will focus on government and judicial actions related to the subject during 2023.
1. Study Global gaps in the protection of nature reserves An international research team with the participation of Prof. Andreas Hartmann from TU Dresden has investigated the significance of groundwater catchment areas for the protection of biodiversity and the preservation of ecosystem services.
Now published in Nature Sustainability, the study shows that protection of groundwater catchment areas of nature reserves is often inadequate and human activities in neighbouring areas can have a devastating impact on the ecosystems. The researchers mapped the groundwater catchment areas worldwide and found that 85% of protected areas with groundwater-dependent ecosystems are not adequately protected. As a result, part of the catchment area is located outside the protected area. Half of all protected areas have a groundwater catchment area whose spatial extent is 50% or more outside the protected area boundaries. https://phys.org/news/2023-04-groundwater-biodiversity-reveals-global-gaps.html (13 April 2023)
2. EPW Groundwater irrigation & agricultural output nexus in Indian Districts: Author(s): A Narasyanamoorthy, K.S. Sujitha and G. Karthiga Devi. Not many studies are available highlighting Groundwater role in the value of agricultural output (VAO) using district-level data. This paper attempts to find out the impact of groundwater irrigation on VAO using cross-sectional data for 189 Indian districts covering three time points: 1990–93, 2003–06, and 2017–20. Both descriptive and regression analyses have been used. The descriptive analysis shows that VAO per hectare is significantly higher for those districts having a high level of groundwater coverage (>50%) than the districts having less (<30%) groundwater irrigation. The multivariate regression analysis carried out by using yield augmenting and infrastructure variables shows that the role of groundwater irrigation in impacting VAO has significantly and consistently increased over time.
The areas irrigated by surface sources like canal and small waterbodies (tanks, ponds, etc) have stagnated or decreased or increased at a relatively lesser pace, whereas the groundwater area has increased significantly over time. For instance, while the net canal irrigated area has increased from 12.84 million hectares (mha) in 1970–71 to 16.43 mha in 2018–19, the net groundwater irrigated area has increased massively from 11.89 mha to 45.75 mha. This is an increase of 285%. The share of groundwater irrigated area to the total net irrigated area has also increased significantly from 38% to 64% during this period.
The groundwater gives better-quality irrigation in terms of certainty, controllability and availability. Over time, farmers have hugely invested in groundwater irrigation structures with the support of subsidised institutional credit facilities. Some estimates indicate that Indian farmers have invested to the tune of $12 billion in groundwater structures. With the expansion of groundwater irrigation, the intensification of agriculture has also increased, especially in terms of multiple cropping around the year. Consequently, the gross contribution of groundwater to agriculture has substantially increased. Shah et al (2003) estimate that the ultimate contribution of groundwater to the Asian agricultural economy is about $25–$30 billion per year and the imputed value of groundwater used in India will be over $8.6 billion per year for the average period between 1987 and 1993. https://www.epw.in/journal/2023/13/special-articles/groundwater-irrigation-and-agricultural-output.html (01 April 2023)
3 UN India heading towards GW depletion tipping point According to a new UN-University Institute for Env and Human Security report “Interconnected Disaster Risk report 2023”, NW India is going to face groundwater scarcity in 2025 and parts of Gangetic plains have already gone past the groundwater depletion tipping point. https://www.deccanherald.com/india/un-report-warns-india-heading-towards-groundwater-depletion-tipping-point-2741859 (26 Oct. 2023) Environmental tipping points are critical thresholds in the Earth’s systems, beyond which abrupt and often irreversible changes occur, leading to profound and sometimes catastrophic shifts in ecosystems, climate patterns and the overall environment. https://www.hindustantimes.com/india-news/un-predicts-groundwater-in-india-will-reduce-to-low-by-2025-101698290828085.html (26 Oct. 2023) According to the report, 78% of wells in Punjab are considered overexploited, and the north-western region as a whole is predicted to experience critically low groundwater availability by 2025. https://indianexpress.com/article/india/india-heading-towards-groundwater-depletion-tipping-point-warns-un-report-9001338/ (27 Oct. 2023)
Multiple red flags over groundwater exploitation hotspots A new study by a team of South Korea-based geographers that revealed drift in the earth’s rotational axis due to excessive pumping of groundwater, has turned the spotlight on fast depleting water table in India. The study published in the journal Geophysical Research Letters indicated north-western India as one of the regions where humans have pumped large volumes of groundwater.
In one of the latest studies, researchers at the Indian Institute of Technology (IIT), Gandhinagar also found North India to be a global groundwater depletion hotspot that has accounted for nearly 95% of the country’s groundwater loss. The study, which appeared in One Earth journal, claimed North India region lost around 472 km3 of groundwater out of a total loss of 498 km3 during the two-decade period of 2002-2022. https://www.newindianexpress.com/specials/2023/jul/01/multiple-red-flags-over-groundwater-exploitation-hotspots-in-indias-north-2590333.html (01 July 2023)
4. Climate ChangeWarming temperatures exacerbate groundwater depletion Abstract: Climate change will likely increase crop water demand, and farmers may adapt by applying more irrigation. Understanding the extent to which this is occurring is of particular importance in India, a global groundwater depletion hotspot, where increased withdrawals may further jeopardize groundwater resources. Using historical data on groundwater levels, climate, and crop water stress, the study finds that farmers have adapted to warming temperatures by intensifying groundwater withdrawals, substantially accelerating groundwater depletion rates.

The figure compares the (A) 2004–2013 mean or current net GWL change (cm year−1) with those predicted for (B) 2050 (i.e., 2041–2060 average climate) and (C) 2070 (i.e., 2061–2080 average climate) using regression results, and projected climate under the RCP2.6 scenario, and potential reductions in irrigation use that may occur as groundwater tables fall. The current GWL change map (A) shows an inverse distance weighted interpolated map of mean GWL loss for the 2004–2013 period across 1604 groundwater measurement locations. Science.org
When considering increased withdrawals due to warming, it projects that the rates of net groundwater loss for 2041–2080 could be three times current depletion rates, even after considering projected increases in precipitation (∼4%–6%) and possible decreases in irrigation use as groundwater tables fall. These results reveal a previously unquantified cost of adapting to warming temperatures that will likely further threaten India’s food and water security. https://www.science.org/doi/10.1126/sciadv.adi1401 This is critical, given that more than 60 per cent of the nation’s irrigated agriculture depends on groundwater and portions of India are already facing severe groundwater depletion. To date, no study accounted for the potential increase in depletion caused by warming-induced increases in irrigation in India, the authors claim. https://www.downtoearth.org.in/news/water/india-will-be-losing-groundwater-three-times-faster-in-2041-2080-finds-study-91503 (1 Sept. 2023) https://www.thehindu.com/news/national/by-2080-india-could-lose-groundwater-by-3-times-the-current-rate-study/article67263183.ece (2 Sept. 2023)
Groundwater depletion rates could triple in coming decades A new University of Michigan-led study finds that farmers in India have adapted to warming temperatures by intensifying the withdrawal of groundwater used for irrigation. If the trend continues, the rate of groundwater loss could triple by 2080, said study senior author Meha Jain, assistant professor at U-M’s School for Environment and Sustainability. “This is of concern, given that India is the world’s largest consumer of groundwater and is a critical resource for the regional and global food supply.” The lead author of the study, published in the journal “Science Advances”, is Nishan Bhattarai of the Department of Geography and Environmental Sustainability at the University of Oklahoma. https://phys.org/news/2023-09-groundwater-depletion-india-triple-decades.html (1 Sept. 2023)
Excessive pumping limits the benefits of monsoon Swarup Dangar; Vimal Mishra The highest projected groundwater recovery (258.9 ± 171.6 km3) in the near period (2021–2040) is only about half of the total groundwater loss. Therefore, increased rainfall may not help recover the lost groundwater. https://www.cell.com/one-earth/pdf/S2590-3322(23)00102-1.pdf (30 March 2023)
Increased rainfall alone will not help groundwater recovery “There is a compulsion to make irrigation more efficient and shift crop growing and procuring areas,” he says. “The focus should thus be to promote groundwater conservation to ensure long-term sustainability.” https://www.thehindu.com/sci-tech/increased-rainfall-alone-will-not-help-groundwater-recovery/article66925433.ece (3 June 2023); https://eos.org/articles/rates-of-groundwater-depletion-in-india-could-triple-by-midcentury (24 Oct. 2023)
5. Report Groundwater exploitation is silently sinking the ground This explains how over extraction of groundwater has been causing land subsidence in various parts of country and resulting in damages to structures at some places while raising safety concerns for structures at other places as well.
Subduction in parts of Haryana, Punjab and Delhi is as high as 7-12 cm a year. “Over time, when the underlying aquifers (deep water channels that are stores of percolated water) aren’t recharged, they run dry and the layers of soil and rock above them start to sink,” Prof. Dheeraj Kumar Jain of the Indian Institute of Technology (Indian School of Mines), Dhanbad, said.
“The link between excessive groundwater extraction and land subsidence only started to become clear thanks to data from the GRACE (Gravity Recovery and Climate Experiment) satellites that could measure minute changes in gravity on different parts of the earth’s surface,” V.K. Gahlaut, scientist, National Geophysical Research Institute, Hyderabad, said.
“Unlike land movement from landslips or earthquakes, subsidence from groundwater extraction was gradual and barely visible annually. So, it is harder to correlate with structural damage,” he added. However, a wealth of studies in recent years, all of them obtained from satellite-based analysis of ground movement, from institutions and researchers that specialise in satellite-data analysis have correlated building deformities with groundwater withdrawals. https://www.thehindu.com/sci-tech/energy-and-environment/groundwater-exploitation-is-silently-sinking-the-ground-beneath-indias-feet/article66847379.ece (14 May 2023)
Subsidence in Indo-Gangetic plain Besides Delhi, researchers have recorded land subsidence in several other cities including Chandigarh, Ambala, Gandhinagar & Kolkata. The only study on the impact of groundwater extraction in rural areas has been in Punjab-Haryana. The study out by a team of five Indian researchers, was published in Springer in Oct 2020.
Land subsidence cannot be reversed by groundwater recharge, according to experts. So, the only solution is to arrest the overextraction of groundwater. This can be achieved through a series of interventions, starting with water budgeting for high-risk regions. In India, several villages have already adopted water budgets, where people compute the amount of water available and used. Cities should also implement similar budgets. Another step, suggests Pranjal, is reviving waterbodies that can aid groundwater recharge. https://www.downtoearth.org.in/news/urbanisation/writing-on-the-wall-groundwater-exploitation-is-triggering-subsidence-in-indo-gangetic-plain-90523 (19 July 2023)
Unravelling causes of land subsidence This paper identified severe groundwater depletion & land subsidence in parts of Delhi by long-term groundwater data analysis & spaceborne geodetic observations. https://link.springer.com/article/10.1007/s10064-023-03399-7 (13 Oct 2023)
6. Study Groundwater pumping changing Earth’s tilt By pumping out groundwater, humans have shifted such a large mass of water that the Earth tilted nearly 80 centimeters (31.5 inches) east in the last thirty years.
In a 2016 study, the authors argued that an anomalous eastward shift of the rotational poles over the past 115 yrs was caused by anthropogenic climate change. As the planet warms in response of increasing atmospheric levels of greenhouse gases, melting ice sheets & glaciers caused sea-levels to raise, redistributing large volumes of water & forcing Earth’s center of rotation to shift. But melting ice & snow alone couldn’t explain the observed polar shift.
In a new study, researchers modelled the drift of Earth’s axis and the movement of water – first, with only ice sheets and glaciers considered, and then adding in different scenarios of groundwater redistribution. “Our study shows that among climate-related causes, the redistribution of groundwater actually has the largest impact on the drift of the rotational pole,” said lead author Ki-Weon Seo.
Scientists previously estimated humans pumped 2,150 gigatons of groundwater, equivalent to more than 6 millimeters (0.24 inches) of sea level rise, from 1993 to 2010. The study “Drift of Earth’s Pole Confirms Groundwater Depletion as a Significant Contributor to Global Sea Level Rise 1993–2010” was published in the journal Geophysical Research Letters (2023). https://www.forbes.com/sites/davidbressan/2023/06/16/humans-are-pumping-so-much-water-out-of-the-ground-that-earths-tilt-is-changing/ (16 June 2023)

The location of the groundwater matters for how much it could change polar drift; redistributing water from the midlatitudes has a larger impact on the rotational pole. During the study period, the most water was redistributed in western North America and northwestern India, both at midlatitudes. Countries’ attempts to slow groundwater depletion rates, especially in those sensitive regions, could theoretically alter the change in drift, but only if such conservation approaches are sustained for decades. https://news.agu.org/press-release/weve-pumped-so-much-groundwater-that-weve-nudged-the-earths-spin/ (15 June 2023) While the slight drifting of the pole will not have an impact on the seasons, researchers cautioned that over a longer geologic time period, it could have an impact on the climate. https://www.indiatoday.in/science/story/earth-pole-moved-spin-nudged-groundwater-pumping-india-2394793-2023-06-19 (19 June 2023)
7. Groundwater extraction worst in Punjab, Rajasthan, Haryana Groundwater depletion continues to be a cause for concern in Punjab, Haryana and Rajasthan, as the three states are the only ones in India where groundwater extraction is more 100%. The nation average is 60%.The recently released Ground Water Resources Assessment for 2022 points the situation in Punjab being the most critical, with the agrarian state being the worst off in extracting underground water at 166% of its extractable groundwater resources.
In India, extractable resources, as per 2022 report, have been assessed at 398.08 BCM and the extraction has been recorded at 239.16 BCM, while the recharge is 437.60 BCM. The extraction rate is 60.08%.
Despite the underground water turning scarcer, there is no perceptible change in paddy growing in these three states. Haryana and Rajasthan witnessed an increase in area under paddy in 2022 as compared to previous year. In Punjab, area under paddy was recorded at 31.33 lakh hectares (31.45 LH in 2021). In Haryana, it was 14.58 LH (13.64 LH). In Rajasthan, it was 2.28 LH (1.94 LH). https://timesofindia.indiatimes.com/city/chandigarh/groundwater-extraction-worst-in-pb-hry-close-3rd/articleshow/97834063.cms (12 Feb. 2023)
8. Pune Buildings block aquifers, city loses 3 billion litre of groundwater Himanshu Kulkarni, former executive director and currently scientist (Emeritus) at ACWADAM, said that the report released this year was based on data collected during four years till 2022. He said, “This loss is based on conservative estimates of buildings in the city and their foundations. The report selected five major aquifers for the city to illustrate the variety of land-cover and land-use elements on their respective recharge areas. The findings revealed that nearly half of the recharge area (46%) is covered by housing societies, like apartment blocks that are typically multi-storied and often with more than one building.”
Kulkarni said, “The study revealed that 13% of the recharge areas is overlain by govt facilities, while 11% is covered by commercial establishments & institutions each. Private bungalows have come up over 6% of these areas. Besides, an additional volume of groundwater is pumped out into wastewater or stormwater drains from the basements of some constructions.”
High-water tables in different seasons or spring discharge imply discharge from aquifers into foundations and basement parking lots. The research team stressed the need to consider the prevention of cutting through productive aquifers during any infrastructure building activity and to take care for avoiding dewatering of such aquifers at the intersection with engineered structures. He said other factors, such as disturbing the areas near river channels, would affect the groundwater recharge and discharge interactions between the river and the aquifers. To manage Pune’s groundwater more efficiently, we need to understand this issue more closely.” https://timesofindia.indiatimes.com/city/pune/buildings-block-aquifers-pune-loses-3-billion-litre-of-groundwater-report/articleshow/99699896.cms (23 April 2023)
9. Tamil Nadu Groundwater is turning saline on ECR Touted to have the best-quality groundwater, the east coast of the city is facing salinity due to gradual seawater intrusion, according to a 2023 study titled ‘Investigating underground water salinity in the east coastline of Tamil Nadu, India and improving its quality through solar assisted desalination’ published in ‘Urban Climate’ journal, done by a group of researchers from various universities in the city.
This is because more built-up areas coming up and there is excessive borewell water usage, said V Kanchana, one of the authors of the study and chemistry professor at Sree Sastha Institute of Engineering and Technology. “Many water-intensive multi-storeyed buildings are coming up on ECR, reducing natural recharge and increasing indiscriminate pumping of groundwater,” she added. https://timesofindia.indiatimes.com/city/chennai/groundwater-is-turning-saline-on-ecr-study-researchers-design-solar-distillation-system/articleshow/105505308.cms (26 Nov. 2023)
10. Jharkhand Groundwater depletion The study report, titled Groundwater Depletion highlighted that groundwater depletion is leading to reduced water availability in regions that rely on underground reserves as their primary source of freshwater. It also stated that in the districts of Bokaro, Giridih, Godda, Gumla, Palamu and Ranchi, the fluoride concentration in groundwater was beyond permissible limit citing CGWB findings.
Jharkhand has several freshwater resources in the form of ponds and streams apart from having rivers such as Damodar, Mayurakshi, Barakar, Koyal, Sankh, Son, Auranga, More, Karo, Bansloi, South Koel, Kharkai, Swarna Rekha, Ganga, Gumani, and Batane. “Unfortunately, most of them have now fully or partially dried up,” the report stated. “Overall, the study emphasises the urgent need for better management and conservation of groundwater resources. https://www.telegraphindia.com/jharkhand/groundwater-depletion-worry-for-jharkhand/cid/1930156 (17 April 2023)
Reports On Groundwater Depletion from Various Parts of Country
Rajasthan 99% of irrigated land in Jaipur use groundwater The Central Groundwater Board Report 2022 (Nov) says that of the district’s 15 blocks, Govindgarh has the lion’s share with 40,000 ha irrigated using groundwater. Blocks like Jhotwara and Sanganer lead in using groundwater for industrial purposes. All the blocks of Jaipur have recorded over-exploitation of groundwater. In 2021, the district recorded a deficit of 918 million cubic metres of groundwater, mainly due to use for irrigation. The analysis of the decadal water level trend (2011-2020) indicates that the overall trend in the district is decline at an average rate of 0.50 metres per year. Calling the report alarming, R K Goyal, soil scientist and in charge of Central Arid Zone Research Institute, Ladakh, said that a two-way approach of water conservation and rainwater harvesting is required, at a war footing. https://timesofindia.indiatimes.com/city/jaipur/99-of-irrigated-land-in-jaipur-sucks-up-groundwater-report/articleshow/98892703.cms (22 March 2023)
Delhi Groundwater most ‘exploited’ at VIP enclaves The New Delhi revenue district, including parts of Chanakyapuri, Vasant Vihar and the Delhi Cantonment area, remains the most exploited in terms of groundwater extraction in the city, extracting far more than it recharges. Delhi, however, has recorded a fall in groundwater extraction in this assessment year compared to last year, according to the Dynamic Groundwater Resources of India 2023 report of the CGWB released on Dec 1 2023. The total groundwater extraction in the city has fallen from 0.36 bcm in 2022 to 0.34 bcm this year, with 9 out of 11 revenue districts recording a fall compared to 2022. Only North and Northeast Delhi saw an increase.
But the city’s annual groundwater recharge has also fallen — from 0.41 bcm last year to 0.38 bcm this year — which means the extractable groundwater resource that is a portion of this recharge, has also decreased. With groundwater recharge falling, the stage of extraction (a percentage of groundwater extracted against the recharge) was 99.13% in 2023, up from 98.16% in 2022. The New Delhi district has the highest (also in 2022) stage of extraction — 137.79% — it extracts 3,612.52 ha-m (down from 3713 ha-m in 2022), when the extractable groundwater from annual recharge is only 2,621.74 ha-m. https://indianexpress.com/article/cities/delhi/groundwater-most-exploited-at-delhis-vip-enclaves-shows-report-9050811/ (02 Dec. 2023)
Uttar Pradesh 9.9m max drop in Noida & 2.8m in Gr Noida in 6 yrs The city’s groundwater level dropped by 9.9m in the post-monsoon months and 8.5m in the pre-monsoon months between 2017 and 2023 due to limited rainfall and recharge. In the pre-monsoon months, the groundwater level plummeted to 22.5m in 2023 from 14m in 2017. In the post-monsoon months, the groundwater level dropped from 13.1m in 2017 to 23m in 2023. This is alarming said Ankita Ray, a hydrologist in the groundwater department.
Noida’s Aghapur in Sector 41 was the worst affected, with an average depletion rate of 17m, followed by Garhi Chaukhandi (11.5m) and Phase 3. In Greater Noida, the groundwater level in the pre-monsoon months fell by 2.8m in the corresponding period. “There is an urgent need to recharge the groundwater table, especially in the city. Steps must be taken to ensure that illegal groundwater extraction is checked,” added Ray. City-based environmentalist Vikrant Tongad blamed the rapid pace of urbanisation and concretisation. “Clearly, there is a big gap in the rate of extraction of groundwater and its recharge, and authorities need to heed the warning,” he said. https://timesofindia.indiatimes.com/city/noida/alarming-depletion-rate-of-groundwater-in-noida-and-greater-noida/articleshow/106621579.cms (08 Jan. 2024)
Chandigarh Groundwater level declines by 28% in a decade The city has witnessed a decline of 28% in groundwater levels over the past decade. The issue was brought up in the Rajya Sabha. The concerned authorities in Chandigarh said that the situation is expected to improve with the implementation of the 24X7 water project in the city, which is anticipated to be completed by Dec 2023. https://www.hindustantimes.com/cities/chandigarh-news/decline-in-chandigarh-s-groundwater-levels-alarming-28-drop-in-past-decade-solutions-in-progress-101692090828425.html (15 August 2023)
Haryana Groundwater level in Karnal dipped 11 feet in 10 years The district witnessed a fall of more than 11 feet (3.48 meter) in its water table over the last 10 years, according to the report of irrigation department’s groundwater cell. The dist’s water level was 16.98 m in June 2012 which dipped to 20.43m in 2022. Experts believe that water extraction is several times more than recharge. Besides, Illegal ground water extraction and little action is another big reason. The govt has spent crore to set up rain water harvesting systems. But due to poor upkeep, 70 % of water harvesting systems are choked with mud, grass and garbage. https://timesofindia.indiatimes.com/city/gurgaon/karnals-groundwater-level-dipped-11-feet-in-10-years/articleshow/100162086.cms (11 May 2023)
Maharashtra GW situation acute in 16 districts Latest Groundwater Survey and Development Agency (GSDA) data revealed that 2 blocks Shirur in Pune and Khandala in Satara were showing severe depletion in Oct 2023 in comparison to the last 10 years’ average, while moderate depletion is seen in 7 blocks. Pune district has maximum blocks (9) showing depletion as per GSDA data, followed by Jalna (7), Solapur (6) and Sangli (5). Officials said the sub-par monsoon in 2023 and intensified groundwater extraction was a factor. 54 talukas were showing groundwater depletion in October 2023 in comparison to the last 10 years’ average Oct level. As a result, the talukas were declared drought-affected under GSDA’s Groundwater Drought Index. https://timesofindia.indiatimes.com/city/pune/post-2023-monsoon-groundwater-crisis-deepens-in-maharashtra-situation-acute-in-16-districts/articleshow/106605338.cms (7 Jan 2024)
Gujarat Sinking Ahmedabad The Institute of Seismology Research’s scientist Rakesh Dumka’s study has concluded that Ahmedabad is sinking 12 to 25 millimetres annually because of the underground water being drawn. According to Dumka, the state and the Ahmedabad Municipal Corp should ensure a sufficient quantity of surface water and ban the drawing of groundwater, if it wants to stop the sinking. https://www.daijiworld.com/news/newsDisplay?newsID=1039644 (14 Jan. 2023)
Andhra Pradesh Groundwater level declines due to excessive use Compared to Jan 2022, the average groundwater level in the State has decreased by 0.47 metres below ground level (MBGL) in Jan 2023. The State recorded 6.85 MBGL in Jan 2023, compared to 6.39 MBGL in Jan 2022. The depletion was more pronounced in Coastal districts, while it was nearly the same as last year in Rayalaseema districts.
YV Malla Reddy, an expert working with the Rural Development Trust (RDT), said, “The extent of land under cultivation has increased, more so that of the land under borewells. Owing to increased evaporation of water due to rise in daytime temperatures, even before the onset of summer, the need for more water to irrigate the standing Rabi crop, might have caused the overuse of groundwater”. https://www.newindianexpress.com/states/andhra-pradesh/2023/feb/19/groundwater-level-in-andhra-pradeshdeclines-by-047-mbgl-due-to-excessive-use-2548809.html (19 Feb. 2023)
Reports on Groundwater Contamination & Pollution from across India
Karnataka Questions over KC Valley project Touted as a shining example of India’s ingenuity, KC Valley project transports Bengaluru’s secondary treated wastewater to rural neighbourhoods in Kolar district. Scientists and activists are apprehensive of the long-term effect of using treated wastewater, that may carry toxic heavy metals, to recharge groundwater.

While sewage treatment plant data assure all is well, experts say the hasty implementation of the project without necessary prior studies was a myopic move. https://india.mongabay.com/2023/08/should-rural-india-drink-urban-wastewater/ (28 Aug 2023)
Don’t use treated KC Valley water for irrigation: Minister Minor Irrigation Minister N S Boseraju has warned farmers not to use the treated sewage from KC Valley project directly for irrigation. The water should be used to fill up the lakes and recharged groundwater can be used for irrigation. https://www.deccanherald.com/india/karnataka/don-t-use-treated-kc-valley-water-for-irrigation-minister-2845489 (12 Jan. 2024)
Heavy metals have contaminated soil, groundwater of Bengaluru. At least six areas in Bengaluru – Goripalya, Peenya Industrial area, Lalbagh Lake, Hebbal Lake, Agara Lake, and Begur lake – have high concentrations of heavy metals – lead, copper, chromium, magnesium – a recent study report submitted by the Karnataka State Pollution Control Board to the Central Pollution Control Board said. https://bangaloremirror.indiatimes.com/bangalore/others/heavy-on-metal/articleshow/105271274.cms (17 Nov. 2023)
Groundwater conundrum Activists argue that Bengaluru had exploited groundwater to the highest level, and since it was now a red zone, no new permissions should be provided. “The Central Groundwater Authority has declared Bengaluru in the red zone. Ideally, we should not allow any new borewell,” Anirudhan argues.
– Key message from the article: There is complete confusion about groundwater regulation even in a relatively regulatable Urban city. KGWA says they have given the authority to BWSSB, BWSSB says it is not in their power. The Drilling companies are least bothered. The Police do not seem to do much even after complaints. https://www.deccanherald.com/india/karnataka/bengaluru/bengaluru-s-groundwater-conundrum-2847211 (13 Jan. 2024)
24 borewells in Mysuru found contaminated with Nitrates All these 24 borewells are closed by the Mysuru district administration. According to District Health Officer Dr K H Prasad, the presence of Nitrate indicates the presence of bacteria and contamination of water. Such contamination can cause gut infections including gastroenteritis & typhoid. https://www.deccanherald.com/state/mysuru/24-borewells-in-mysuru-district-found-contaminated-with-nitrates-closed-1233815.html (04 July 2023)
Tamil Nadu Hosur locals blame industries for polluting GW Residents of Ward 18 in the Hosur Municipal Corp alleged that the groundwater is polluted due to the release of untreated effluent by some industrial units in the area. Many people in the ward are suffering from skin allergies. https://www.newindianexpress.com/states/tamil-nadu/2023/apr/07/tamil-nadu-nethaji-nagar-locals-say-ground-water-polluted-blame-industrial-units-2563440.html (7 Apr 2023)
‘Hosur Groundwater not fit for use’ Groundwater in Nethaji Nagar in ward 18 of Hosur has chromium content and is unfit for any use, preliminary results of test conducted by Hosur Municipal Corp has revealed. Corp officials said water would be supplied to the locality through tankers as a temporary measure and a pipeline would be laid at the cost of `30 lakh to draw water from the Hogenakkal drinking water supply scheme. https://www.newindianexpress.com/states/tamil-nadu/2023/may/26/ground-water-in-hosur-ward-18-has-chromium-not-fit-for-use-2578669.html (26 May 2023)
Telangana Pink water from borewell alarms residents In a very shocking and unusual occurrence, a borewell in Mancherial District had pink-coloured water, raising questions about its safety for consumption and other uses. The suspicious colouration of water to a pink shade came to light when Katta Srinivasachari attempted to fill water from the borewell to take a shower at his home in Chennur Town, Telangana. https://www.siasat.com/watch-pink-water-from-borewell-in-telangana-town-alarms-residents-2933684/ (13 Dec. 2023)
Hyderabad groundwater contaminated A recent study ’Pharmaceuticals and Agro-Chemicals in Groundwater of Hyderabad’, has revealed alarming levels of organic micropollutants in the form of pharmaceutical & agrochemical compounds in the groundwater in Hyderabad. The scientists also found the presence of urinary metabolites in the groundwater, suggesting that domestic wastewater and sewage infiltration had contaminated the aquifers. https://www.deccanchronicle.com/nation/in-other-news/291023/hyderabads-ground-water-contaminated-with-pharmaceutical-and-agrochem.html (29 Oct. 2023)
Punjab Water in 29% wells has uranium concentration Punjab is the worst affected state in India where 29% of the wells have been observed to have uranium concentration more than the limit of 30 parts per billion, reveals the Groundwater yearbook 2021-22, released recently by the Central Groundwater Board. https://www.hindustantimes.com/cities/chandigarh-news/water-in-29-wells-in-punjab-has-uranium-concentration-101676181913587.html (12 Feb 2023)
78% GW unfit for consumption in Bathinda A recent study, titled “Assessment of fluoride exposure and associated health risks from different sources of drinking water to various age groups in Bathinda city”, has highlighted that 78.2 per cent of groundwater in the city is unfit for human consumption. The findings reveal potential health hazards, including risk of skeleton, and dental fluorosis. https://www.tribuneindia.com/news/punjab/78-groundwater-unfit-for-human-consumption-in-bathinda-study-555664 (23 Oct. 2023)
Groundwater turns black, stinky The residents of Mangat village of Ludhiana are being forced to drink black and stinking water that has been coming out of their tube wells and hand pumps which, they say, is due to the dumping of untreated industrial effluents by the dyeing unit in the village. The villagers also say that the drinking water via taps is also polluted. https://indianexpress.com/article/cities/chandigarh/groundwater-udhiana-villagers-die-cancer-9054795/ (5 Dec 2023)

Despite multiple complaints to the authorities, no action has been taken. Numerous residents are now facing health problems, including cancer, due to the chemical and coloured water waste seeping into the groundwater, contaminating the entire supply. https://www.hindustantimes.com/cities/chandigarh-news/residents-allege-water-pollution-by-dyeing-unit-in-mangat-village-101701453737742.html (02 Dec. 2023)
Iron & fluoride in groundwater high, but pesticides in limit: PPCBThe concentration of total dissolved solids (TDS), iron, fluoride and nitrate has been found in excess of permissible limits in groundwater by PPCB during 2019-2023 in Punjab, but 12 pesticides and some heavy metals have been found within limit. PPCB monitors 43 of 46 groundwater locations in the state. The quality of the state’s groundwater came to the fore in a status report submitted to NGT on Wednesday (Jan. 17), pertaining to groundwater quality in Punjab monitored by CPCB in association with PPCB under National Water Quality Monitoring Program (NWMP). As per this report, groundwater quality is not as alarming as was being anticipated in past reports. https://timesofindia.indiatimes.com/city/chandigarh/iron-fluoride-in-groundwater-high-but-pesticides-in-limit-report-to-ngt/articleshow/106973423.cms (19 Jan. 2024)
Uttar Pradesh Flouride in Agra groundwater Fatehpur Sikri and other neighbouring villages in Agra are facing a groundwater crisis as the water available to them is laced with fluoride. Residents of these villages have been facing this as there is either fluoride-laced water or no groundwater at all. Many have left the village as the only water they can drink is extremely saline. At present, efforts are being made to provide drinking water to these villages under the Nirmal Jal Dhara programme of the rural development department. https://www.indiatoday.in/cities/agra/story/flouride-in-groundwater-causes-water-crisis-in-3-agra-villages-2321388-2023-01-14 (14 Jan. 2023)
Impact of arsenic contaminated groundwater on human health. https://caravanmagazine.in/health/ballia-up-arsenic-water-crisis (01 June 2023)
Bihar Groundwater in 30,000 wards polluted: PHED A latest report of the Public Health and Engineering Department has found groundwater polluted in 30,207 village wards across the state. According to the report, there are 21,709 wards across the state where the iron content in groundwater is more than the permissible limits. Similarly, arsenic and fluoride contents in groundwater are more than the permissible limits in 4,709 and 3,789 wards, respectively. Health experts say the overload of iron, fluorosis and arsenic in water may cause severe health problems such as cancer, cirrhosis of liver, heart problems, weakening of bones, deformities, and skin lesions. https://timesofindia.indiatimes.com/city/patna/groundwater-in-30000-wards-polluted-in-bihar-phed-report/articleshow/98347509.cms (02 March 2023)
Study Unmasking fluoride A recent paper ‘Recent advancements in fluoride impact on human health: A critical review’ in the journal Environmental and Sustainability Indicators delves into the complex landscape of fluoride exposure, offering insights into its intricate effects on human health, groundwater composition, and innovative removal techniques. With a focus on global implications, the study covers diverse aspects, from geological factors influencing fluoride concentrations to the intricacies of skeletal fluorosis and the broader spectrum of health impacts. https://www.indiawaterportal.org/articles/unmasking-fluoride-global-examination-health-complexities-and-groundwater-dynamics (09 Dec. 2023)
Odisha 17 districts facing salinity in groundwater This outcome of a study conducted by Switch On Foundation, a not-for-profit organisation working on climate change and environment. The report, which will be submitted to the state government, recommended a series of policy initiatives for groundwater recharge and better water management. https://timesofindia.indiatimes.com/city/bhubaneswar/17-dists-facing-salinity-in-groundwater-says-report/articleshow/99004859.cms (26 March 2023)
Haryana 9% area affected by water-logging, soil salinity Of the total 1.1 crore acres of geographical area in Haryana, 9.8 lakh acres (8.89 %) is affected with the twin problem of waterlogging and salinity, according to the data provided by the Ground Water Cell. The data also revealed that of the total area, 1.7 lakh acres is under critical condition. The information was revealed in a response to the question by INLD MLA Abhay Chautala during the ongoing Budget session of Vidhan Sabha. https://indianexpress.com/article/cities/chandigarh/ground-water-cell-data-waterlogging-hayrana-rohtak-8511600/ (22 March 2023)
Delhi 20% tubewell water polluted According to the officials, after detecting that approximately 1,060 tubewells have water containing harmful pollutants, like nitrate, ammonia and fluorides, the board has started work on installing treatment units on all of them in the first phase. https://timesofindia.indiatimes.com/city/delhi/20-tubewell-water-polluted-djb-tries-to-rectify-system/articleshow/100834970.cms (08 June 2023)
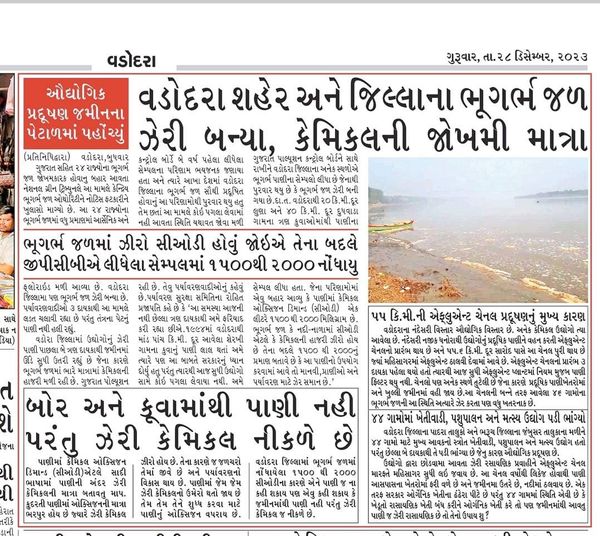
Gujarat Groundwater in large parts of Vadodara district has become poisonous with Chemical Oxygen Demand of 1500-2000.
Compiled by Bhim Singh Rawat (bhim.sandrp@gmail.com)
