
India’s most important season, the June-Sept South West Monsoon has just ended officially on Sept 30, 2017. India Meteorological Department (IMD) reported that India received 841.3 mm rainfall in these four months of monsoon 2017, compared to normal rainfall of 887.5 mm. So Monsoon 2017 rainfall was 5.2% below normal.
The standard dominating reporting of monsoon rainfall figures in India is either state wise or sub division wise[i]. Accordingly, IMD reported that 25 sub divisions reported normal rainfall, 5 sub divisions[ii] reported excess rainfall and six sub divisions[iii] reported deficit rainfall, as can be seen from accompanying IMD sub division wise map of 2017 monsoon rainfall figures.
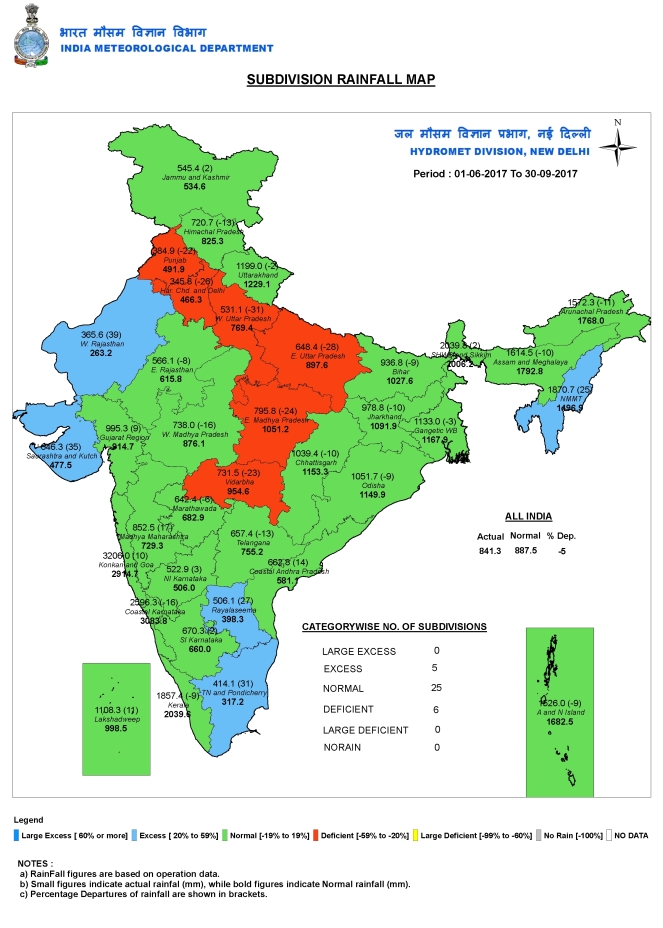
IMD also reports state wise figures of rainfall and as can be seen from accompanying map for state wise figures. Here one can see that six states are in Red Zone (deficit over 20%): Punjab (-22%), Haryana (-26), Delhi (-30), UP (-29), MP (-20), Nagaland (-25) and Manipur (-33). It is noteworthy here that Manipur & Nagaland, as per sub division wise figures, were in BLUE zone with 25% excess rainfall in the sub division. But the Manipur itself had hugely negative rainfall figure: Deficit of 33%. This shows how erroneous these macro rainfall figures can be. This happened because Mizoram (78%) and Tripura (27%) as part of NMMT sub division had hugely surplus rainfall. In fact, only three states were painted in blue colour in IMD state wise rainfall map, the remaining state was Tamil Nadu (31% surplus). This shows we actually need more local or dis-integrated figures of rainfall.

River Basin Wise Rainfall Figures In fact, IMD also reports river basin wise rainfall figures on its website on daily basis during monsoon. These figures, in fact are more useful in understanding the hydrological implications of rainfall. Unfortunately, the media does not report these figures at all. For anyone working on water issues, these are much more useful figures.
In Tables below we are reporting the sub basin wise rainfall figures for 2017 monsoon for each basin, along with normal rainfall and departure from normal. We are also highlighting some interesting aspects that are immediately discernible from these tables.
Ganga Basin IMD map divides Ganga basin into 15 sub basins and in table below we have given these figures, diving the Ganga Basin into three sections: Upper Ganga Valley, Yamuna and Lower Ganga Valley Sub Basins.
| BASIN | Sub Basin | 2017 Monsoon Rainfall, mm | Normal Rainfall, mm | % departure of actual rainfall |
| UPPER GANGA Valley SUB BASIN | Upper Ganga | 990.5 | 967.4 | 2 |
| Ramganga | 895 | 989.5 | -10 | |
| Ghaghra | 773.5 | 1087.2 | -29 | |
| Gomti | 615.2 | 883.2 | -30 | |
| Ganga | 565 | 759.9 | -26 | |
| YAMUNA SUB BASIN | Upper Yamuna | 516.8 | 742.8 | -30 |
| Middle Yamuna | 333.2 | 573.9 | -42 | |
| Lower Yamuna | 562.6 | 863 | -35 | |
| Chambal | 610.8 | 685.4 | -11 | |
| LOWER GANGA SUB BASIN | Sone | 873 | 1048.5 | -17 |
| Tons | 706.2 | 960.1 | -26 | |
| Gandak | 839.7 | 942.8 | -11 | |
| Kosi | 1026.4 | 1087.8 | -6 | |
| Damodar | 1109.7 | 1072 | 4 | |
| Bhagirathi | 1321.2 | 1212.5 | 9 |
The first thing that strikes one is that in 12 of the 15 sub basins, the rainfall was below normal. The Highest deficit of 42% was observed in Middle Yamuna basin that received just 333.2 mm rainfall, by far the lowest rainfall among all the sub basins of Ganga basin in monsoon 2017, and one of the lowest in all the sub basins of India. Among the three sub basins that received surplus rainfall, Bhagirathi received the highest surplus of 9% and rainfall of 1321.2 mm, which too was the highest among all the sub basins of Ganga Basin.
Indus Basin IMD divides this basin into seven sub basins, but strangely for two of the sub basins, namely Jhelum and Upper Indus, it reports no rainfall figures ever! This is very strange and IMD need to answer as to why it does not report rainfall in these two sub basins.
| BASIN | Sub Basin | 2017 Monsoon Rainfall, mm | Normal Monsoon Rainfall, mm | % departure of actual rainfall |
| INDUS | Upper Sutlej | 658.6 | 576 | 14 |
| Lower Sutlej | 386.6 | 477.3 | -19 | |
| Ravi | 538.4 | 719.8 | -25 | |
| Ghaghar, Chautang, Churu, Barmer | 377.4 | 428.5 | -12 | |
| Chenab | 661.1 | 705.4 | -6 | |
| Jhelum | NO INFORMATION | |||
| Upper Indus | NO INFORMATION | |||
It is clear from the table above that among the five sub basins for which IMD has reported rainfall figure, four have deficit rainfall in 2017 monsoon. The highest deficit of 25% was observed in Ravi basin. Lowest rainfall in absolute terms, at 377.4 mm was reported in Ghaghar basin. Chenab basin had the highest rainfall, 661.1 mm, though it was 6% below normal this year. Upper Sutlej sub basin was the only one to report surplus (14%) rainfall.
North East India IMD divides this basin into six sub basins, and all the sub basins here experienced surplus rainfall, except “Impahl and others” sub basin, where the deficit was massive, 56%, THE HIGHEST DEFICIT among all the sub basins of India in 2017 monsoon. It received the lowest rainfall (515 mm) in 2017 monsoon among all the sub basins of North East India.
| BASIN | Sub Basin | 2017 Monsoon Rainfall, mm | Normal Monsoon Rainfall, mm | % departure of actual rainfall |
| Brahmaputra, Barak and rest of NE India | Upper Brahmaputra | 1637.6 | 1600.9 | 2 |
| Lower Brahmaputra | 2071.3 | 1832.9 | 13 | |
| Kynichiang | 7255.4 | 6473.4 | 12 | |
| Barak | 2048.3 | 1851.0 | 11 | |
| Imphal, others | 515 | 1165.4 | -56 | |
| Naoch, Manpui Lui, Muhuli, Karnaphuli | 1953.9 | 1566.9 | 25 |
Kinchiang sub basin, mostly in Meghalaya, at 7255.4 mm received the HIGHEST RAINFALL among all the sub basin of entire India in 2017 monsoon, this figure was 12% above rainfall.
Godavari Basin IMD map divides this basin into eight sub basins with normal rainfall varying from the lowest of 609.9 mm in Upper Godwavari basin (Rain shadow area) to over double that amount in Indravati sub basin, east facing Eastern Ghats area.
| BASIN | Sub Basin | 2017 Monsoon Rainfall, mm | Normal Monsoon Rainfall, mm | % departure of actual rainfall |
| GODAVARI | Upper Godavari | 846 | 609.9 | 39 |
| Middle Godavari | 731..2 | 728.5 | -10 | |
| Wardha | 654.1 | 858.2 | -24 | |
| Manjira | 707.3 | 742.5 | -5 | |
| Pranhita | 696.2 | 915.1 | -24 | |
| Wainganga | 859.7 | 1126.9 | -24 | |
| Indravati | 1206.2 | 1267.2 | -5 | |
| Lower Godavari | 1061.6 | 942.3 | 13 |
As an be seen above, in six of the sub basins, there was deficit rainfall this year, highest deficit of 24% in three sub basins (Wardha, Pranhita and Wainganga). The lowest normal rainfall area of Upper Godavari basin had the highest surplus figure of 39% among six sub basins of the Godavari Basin this year.
Krishna Basin IMD divides the basin into five sub basins, though it should be seven, the Midle Krishna and Upper Tungabhadra figures are missing in the IMD map. Lower Tungabhadra sub basin, at 342 mm, has the lowest normal rainfall not only of the Krishna basin, but also one of the lowest among all the sub basins of entire India.
| BASIN | Sub Basin | 2017 Monsoon Rainfall, mm | Normal Monsoon Rainfall, mm | % departure of actual rainfall |
| KRISHNA | Upper Bhima | 788.5 | 689.8 | 14 |
| Upper Krishna | 760.2 | 800.8 | -5 | |
| Lower Bhima | 520.1 | 604.8 | -14 | |
| Lower Tungabhadra | 424 | 342 | 24 | |
| Lower Krishna | 599.2 | 644.6 | -7 |
In 2017 monsoon, three of the sub basins had deficit rainfall, but the Lower Tungabhadra basin with lowest normal rainfall had the highest surplus rainfall this year of 24% in this basin. Upper Bhima basin had the highest rainfall in absolute terms in this basin, at 788.5 mm.
West Flowing Rivers There are six rivers here, as given below, four of them are individual rivers (Sabarmati, Mahi, Narmada and Tapi) and two are composite basins (Luni-Saraswati-Bhadar and west flowing rivers south of Tapi). The two composite basins have the lowest (517.3 mm for Luni-Saraswati Bhadar composite basin) and highest (2358.1 mm for West flowing rivers south of Tapi) normal rainfall among all the sub basins here.
| BASIN | Sub Basin | 2017 Monsoon Rainfall, mm | Normal Monsoon Rainfall, mm | % departure of actual rainfall |
| WEST FLOWING RIVERS | Luni, Saraswati, Bhadar | 781.3 | 517.3 | 51 |
| Sabarmati | 891.5 | 714 | 25 | |
| Mahi | 805.2 | 788.2 | 2 | |
| Narmada | 804.9 | 1017.5 | -21 | |
| Tapi | 654.9 | 731.2 | -10 | |
| W Flowing South of Tapi | 2255.7 | 2358.1 | -4 |
Tapi Basin received the lowest (654.9 mm) rainfall in this Basin this year, with deficit of 10% and Narmada basin had the highest deficit of 21%. Both these are supposedly surplus basin, but the dams in both basins had one of the lowest storage at the end of monsoon this year. West flowing composite basin south of Tapi had the highest rainfall of 2255.7 mm this year among all the sub basins here, and also among all the sub basins outside North East India. The highest surplus of 51% was seen in Luni-Saraswati-Bhadar sub basin, where there was also some unprecedented floods, in which the dams and canals played major role.
Here one would like to suggest to IMD that the composite basin “West flowing rivers south of Tapi” can easily broken into four parts: 1. West flowing rivers South of Tapi in Gujarat, 2. Konkan and Goa, 3. Coastal Karnaaka rivers 4. Kerala west flowing rivers. This is because the last three sections are already reported by IMD in Sub division rainfall figures, and only slight changes will be required to use those figures for the river basin rainfall map.
East Flowing Rivers IMD map shows eleven sub basins under this composite basin, as can be seen below. Except three northern most sub basins (Subarnarrekha, Brahmani-Baitarni & Mahanadi), all the other eight sub basins had surplus rainfall.
| BASIN | Sub Basin | 2017 Monsoon Rainfall, mm | Normal Monsoon Rainfall, mm | % departure of actual rainfall |
| EAST FLOWING RIVERS | Subarnarekha | 1046.6 | 1128.8 | -7 |
| Brahmani & Baitarni | 966.1 | 1143.4 | -16 | |
| Mahanadi | 986.5 | 1104.1 | -11 | |
| Vamsadhara | 990 | 829.7 | 19 | |
| Nagvali | 818.9 | 703.4 | 16 | |
| E flowing between Krishna Godavari | 762.2 | 718.3 | 6 | |
| E flowing Between Krishna Pennar | 543.7 | 414.3 | 31 | |
| Pennar | 479.2 | 391.3 | 22 | |
| Ponnaiyar Palar | 532.5 | 431.2 | 23 | |
| Cauvery | 537.3 | 495.7 | 8 | |
| Vaippar Pamba | 331.8 | 218.9 | 52 |
The southern most sub basin, namely Vaippar-Pamba, has the lowest normal rainfall of 218.9 mm, but had the highest surplus (52%) rainfall this year among all the sub basins not only here, but across the nation. This sub basin, along with some others here would also receive the benefit of North East (Oct-Dec) monsoon.
In Conclusion The reporting of river basin wise rainfall figures is surely most welcome development. We hope media will start using these figures, rather than reporting only state and sub division figures. We also hope IMD will develop this further and break the rivers into further sub basins, so that the figures are more useful for all kind of hydrological work.
SANDRP (ht.sandrp@gmail.com)
PS: We wrote about the river basin wise rainfall data after the 2006 monsoon too, see: https://sandrp.wordpress.com/2016/10/13/welcome-development-river-basin-wise-rainfall-maps-from-imd/
END NOTES:
[i] IMD has divided India into 36 sub divisions. There is no clear logic in forming these sub divisions, since the boundaries of the sub division are not based on hydrology or geo-climate or administrative boundaries.
[ii] Excess rainfall was reported in Saurashtra and Kutch (35%), W Rajasthan (39), Tamil Nadu and Pondicherry (31), Rayalseema (27) and Nagaland, Manipur, Mizoram (25%).
[iii] Huge and very important agricultural belt, in fact is covered by this Red Zone on IMD map showing deficit rainfall: Punjab (-22%), Haryana & Delhi (-26), W Uttar Pradesh (-31), E Uttar Pradesh (-28), E Madhya Pradesh (-24) and Vidarbha (-23). 50 districts of UP were declared drought hit in 2016 and it seems UP is again going to face drought like situation in large parts of the state.

River sub basin wise rain fall maps are with many discrepancies.
Ravi, Upper Tungabhadra and middle Krishna sub basins are indicated but not named and rainfall data not given. Entire west flowing small to medium rivers are aggregated as one zone which is illogical. at least it should be divided further by state wise.
The river course path/lines are to be given in the background for better representation of river basins with main reservoirs location. Also it should be a interactive map giving location of rainfall gauging stations and their total number in a sub basin.
There is wide difference between states data and IMD rain fall data. Above improvements would enhance the authenticity of rainfall data presented.
LikeLike
Yes, I totally agree with everything you have said. About the west flowing rivers, I have already mentioned that as also for upper Tungabhadra basin. You are right about other aspects. Thanks a lot.
Himanshu
LikeLike
Excellent collation of the data and analysis that highlights the key points.
LikeLike