Guest Blog by Prof Vimal Mishra (IIT Gandhinagar)
Introduction: Real-time drought monitoring and forecast in India is essential to support a large agricultural community. Prof. Vimal Mishra and his group (Water and Climate Lab) developed a real-time drought monitoring platform for India. The system provides conditions based on meteorological (rainfall based), hydrological (runoff based), and agricultural (soil moisture based) droughts and updates everyday. The products are based on real-time satellite rainfall, which was corrected using the long-term climatology from the India meteorological department (IMD). Runoff and root zone soil moisture are simulated using a well evaluated hydrologic model. All the drought products are extensively verified against other drought indicators such as satellite based drought severity index. Further information on monitor can be obtained in Shah and Mishra (2015).
Products:
- Area Under Drought:

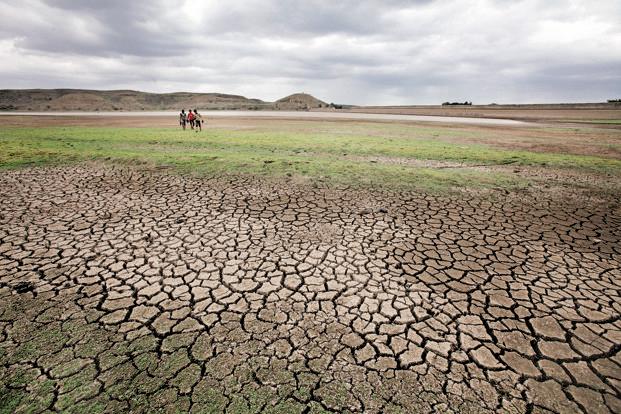
Each day, area under drought in India and different states is obtained using the standardized precipitation index (SPI), standardized runoff index (SRI), and standardized soil moisture index (SSI). In the map, areas in white color show normal conditions (i.e. no drought) while warm colors indicate presence of different category of drought. For instance, in the current map, we can see that Tamilnadu and Karnataka are under extreme meteorological drought based on the last 3-months accumulated rainfall. Similarly, a few areas in India are under abnormal to moderate hydrological drought based on 1 month accumulated runoff. Agricultural drought, which is based on one-month root zone soil moisture, is present in some parts under abnormal and moderate categories.
2. Short to long-term droughts
The monitor also provides drought conditions based on 1-24 months accumulated rainfall, runoff, and root zone soil moisture. This gives us the idea about the presence of short (1-3 month) and relatively long-term (6-24 months) drought conditions. Short-term droughts are likely to relieve with rainfall while long-term droughts need more rainfall before drought can go away. For instance, the map below shows that parts of West Bengal, Bihar, and Jharkhand have severe drought based on 9-months accumulated root-zone soil moisture.
 3. Observed Rainfall
The drought monitor provides observed rainfall for 1, 7, 15, and 30 day. Rainfall is based on TRMM satellite and corrected using the IMD data. The correction methods have been well evaluated and published in the peer reviewed journal (Shah and Mishra, 2015). Rainfall for various time periods gives us an idea about the regions that have received significant rainfall and the regions that may be under deficit. Users can freely download the data from the system that is available for each 0.25 degree (about 25 km) grid cell in India.
 4. Rainfall Forecast
The drought monitoring system also provides 1-7 day lead rainfall forecast which is based on the Global Ensemble Forecast System (GEFS) reforecast. The forecast is available at 0.25 degree for entire India. The forecast has been well evaluated and its skill was tested. More information on the forecast can be obtained from the publication Shah and Mishra (2016). The 7-day lead forecast provides an important information on rainfall for next 7 days that can be used to understand heavy rainfall or other conditions, which may help in planning for agriculture and water management.

5. Drought Forecast
The drought monitoring system provides day-to-day basis information on short-term (7day lead) forecast on drought (warm colors in map show drought affected areas). This information is compared with the observed soil moisture and runoff conditions for the last 7 day and how they are likely to change in next 7 days. This information is in particular important for farmers who are thinking to irrigate or harvest their crops.

Real-time Information at district level
The drought monitor provides real-time agricultural drought information at district level that can be used for planning and administration. Entire India is divided into 5 zones: north central, northeastern, northern, southern, and western. For each zone maps are available where district level drought information can be obtained. Efforts are underway to develop the system that can provide block to village level information, which will be available in future.

Contact Information:
Vimal Mishra, Civil Engineering, Indian Institute of Technology (IIT) Gandhinagar
vmishra@iitgn.ac.in, 9687944337. Prof Mishra is affiliated to:
- Civil Engineering, Indian Institute of Technology Gandhinagar
- ITRA Project: Measurement to Management (M2M): Improved Water Use Efficiency and Agricultural Productivity Through Experimental Sensor Network
He would like to add an Acknowledgement: The work is undertaken as part of ITRA, Media Lab Asia project entitled “Measurement to Management (M2M): Improved Water Use Efficiency and Agricultural Productivity through Experimental Sensor Network”.
The site: https://sites.google.com/a/iitgn.ac.in/india_drought_monitor/home
References:
RD Shah, V Mishra, Journal of Hydrometeorology 16 (1), 327-345
RD Shah, V Mishra, Journal of Hydrometeorology

Very laudable & useful model.
LikeLike
It is very informative and useful to agricultural field functionaries.Thank you all!
LikeLike
Really it is very useful post. Thanks for spending your important time to post such an interesting & useful collection of excellent resources that are always of great to everyone.
LikeLike
Hi
According to the definition of WMO (2006) drought, in contrast to aridity, drought affects almost all climates in the world, so aridity is a nature of a region but drought is a temporary event which we can elaborate to find ways for adaptation, and mitigation strategies, through monitoring and forecasting it.
For drought monitoring, we should apply drought indices, besides calculating the severity and duration of drought in a case study. We have three different classes of drought, namely Meteorological drought, Agricultural drought, and Hydrological drought.
For computing drought indices there are several difficulties in calculating steps related to the relevant equations. However, there are different codes and packages in MATLAB, R, and etc., but since every equation of indices needs to modify or changes in coefficients or other steps of relations, so if you don’t have enough knowledge about coding so you face to a huge challenge.
So I want to introduce you different tools that these are interesting in drought monitor and drought calculations, namely MDM (Meteorological Drought Monitor), RDIT (Rain-based Drought Indices Tool), and DMAP (Drought Monitor And Prediction).
See the below links for further information:
https://agrimetsoft.com/MDM…
https://agrimetsoft.com/RDI…
https://agrimetsoft.com/dro…
Regards,
Nasrin
LikeLike
Many thanks indeed, very educative and useful. Will go through.
Himanshu
LikeLike